1920 United States presidential election in California
| |||||||||||||||||||||||||||||||||
| Turnout | 71.87% (of registered voters) 47.26% (of eligible voters) | ||||||||||||||||||||||||||||||||
|---|---|---|---|---|---|---|---|---|---|---|---|---|---|---|---|---|---|---|---|---|---|---|---|---|---|---|---|---|---|---|---|---|---|
| |||||||||||||||||||||||||||||||||
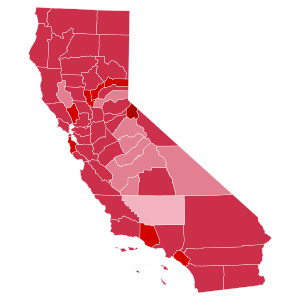
 County Results
Harding 40-50% 50-60% 60-70% 70-80% 90-100%
| |||||||||||||||||||||||||||||||||
| |||||||||||||||||||||||||||||||||
| Elections in California |
|---|
 |
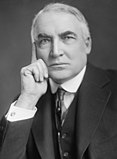
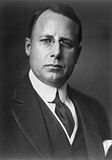
The 1920 United States presidential election in California took place on November 2, 1920, as part of the 1920 United States presidential election in which all 48 states participated. California voters chose 13 electors to represent them in the Electoral College via a popular vote pitting Democratic nominee, Governor James M. Cox of Ohio and his running mate, Assistant Secretary of the Navy Franklin D. Roosevelt of New York, against Republican challenger U.S. Senator Warren G. Harding of Ohio and his running mate, Governor Calvin Coolidge of Massachusetts.
By the beginning of 1920 skyrocketing inflation and President Woodrow Wilson's focus upon his proposed League of Nations at the expense of domestic policy had helped make the incumbent President very unpopular[2] – besides which Wilson also had major health problems that had left First Lady Edith Wilson effectively running the nation.
Political unrest observed in the Palmer Raids and the "Red Scare" further added to the unpopularity of the Democratic Party, since this global political turmoil produced considerable fear of alien revolutionaries invading the country.[3] Demand in the West for exclusion of Asian immigrants became even stronger than it had been before.[4] Another issue was the anti-Cox position taken by the Ku Klux Klan,[5] and Cox's inconsistent stance on newly passed Prohibition – he had been a "wet" but announced he would support Prohibition enforcement in August[5]
The West had been the chief presidential battleground ever since the "System of 1896" emerged following that election.[6] For this reason, Cox chose to tour the entire nation[7] and after touring the Pacific Northwest Cox went to California to defend his proposed League of Nations. Cox argued that the League could have stopped the Asian conflicts – like the Japanese seizure of Shandong – but his apparent defence of Chinese immigrants in the Bay Area was very unpopular and large numbers of hecklers attacked the Democratic candidate.[8] Moreover, the only attention Cox received in the Western press was severe criticism.[8]
In September, several opinion polls were conducted, all predicting that Harding would carry California, which had been extremely close in the two preceding elections, by over one hundred thousand votes.[9] By the end of October, although no more opinion polls had been published, most observers were even more convinced that the Republicans would take complete control of all branches of government.[10] On election day, Warren Harding carried California by a margin much larger than early polls predicted, winning with 66.20 percent of the vote to James Cox's 24.28 percent. Harding became the first of only two presidential nominees to sweep all of California's counties; the only other one was Franklin D. Roosevelt, the losing 1920 vice-presidential candidate, sixteen years later. Harding's 66.20 percent of the vote was the largest fraction for any presidential candidate in California until Roosevelt won with 66.95 percent in 1936, though his 41.92-percentage-point margin of victory is the largest for any candidate in the state.
This was the first time Mariposa County and Colusa County, the only counties in the Pacific States to support Democratic nominee Alton B. Parker in 1904, had ever voted Republican.[11] Plumas County would never vote Republican again until Ronald Reagan in 1980, and Amador, El Dorado and Placer Counties would not vote Republican again until Dwight D. Eisenhower in 1952.[11]
Results[]
| 1920 United States presidential election in California[12] | |||||
|---|---|---|---|---|---|
| Party | Candidate | Votes | Percentage | Electoral votes | |
| Republican | Warren G. Harding | 624,992 | 66.20% | 13 | |
| Democratic | James M. Cox | 229,191 | 24.28% | 0 | |
| Socialist | Eugene V. Debs | 64,076 | 6.79% | 0 | |
| Prohibition | Aaron S. Watkins | 25,204 | 2.67% | 0 | |
| No party | Others | 587 | 0.06% | 0 | |
| Totals | 944,050 | 100.00% | 13 | ||
| Voter turnout | — | ||||
Results by county[]
| County | Warren Gamaliel Harding Republican |
James Middleton Cox Democratic |
Eugene Victor Debs Socialist |
Aaron Sherman Watkins Prohibition |
Various candidates Write-ins |
Margin | ||||||
|---|---|---|---|---|---|---|---|---|---|---|---|---|
| % | # | % | # | % | # | % | # | % | # | % | # | |
| Alpine | 91.43% | 64 | 8.57% | 6 | 0.00% | 0 | 0.00% | 0 | 82.86% | 58 | ||
| Ventura | 76.00% | 5,231 | 18.96% | 1,305 | 2.63% | 181 | 2.41% | 166 | 57.04% | 3,926 | ||
| Orange | 71.52% | 12,797 | 19.57% | 3,502 | 3.53% | 632 | 5.38% | 962 | 51.95% | 9,295 | ||
| San Mateo | 70.52% | 7,205 | 19.16% | 1,958 | 9.36% | 956 | 0.96% | 98 | 51.36% | 5,247 | ||
| Humboldt | 69.89% | 6,528 | 19.04% | 1,778 | 8.17% | 763 | 2.90% | 271 | 50.85% | 4,750 | ||
| Sierra | 72.18% | 506 | 22.54% | 158 | 3.42% | 24 | 1.85% | 13 | 49.64% | 348 | ||
| Alameda | 69.11% | 73,177 | 20.27% | 21,468 | 8.75% | 9,266 | 1.87% | 1,978 | 48.84% | 51,709 | ||
| Riverside | 69.55% | 9,124 | 21.33% | 2,798 | 5.26% | 690 | 3.86% | 506 | 48.22% | 6,326 | ||
| Napa | 70.99% | 4,448 | 23.05% | 1,444 | 4.37% | 274 | 1.60% | 100 | 47.94% | 3,004 | ||
| Los Angeles | 69.10% | 178,117 | 21.59% | 55,661 | 5.69% | 14,674 | 3.42% | 8,812 | 0.20% | 506 | 47.51% | 122,456 |
| Marin | 68.80% | 5,375 | 21.61% | 1,688 | 8.09% | 632 | 1.51% | 118 | 47.19% | 3,687 | ||
| Sutter | 70.32% | 1,862 | 24.02% | 636 | 2.61% | 69 | 3.06% | 81 | 46.30% | 1,226 | ||
| Yuba | 70.70% | 2,012 | 24.46% | 696 | 2.88% | 82 | 1.97% | 56 | 46.24% | 1,316 | ||
| Santa Clara | 68.09% | 19,565 | 22.57% | 6,485 | 5.80% | 1,667 | 3.53% | 1,015 | 45.52% | 13,080 | ||
| Mono | 67.73% | 170 | 22.31% | 56 | 8.76% | 22 | 1.20% | 3 | 45.42% | 114 | ||
| San Francisco | 65.18% | 96,105 | 22.13% | 32,637 | 11.56% | 17,049 | 1.11% | 1,630 | 0.02% | 29 | 43.05% | 63,468 |
| Monterey | 67.76% | 4,817 | 24.91% | 1,771 | 3.70% | 263 | 3.63% | 258 | 42.85% | 3,046 | ||
| Santa Barbara | 67.48% | 6,970 | 25.04% | 2,586 | 4.80% | 496 | 2.68% | 277 | 42.44% | 4,384 | ||
| Santa Cruz | 66.28% | 5,285 | 24.54% | 1,957 | 5.17% | 412 | 4.01% | 320 | 41.74% | 3,328 | ||
| Nevada | 64.97% | 2,055 | 23.62% | 747 | 8.82% | 279 | 2.59% | 82 | 41.35% | 1,308 | ||
| Sonoma | 66.90% | 10,377 | 26.24% | 4,070 | 4.38% | 680 | 2.48% | 385 | 40.66% | 6,307 | ||
| Mendocino | 65.83% | 4,443 | 26.51% | 1,789 | 5.94% | 401 | 1.72% | 116 | 39.32% | 2,654 | ||
| Lassen | 66.22% | 1,582 | 26.92% | 643 | 4.06% | 97 | 2.80% | 67 | 39.30% | 939 | ||
| Contra Costa | 63.75% | 9,041 | 24.56% | 3,483 | 9.94% | 1,410 | 1.75% | 248 | 39.19% | 5,558 | ||
| Butte | 65.69% | 5,409 | 27.47% | 2,262 | 4.12% | 339 | 2.72% | 224 | 38.22% | 3,147 | ||
| Plumas | 63.96% | 999 | 25.80% | 403 | 7.30% | 114 | 2.94% | 46 | 38.16% | 596 | ||
| Solano | 64.77% | 7,102 | 26.94% | 2,954 | 6.78% | 743 | 1.51% | 166 | 37.83% | 4,148 | ||
| San Luis Obispo | 61.31% | 4,123 | 23.88% | 1,606 | 9.56% | 643 | 4.48% | 301 | 0.77% | 52 | 37.43% | 2,517 |
| Imperial | 64.51% | 4,699 | 27.76% | 2,022 | 5.13% | 374 | 2.59% | 189 | 36.75% | 2,677 | ||
| San Diego | 63.78% | 19,826 | 27.27% | 8,478 | 5.83% | 1,812 | 3.12% | 971 | 36.51% | 11,348 | ||
| Calaveras | 63.96% | 1,480 | 27.70% | 641 | 4.80% | 111 | 3.54% | 82 | 36.26% | 839 | ||
| El Dorado | 64.36% | 1,636 | 28.56% | 726 | 4.52% | 115 | 2.56% | 65 | 35.80% | 910 | ||
| San Benito | 65.00% | 1,965 | 29.77% | 900 | 2.45% | 74 | 2.78% | 84 | 35.23% | 1,065 | ||
| Sacramento | 64.87% | 15,634 | 29.67% | 7,150 | 3.92% | 944 | 1.54% | 372 | 35.20% | 8,484 | ||
| Merced | 62.99% | 3,457 | 28.01% | 1,537 | 6.03% | 331 | 2.97% | 163 | 34.98% | 1,920 | ||
| Stanislaus | 61.61% | 7,038 | 26.74% | 3,055 | 5.09% | 582 | 6.55% | 748 | 34.87% | 3,983 | ||
| Tehama | 61.81% | 2,462 | 27.09% | 1,079 | 5.80% | 231 | 5.30% | 211 | 34.72% | 1,383 | ||
| San Bernardino | 62.84% | 12,518 | 28.21% | 5,620 | 4.47% | 890 | 4.48% | 893 | 34.63% | 6,898 | ||
| Trinity | 62.89% | 622 | 28.82% | 285 | 7.58% | 75 | 0.71% | 7 | 34.07% | 337 | ||
| Glenn | 64.19% | 1,916 | 30.22% | 902 | 2.98% | 89 | 2.61% | 78 | 33.97% | 1,014 | ||
| Amador | 64.13% | 1,350 | 30.36% | 639 | 2.99% | 63 | 2.52% | 53 | 33.77% | 711 | ||
| Del Norte | 62.61% | 596 | 29.31% | 279 | 5.15% | 49 | 2.94% | 28 | 33.30% | 317 | ||
| Shasta | 62.07% | 2,108 | 30.27% | 1,028 | 6.04% | 205 | 1.62% | 55 | 31.80% | 1,080 | ||
| Yolo | 61.95% | 3,375 | 32.80% | 1,787 | 2.44% | 133 | 2.81% | 153 | 29.15% | 1,588 | ||
| Siskiyou | 60.05% | 2,909 | 31.01% | 1,502 | 6.96% | 337 | 1.98% | 96 | 29.04% | 1,407 | ||
| Tuolumne | 59.38% | 1,285 | 30.45% | 659 | 7.26% | 157 | 2.91% | 63 | 28.93% | 626 | ||
| Modoc | 62.59% | 992 | 33.75% | 535 | 2.27% | 36 | 1.39% | 22 | 28.84% | 457 | ||
| Tulare | 61.26% | 9,136 | 32.43% | 4,837 | 3.53% | 527 | 2.78% | 414 | 28.83% | 4,299 | ||
| San Joaquin | 60.94% | 12,003 | 32.93% | 6,487 | 3.53% | 695 | 2.60% | 513 | 28.01% | 5,516 | ||
| Colusa | 61.24% | 1,645 | 33.77% | 907 | 2.68% | 72 | 2.31% | 62 | 27.47% | 738 | ||
| Placer | 59.44% | 2,894 | 32.02% | 1,559 | 5.91% | 288 | 2.63% | 128 | 27.42% | 1,335 | ||
| Kings | 59.61% | 2,806 | 34.08% | 1,604 | 3.82% | 180 | 2.49% | 117 | 25.53% | 1,202 | ||
| Inyo | 57.20% | 1,195 | 32.65% | 682 | 8.62% | 180 | 1.53% | 32 | 24.55% | 513 | ||
| Lake | 57.23% | 993 | 32.91% | 571 | 4.32% | 75 | 5.53% | 96 | 24.32% | 422 | ||
| Madera | 55.46% | 1,779 | 35.69% | 1,145 | 5.64% | 181 | 3.21% | 103 | 19.77% | 634 | ||
| Fresno | 55.36% | 14,621 | 36.39% | 9,613 | 5.40% | 1,426 | 2.85% | 753 | 18.97% | 5,008 | ||
| Mariposa | 55.38% | 484 | 36.61% | 320 | 6.06% | 53 | 1.95% | 17 | 18.77% | 164 | ||
| Kern | 49.01% | 7,079 | 42.20% | 6,095 | 6.46% | 933 | 2.33% | 337 | 6.81% | 984 | ||
References[]
- ^ https://elections.cdn.sos.ca.gov/sov/2018-general/sov/04-historical-voter-reg-participation.pdf
- ^ Goldberg, David Joseph; Discontented America: The United States in the 1920s, p. 44 ISBN 0801860059
- ^ Leuchtenburg, William E.; The Perils of Prosperity, 1914-1932, p. 75 ISBN 0226473724
- ^ Vought, Hans P. ; The Bully Pulpit and the Melting Pot: American Presidents And The Immigrant, 1897-1933, p. 167 ISBN 0865548870
- ^ a b Brake, Robert J.; 'The porch and the stump: Campaign strategies in the 1920 presidential election'; Quarterly Journal of Speech, 55(3), pp. 256-267
- ^ Faykosh, Joseph D., Bowling Green State University; The Front Porch of the American People: James Cox and the Presidential Election of 1920 (thesis), p. 68
- ^ Faykosh, The Front Porch of the American People (thesis), p. 69
- ^ a b Faykosh, The Front Porch of the American People (thesis), p. 74
- ^ 'Predict Republican Victory in California: Senator Harding Pleases Delegation; Majority of 100,000 Forecast'; Los Angeles Times, September 16, 1920, p. 12
- ^ 'Republicans Going to Win: Prospects of a Complete Victory'; The Observer, October 31, 1920, p. 13
- ^ a b Menendez, Albert J.; The Geography of Presidential Elections in the United States, 1868-2004, pp. 153-155 ISBN 0786422173
- ^ "1920 Presidential General Election Results - California". Dave Leip's U.S. Election Atlas. Retrieved 2008-08-25.
- 1920 California elections
- 1920 United States presidential election by state
- United States presidential elections in California


