Election in Virginia
Main article: 1928 United States presidential election
1928 United States presidential election in Virginia
Nominee
Herbert Hoover Al Smith
Party
Republican
Democratic
Home state
California
New York
Running mate
Charles Curtis Joseph T. Robinson
Electoral vote
12
0
Popular vote
164,609
140,146
Percentage
53.91%
45.90%
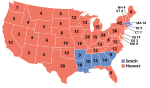
County Results
Hoover
50-60%
60-70%
70-80%
Smith
40-50%
50-60%
60-70%
70-80%
President before election Calvin Coolidge Republican
Elected President Herbert Hoover Republican
The 1928 United States presidential election in Virginia took place on November 6, 1928. Voters chose 12 representatives, or electors to the Electoral College , who voted for president and vice president .
Virginia voted for the Republican nominee, former United States Secretary of Commerce Herbert Hoover , over the Democratic nominee, New York Governor Al Smith . Hoover ultimately carried the state with 53.91% of the vote. This was only the second election that Virginia had voted for a Republican candidate. The first was in 1872 during the Reconstruction era .
Results [ ]
1928 United States presidential election in Virginia[1]
Party
Candidate
Votes
Percentage
Electoral votes
Republican Herbert Hoover 164,609
53.91%
12
Democratic
Al Smith
140,146
45.90%
0
Socialist
Norman Thomas
250
0.08%
0
Socialist Labor
Verne L. Reynolds
180
0.06%
0
Workers
William Z. Foster
173
0.06%
0
Totals
305,358
100.00%
12
Results by county [ ]
County or Independent City
Herbert Clark Hoover
Alfred Emmanuel Smith
Various candidates
Margin
Total votes cast[2]
#
%
#
%
#
%
#
%
Accomack County
1,367
42.79%
1,826
57.15%
2
0.06%
-459
-14.37%
3,195
Albemarle County
846
34.97%
1,571
64.94%
2
0.08%
-725
-29.97%
2,419
Alleghany County
1,642
72.53%
622
27.47%
0
0.00%
1,020
45.05%
2,264
Amelia County
277
35.70%
498
64.18%
1
0.13%
-221
-28.48%
776
Amherst County
447
23.53%
1,442
75.89%
11
0.58%
-995
-52.37%
1,900
Appomattox County
446
33.43%
885
66.34%
3
0.22%
-439
-32.91%
1,334
Arlington County
4,274
74.41%
1,444
25.14%
26
0.45%
2,830
49.27%
5,744
Augusta County
2,679
63.82%
1,507
35.90%
12
0.29%
1,172
27.92%
4,198
Bath County
731
63.90%
409
35.75%
4
0.35%
322
28.15%
1,144
Bedford County
1,118
43.64%
1,436
56.05%
8
0.31%
-318
-12.41%
2,562
Bland County
826
58.92%
575
41.01%
1
0.07%
251
17.90%
1,402
Botetourt County
1,575
56.70%
1,200
43.20%
3
0.11%
375
13.50%
2,778
Brunswick County
245
20.98%
922
78.94%
1
0.09%
-677
-57.96%
1,168
Buchanan County
1,333
49.24%
1,365
50.42%
9
0.33%
-32
-1.18%
2,707
Buckingham County
579
49.15%
599
50.85%
0
0.00%
-20
-1.70%
1,178
Campbell County
801
45.10%
967
54.45%
8
0.45%
-166
-9.35%
1,776
Caroline County
638
49.84%
639
49.92%
3
0.23%
-1
-0.08%
1,280
Carroll County
2,459
68.51%
1,117
31.12%
13
0.36%
1,342
37.39%
3,589
Charles City County
207
66.35%
105
33.65%
0
0.00%
102
32.69%
312
Charlotte County
403
26.58%
1,112
73.35%
1
0.07%
-709
-46.77%
1,516
Chesterfield County
1,325
54.89%
1,082
44.82%
7
0.29%
243
10.07%
2,414
Clarke County
248
25.08%
740
74.82%
1
0.10%
-492
-49.75%
989
Craig County
451
47.88%
489
51.91%
2
0.21%
-38
-4.03%
942
Culpeper County
753
47.36%
836
52.58%
1
0.06%
-83
-5.22%
1,590
Cumberland County
213
32.32%
442
67.07%
4
0.61%
-229
-34.75%
659
Dickenson County
1,868
49.76%
1,879
50.05%
7
0.19%
-11
-0.29%
3,754
Dinwiddie County
332
25.94%
945
73.83%
3
0.23%
-613
-47.89%
1,280
Elizabeth City County
1,122
57.78%
807
41.56%
13
0.67%
315
16.22%
1,942
Essex County
195
37.79%
321
62.21%
0
0.00%
-126
-24.42%
516
Fairfax County
2,507
66.98%
1,229
32.83%
7
0.19%
1,278
34.14%
3,743
Fauquier County
972
38.79%
1,531
61.09%
3
0.12%
-559
-22.31%
2,506
Floyd County
1,481
77.34%
433
22.61%
1
0.05%
1,048
54.73%
1,915
Fluvanna County
327
42.03%
447
57.46%
4
0.51%
-120
-15.42%
778
Franklin County
1,529
45.05%
1,861
54.83%
4
0.12%
-332
-9.78%
3,394
Frederick County
1,006
46.77%
1,140
53.00%
5
0.23%
-134
-6.23%
2,151
Giles County
1,313
50.23%
1,293
49.46%
8
0.31%
20
0.77%
2,614
Gloucester County
614
51.12%
587
48.88%
0
0.00%
27
2.25%
1,201
Goochland County
318
42.18%
431
57.16%
5
0.66%
-113
-14.99%
754
Grayson County
2,728
61.25%
1,713
38.46%
13
0.29%
1,015
22.79%
4,454
Greene County
423
61.93%
259
37.92%
1
0.15%
164
24.01%
683
Greensville County
318
37.90%
519
61.86%
2
0.24%
-201
-23.96%
839
Halifax County
1,091
28.37%
2,742
71.31%
12
0.31%
-1,651
-42.94%
3,845
Hanover County
592
41.60%
831
58.40%
0
0.00%
-239
-16.80%
1,423
Henrico County
1,887
57.87%
1,349
41.37%
25
0.77%
538
16.50%
3,261
Henry County
1,139
47.28%
1,267
52.59%
3
0.12%
-128
-5.31%
2,409
Highland County
623
62.36%
371
37.14%
5
0.50%
252
25.23%
999
Isle of Wight County
555
51.10%
531
48.90%
0
0.00%
24
2.21%
1,086
James City County
204
50.12%
201
49.39%
2
0.49%
3
0.74%
407
King and Queen County
319
52.90%
280
46.43%
4
0.66%
39
6.47%
603
King George County
413
57.04%
309
42.68%
2
0.28%
104
14.36%
724
King William County
329
43.06%
431
56.41%
4
0.52%
-102
-13.35%
764
Lancaster County
520
62.28%
315
37.72%
0
0.00%
205
24.55%
835
Lee County
3,337
58.23%
2,383
41.58%
11
0.19%
954
16.65%
5,731
Loudoun County
1,325
40.84%
1,915
59.03%
4
0.12%
-590
-18.19%
3,244
Louisa County
772
51.23%
734
48.71%
1
0.07%
38
2.52%
1,507
Lunenburg County
314
20.75%
1,199
79.25%
0
0.00%
-885
-58.49%
1,513
Madison County
772
56.97%
580
42.80%
3
0.22%
192
14.17%
1,355
Mathews County
855
66.43%
431
33.49%
1
0.08%
424
32.94%
1,287
Mecklenburg County
784
30.90%
1,752
69.06%
1
0.04%
-968
-38.16%
2,537
Middlesex County
318
44.35%
397
55.37%
2
0.28%
-79
-11.02%
717
Montgomery County
1,861
65.64%
967
34.11%
7
0.25%
894
31.53%
2,835
Nansemond County
649
46.79%
737
53.14%
1
0.07%
-88
-6.34%
1,387
Nelson County
618
33.68%
1,216
66.27%
1
0.05%
-598
-32.59%
1,835
New Kent County
217
54.66%
178
44.84%
2
0.50%
39
9.82%
397
Norfolk County
1,922
57.39%
1,418
42.34%
9
0.27%
504
15.05%
3,349
Northampton County
688
42.39%
935
57.61%
0
0.00%
-247
-15.22%
1,623
Northumberland County
744
72.09%
286
27.71%
2
0.19%
458
44.38%
1,032
Nottoway County
667
40.33%
986
59.61%
1
0.06%
-319
-19.29%
1,654
Orange County
732
46.39%
846
53.61%
0
0.00%
-114
-7.22%
1,578
Page County
1,580
60.65%
1,025
39.35%
0
0.00%
555
21.31%
2,605
Patrick County
1,191
57.26%
883
42.45%
6
0.29%
308
14.81%
2,080
Pittsylvania County
2,598
60.52%
1,688
39.32%
7
0.16%
910
21.20%
4,293
Powhatan County
189
39.71%
287
60.29%
0
0.00%
-98
-20.59%
476
Prince Edward County
494
41.24%
699
58.35%
5
0.42%
-205
-17.11%
1,198
Prince George County
235
35.34%
428
64.36%
2
0.30%
-193
-29.02%
665
Prince William County
817
49.73%
826
50.27%
0
0.00%
-9
-0.55%
1,643
Princess Anne County
1,040
55.23%
841
44.66%
2
0.11%
199
10.57%
1,883
Pulaski County
1,998
52.32%
1,821
47.68%
0
0.00%
177
4.63%
3,819
Rappahannock County
329
39.07%
513
60.93%
0
0.00%
-184
-21.85%
842
Richmond County
467
61.53%
292
38.47%
0
0.00%
175
23.06%
759
Roanoke County
2,675
67.53%
1,284
32.42%
2
0.05%
1,391
35.12%
3,961
Rockbridge County
1,206
47.78%
1,311
51.94%
7
0.28%
-105
-4.16%
2,524
Rockingham County
3,822
73.06%
1,402
26.80%
7
0.13%
2,420
46.26%
5,231
Russell County
2,006
44.38%
2,511
55.55%
3
0.07%
-505
-11.17%
4,520
Scott County
2,916
55.28%
2,355
44.64%
4
0.08%
561
10.64%
5,275
Shenandoah County
3,420
68.01%
1,589
31.60%
20
0.40%
1,831
36.41%
5,029
Smyth County
2,751
58.53%
1,937
41.21%
12
0.26%
814
17.32%
4,700
Southampton County
648
43.40%
844
56.53%
1
0.07%
-196
-13.13%
1,493
Spotsylvania County
654
59.78%
439
40.13%
1
0.09%
215
19.65%
1,094
Stafford County
797
64.27%
441
35.56%
2
0.16%
356
28.71%
1,240
Surry County
157
22.43%
541
77.29%
2
0.29%
-384
-54.86%
700
Sussex County
385
41.31%
547
58.69%
0
0.00%
-162
-17.38%
932
Tazewell County
3,072
60.65%
1,979
39.07%
14
0.28%
1,093
21.58%
5,065
Warren County
564
44.20%
710
55.64%
2
0.16%
-146
-11.44%
1,276
Warwick County
465
60.78%
298
38.95%
2
0.26%
167
21.83%
765
Washington County
3,449
56.25%
2,666
43.48%
17
0.28%
783
12.77%
6,132
Westmoreland County
554
58.50%
393
41.50%
0
0.00%
161
17.00%
947
Wise County
4,504
49.63%
4,559
50.24%
12
0.13%
-55
-0.61%
9,075
Wythe County
2,540
62.56%
1,516
37.34%
4
0.10%
1,024
25.22%
4,060
York County
642
76.70%
194
23.18%
1
0.12%
448
53.52%
837
Alexandria City
1,617
55.26%
1,307
44.67%
2
0.07%
310
10.59%
2,926
Bristol City
630
40.49%
922
59.25%
4
0.26%
-292
-18.77%
1,556
Buena Vista City
267
60.68%
172
39.09%
1
0.23%
95
21.59%
440
Charlottesville City
708
41.57%
992
58.25%
3
0.18%
-284
-16.68%
1,703
Clifton Forge City
781
56.92%
591
43.08%
0
0.00%
190
13.85%
1,372
Danville City
2,360
66.27%
1,196
33.59%
5
0.14%
1,164
32.69%
3,561
Fredericksburg City
697
53.91%
594
45.94%
2
0.15%
103
7.97%
1,293
Hampton City
544
46.90%
615
53.02%
1
0.09%
-71
-6.12%
1,160
Harrisonburg City
1,037
62.66%
616
37.22%
2
0.12%
421
25.44%
1,655
Hopewell City
505
51.11%
482
48.79%
1
0.10%
23
2.33%
988
Lynchburg City
2,730
57.88%
1,987
42.12%
0
0.00%
743
15.75%
4,717
Newport News City
3,118
61.34%
1,951
38.38%
14
0.28%
1,167
22.96%
5,083
Norfolk City
8,392
58.65%
5,888
41.15%
29
0.20%
2,504
17.50%
14,309
Petersburg City
909
39.69%
1,379
60.22%
2
0.09%
-470
-20.52%
2,290
Portsmouth City
3,474
57.04%
2,587
42.48%
29
0.48%
887
14.56%
6,090
Radford City
524
58.29%
373
41.49%
2
0.22%
151
16.80%
899
Richmond City
10,767
51.20%
10,213
48.57%
49
0.23%
554
2.63%
21,029
Roanoke City
6,471
61.62%
4,018
38.26%
12
0.11%
2,453
23.36%
10,501
South Norfolk City
865
84.56%
158
15.44%
0
0.00%
707
69.11%
1,023
Staunton City
1,026
58.13%
733
41.53%
6
0.34%
293
16.60%
1,765
Suffolk City
573
47.28%
637
52.56%
2
0.17%
-64
-5.28%
1,212
Williamsburg City
98
24.02%
310
75.98%
0
0.00%
-212
-51.96%
408
Winchester City
1,168
59.35%
794
40.35%
6
0.30%
374
19.00%
1,968
Totals
164,609
53.91%
140,146
45.89%
609
0.20%
24,463
8.01%
305,364
References [ ]
State and district results of the 1928 United States presidential election
Alabama Arizona Arkansas California Colorado Connecticut Delaware Florida Georgia Idaho Illinois Indiana Iowa Kansas Kentucky Louisiana Maine Maryland Massachusetts Michigan Minnesota Mississippi Missouri Montana Nebraska Nevada New Hampshire New Jersey New Mexico New York North Carolina North Dakota Ohio Oklahoma Oregon Pennsylvania Rhode Island South Carolina South Dakota Tennessee Texas Utah Vermont Virginia Washington West Virginia Wisconsin Wyoming
Elections in the United States
See also
Presidential elections Senate elections House elections Gubernatorial elections