1929 United Kingdom general election
| |||||||||||||||||||||||||||||||||||||||||||||
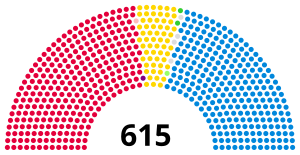
All 615 seats in the House of Commons 308 seats needed for a majority | |||||||||||||||||||||||||||||||||||||||||||||
|---|---|---|---|---|---|---|---|---|---|---|---|---|---|---|---|---|---|---|---|---|---|---|---|---|---|---|---|---|---|---|---|---|---|---|---|---|---|---|---|---|---|---|---|---|---|
| Turnout | 76.3%, | ||||||||||||||||||||||||||||||||||||||||||||
| |||||||||||||||||||||||||||||||||||||||||||||
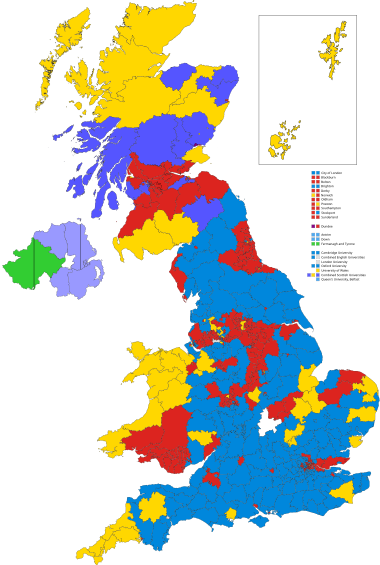 Colours denote the winning party—as shown in § Results | |||||||||||||||||||||||||||||||||||||||||||||
| |||||||||||||||||||||||||||||||||||||||||||||
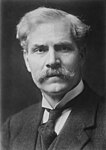

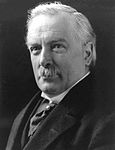
The 1929 United Kingdom general election was held on Thursday, 30 May 1929 and resulted in a hung parliament. It stands as the fourth of six instances under the secret ballot, and the first of three under universal suffrage, in which a party has lost on the popular vote but won the highest number (known as "a plurality") of seats versus all other parties (the others are 1874, January 1910, December 1910, 1951 and February 1974). In 1929, Ramsay MacDonald's Labour Party won the most seats in the House of Commons for the first time. The Liberal Party led again by former Prime Minister David Lloyd George regained some ground lost in the 1924 general election and held the balance of power.
The election was often referred to as the "Flapper Election", because it was the first in which women aged 21–29 had the right to vote (owing to the Representation of the People Act 1928). (Women over 30 had been able to vote since the 1918 general election.)
The election was fought against a background of rising unemployment, with the memory of the 1926 general strike still fresh in voters' minds. By 1929, the Cabinet was being described by many as "old and exhausted".[1]
The Liberals campaigned on a comprehensive programme of public works under the title "We Can Conquer Unemployment". The incumbent Conservatives campaigned on the theme of "Safety First", with Labour campaigning on the theme of "Labour & the Nation".
This was the first general election to be contested by the newly formed Welsh nationalist party Plaid Cymru.
It stood as the last time when a "third party" non-Labour or Conservative polled more than one-fifth of the popular vote until 1983, the next election thus ushering in five decades in which two-party politics dominated.
|
|
|
Results[]
| 287 | 59 | 260 | 9 |
| Labour | Lib | Conservative | O |
| Candidates | Votes | ||||||||||
|---|---|---|---|---|---|---|---|---|---|---|---|
| Party | Leader | Stood | Elected | Gained | Unseated | Net | % of total | % | No. | Net % | |
| Conservative | Stanley Baldwin | 590 | 260 | 2 | 154 | −152 | 42.3 | 38.1 | 8,252,527 | −8.7 | |
| Labour | Ramsay MacDonald | 569 | 287 | 140 | 4 | +136 | 46.7 | 37.1 | 8,048,968 | +3.8 | |
| Liberal | David Lloyd George | 513 | 59 | 36 | 17 | +19 | 9.6 | 23.6 | 5,104,638 | +5.8 | |
| Independent | N/A | 11 | 4 | 3 | 1 | +2 | 0.8 | 0.4 | 94,742 | +0.2 | |
| Communist | Harry Pollitt | 25 | 0 | 0 | 1 | −1 | 0.2 | 47,554 | −0.1 | ||
| Ind. Conservative | N/A | 8 | 0 | 0 | 0 | 0 | 0.2 | 46,278 | |||
| Scottish Prohibition | Edwin Scrymgeour | 1 | 1 | 0 | 0 | 0 | 0.2 | 0.1 | 25,037 | +0.1 | |
| Nationalist | Joseph Devlin | 3 | 2 | 2 | 0 | +2 | 0.5 | 0.1 | 24,177 | +0.1 | |
| Independent Labour | N/A | 4 | 1 | 1 | 0 | +1 | 0.2 | 0.1 | 20,825 | +0.1 | |
| Independent Liberal | N/A | 2 | 0 | 0 | 0 | 0 | 0.1 | 17,110 | +0.1 | ||
| National (Scotland) | Roland Muirhead | 2 | 0 | 0 | 0 | 0 | 0.0 | 3,313 | N/A | ||
| Plaid Cymru | Saunders Lewis | 1 | 0 | 0 | 0 | 0 | 0.0 | 609 | N/A | ||
| Irish Nationalist | T. P. O'Connor | 1 | 1 | 0 | 0 | 0 | 0.0 | 0 | N/A | ||
Votes summary[]
Seats summary[]
Constituency results[]
Transfers of seats[]
- All comparisons are with the 1924 election.
- In some cases, the change is owing to the MP having defected to the gaining party, and then retaining the seat in 1929. Such circumstances are marked with a *.
- In other circumstances, the change is owing to the seat having been won by the gaining party in a by-election in the intervening years, and then retained in 1929. Such circumstances are marked with a †.
| To | From | No. | Seats | ||
|---|---|---|---|---|---|
| Independent Labour | Labour | 1 | Govan* | ||
| Labour | Communist | 1 | Battersea North | ||
| Liberal | 15 | Chesterfield, South Shields, Walthamstow West, Bristol North, Bristol South, Kingston upon Hull Central*, Blackburn (one of two), Oldham (one of two), Hackney South, Lambeth North, Bradford East, Batley and Morley, Wrexham, Carmarthen, Swansea West | |||
| Constitutionalist | 3 | Walthamstow East1, Accrington2, Stoke2 | |||
| Conservative | 121 | Stirlingshire West, Dunbartonshire, Lanark, Partick, Lanarkshire North†, Renfrewshire West, Maryhill, Kilmarnock, Edinburgh West, Linlithgow†, Berwick & Haddington, Reading, Birkenhead West, Crewe, Stalybridge and Hyde, Stockport (one of two)†, Carlisle, Whitehaven, Derby (one of two), Belper, Derbyshire South, Drake, Barnard Castle, Sedgefield, Darlington†, Stockton-on-Tees, Sunderland (both seats), Leyton East, East Ham North, Essex SE, Leyton West, Romford, Upton, Bristol Central, Portsmouth Central, Southampton (both seats), Dudley, Stourbridge†, Kingston upon Hull East, Kingston upon Hull South West, Chatham, Dartford, Blackburn (one of two), Ormskirk, Rossendale, Ashton-under-Lyne†, Bolton (both seats), Eccles, Hulme, Oldham (one of two), Salford North, Salford South, Salford West, Bootle, Everton, Kirkdale, Warrington, Widnes, Leicester East, Loughborough, Brigg, Fulham West, Hammersmith South, Islington North, Kensington North, Battersea South†, Greenwich, Islington East, Camberwell North-West, Hackney Central, Kennington, Hammersmith North†, St Pancras North, St Pancras South East, St Pancras South West, Wandsworth Central, Norfolk South West, Norwich (one of two), Kettering, Northampton†, Peterborough, Bassetlaw, Nottingham South, The Wrekin, Frome, Lichfield, Walsall, Wolverhampton West, Nuneaton, Duddeston, Coventry, Aston, Deritend, Erdington, Ladywood, Yardley, Swindon, York, Cleveland, Acton, Enfield, Tottenham South, Sheffield Central, Bradford North, Leeds Central, Sowerby, Wakefield, Sheffield Park, Bradford Central, Pontefract, Newport (Monmouthshire), Brecon and Radnor, Llandaff & Barry, Cardiff Central, Cardiff East, Cardiff South | |||
| Speaker | 1 | Halifax† | |||
| Independent | 1 | Mossley | |||
| Labour gains: | 142 | ||||
| Liberal | Labour | 2 | Bethnal Green North-East, Newcastle upon Tyne East | ||
| Constitutionalist | 2 | Camborne, Heywood and Radcliffe* | |||
| Conservative | 32 | Banff, Aberdeenshire West and Kincardine, Fife East, Dumfriesshire, Galloway, Bedfordshire Mid, Luton, Huntingdonshire, Isle of Ely, Birkenhead East, Eddisbury, Bodmin, Cornwall North, Penryn and Falmouth, St Ives†, South Molton, Dorset East, Harwich, Hereford, Ashford, Darwen, Preston (one of two), Blackley, Withington, Bosworth†, Holland with Boston†, Great Yarmouth, Norfolk East, Nottingham East, Eye, Flintshire, Pembrokeshire | |||
| Liberal gains: | 36 | ||||
| Conservative | Labour | 1 | King's Norton | ||
| Constitutionalist | 1 | Epping* | |||
| Conservative gains: | 2 | ||||
| Independent | Constitutionalist | 1 | Stretford* | ||
| Conservative | 2 | Combined English Universities (one of two), Exeter* | |||
| Nationalist | UUP | 2 | Fermanagh and Tyrone (both seats) | ||
- 1 Previous MP had defected to the Conservatives by the 1929 election
- 2 Previous MP had defected to the Liberals by the 1929 election
See also[]
- List of MPs elected in the 1929 United Kingdom general election
- 1929 United Kingdom general election in Northern Ireland
- Constituency election results in the 1929 United Kingdom general election
References[]
- ^ Doerr 1998, pp. 104–5.
- ^ Tetteh, Edmund (1 February 2008). "Election Statistics: UK 1918-2007" (PDF). parliament.uk. Archived from the original (PDF) on 8 July 2014. Retrieved 23 May 2014.
Sources[]
- Craig, F. W. S. (1989), British Electoral Facts: 1832–1987, Dartmouth: Gower, ISBN 0900178302
- Doerr, Paul W. (1998), British foreign policy 1919–1939, Manchester: Manchester University Press, ISBN 0719046718
Further reading[]
- Howell, David (2002), MacDonald's Party: Labour Identities and Crisis, 1922–1939, Oxford
- Redvaldsen, David (2010), "'Today is the Dawn': The Labour Party and the 1929 General Election", Parliamentary History, 29 (3): 395–415, doi:10.1111/j.1750-0206.2010.00213.x
- Williamson, Philip (1982), "'Safety First': Baldwin, the Conservative Party and the 1929 General Election" (PDF), Historical Journal, 25 (2): 385–409, doi:10.1017/S0018246X00011614
External links[]
- United Kingdom election results—summary results 1885–1979 Archived 31 January 2012 at WebCite
Manifestos[]
| General elections |
|
|---|---|
| Local elections |
|
| European elections | |
| Referendums |
|
- 1929 United Kingdom general election
- General elections to the Parliament of the United Kingdom
- 1929 elections in the United Kingdom
- 1929 in British politics
- May 1929 events