From Wikipedia, the free encyclopedia
1952 Japanese general election
First party
Second party
Third party
Leader
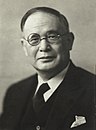
Shigeru Yoshida
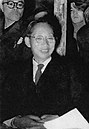
Mamoru Shigemitsu Jōtarō Kawakami
Party
Liberal
Kaishintō
Rightist Socialist
Leader's seat
Kōchi at-large
Ōita–2nd
Hyōgo–1st
Last election
Did not exist
Did not exist
Did not exist
Seats won
240
89
57
Seat change
New
New
New
Popular vote
16,938,221
6,429,450
4,108,274
Percentage
47.9%
18.2%
11.6%
Swing
New
New
New
Fourth party
Fifth party
Leader
Mosaburō Suzuki
Party
Leftist Socialist
Labourers–Farmers
Leader's seat
Tokyo–3rd
Okayama–1st
Last election
Did not exist
2.0%, 7 seats
Seats won
54
4
Seat change
New
Popular vote
3,398,597
261,190
Percentage
9.6%
0.7%
Swing
New
General elections were held in Japan on 1 October 1952. The result was a victory for the Liberal Party , which won 242 of the 466 seats.[1] [2]
Results [ ] Party Votes % Seats +/– Liberal Party 16,938,221 47.93 240 New Kaishintō 6,429,450 18.19 85 New Rightist Socialist Party of Japan 4,108,274 11.63 57 New Leftist Socialist Party of Japan 3,398,597 9.62 54 New Japanese Communist Party 896,765 2.54 0 –35 Labourers and Farmers Party 261,190 0.74 4 –3 Other parties 949,036 2.69 7 – Independents 2,355,172 6.66 19 +7 Total 35,336,705 100.00 466 0 Valid votes 35,336,705 98.85 Invalid/blank votes 412,349 1.15 Total votes 35,749,054 100.00 Registered voters/turnout 46,772,584 76.43 Source: Oscarsson , Masumi
By prefecture [ ] References [ ]
Categories :
1952 elections in Asia 1952 elections in Japan General elections in Japan October 1952 events Hidden categories:
Election and referendum articles with incomplete results