1972 United States presidential election in Pennsylvania
| ||||||||||||||||||||||||||
| ||||||||||||||||||||||||||
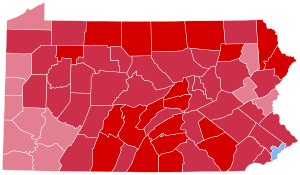 County Results
| ||||||||||||||||||||||||||
| ||||||||||||||||||||||||||

| Elections in Pennsylvania |
|---|
 |
|
show |
|
show |
|
show |
|
show |
|
show |
|
show |
|
|
The 1972 United States presidential election in Pennsylvania took place on November 7, 1972, and was part of the 1972 United States presidential election. Voters chose 27 representatives, or electors to the Electoral College, who voted for president and vice president.
Pennsylvania strongly voted for the Republican nominee, President Richard Nixon, over the Democratic nominee, Senator George McGovern. Nixon won Pennsylvania by a large margin of 19.98%, winning every county except for Philadelphia. This result nonetheless was over 3% more Democratic than the nation at-large. As of the 2020 presidential election, this is the last election in which Allegheny County voted Republican,[1] and the last time that county did not vote the same as Philadelphia. As of 2020, this marked the last time when the Republican presidential nominee carried the state by more than 10 percentage points and the most recent time when any presidential candidate won the state by over 15 points.
Results[]
| 1972 United States presidential election in Pennsylvania[2] | |||||
|---|---|---|---|---|---|
| Party | Candidate | Votes | Percentage | Electoral votes | |
| Republican | Richard Nixon | 2,714,521 | 59.11% | 27 | |
| Democratic | George McGovern | 1,796,951 | 39.13% | 0 | |
| Constitution | John G. Schmitz | 70,593 | 1.54% | 0 | |
| Socialist Workers | Linda Jenness | 4,639[a] | 0.10% | 0 | |
| Write-ins | Write-ins | 2,715[a] | 0.06% | 0 | |
| Communist | Gus Hall | 2,686[a] | 0.06% | 0 | |
| Totals | 4,592,106 | 100.0% | 27 | ||
| Voter Turnout (Voting age/Registered) | 56%/78% | ||||
Results by county[]
| County | Richard Milhous Nixon Republican |
George Stanley McGovern Democratic |
John George Schmitz[3] Constitutional |
Various candidates[3] Other parties |
Margin | Total votes cast | |||||
|---|---|---|---|---|---|---|---|---|---|---|---|
| # | % | # | % | # | % | # | % | # | % | ||
| Adams | 13,593 | 70.19% | 5,529 | 28.55% | 227 | 1.17% | 16 | 0.08% | 8,064 | 41.64% | 19,365 |
| Allegheny | 371,737 | 55.60% | 282,496 | 42.26% | 12,491 | 1.87% | 1,811 | 0.27% | 89,241 | 13.35% | 668,535 |
| Armstrong | 17,557 | 61.61% | 10,490 | 36.81% | 412 | 1.45% | 39 | 0.14% | 7,067 | 24.80% | 28,498 |
| Beaver | 43,637 | 56.42% | 31,570 | 40.82% | 1,718 | 2.22% | 412 | 0.53% | 12,067 | 15.60% | 77,337 |
| Bedford | 11,243 | 73.30% | 3,836 | 25.01% | 227 | 1.48% | 32 | 0.21% | 7,407 | 48.29% | 15,338 |
| Berks | 66,172 | 62.35% | 36,563 | 34.45% | 3,130 | 2.95% | 262 | 0.25% | 29,609 | 27.90% | 106,127 |
| Blair | 33,126 | 75.10% | 10,023 | 22.72% | 913 | 2.07% | 48 | 0.11% | 23,103 | 52.38% | 44,110 |
| Bradford | 15,050 | 73.57% | 5,204 | 25.44% | 179 | 0.87% | 25 | 0.12% | 9,846 | 48.13% | 20,458 |
| Bucks | 99,684 | 62.28% | 56,784 | 35.48% | 3,245 | 2.03% | 346 | 0.22% | 42,900 | 26.80% | 160,059 |
| Butler | 29,665 | 65.09% | 14,695 | 32.24% | 1,075 | 2.36% | 139 | 0.30% | 14,970 | 32.85% | 45,574 |
| Cambria | 43,825 | 60.05% | 27,950 | 38.30% | 894 | 1.23% | 306 | 0.42% | 15,875 | 21.75% | 72,975 |
| Cameron | 1,935 | 68.45% | 828 | 29.29% | 48 | 1.70% | 16 | 0.57% | 1,107 | 39.16% | 2,827 |
| Carbon | 11,639 | 59.05% | 7,774 | 39.44% | 274 | 1.39% | 25 | 0.13% | 3,865 | 19.61% | 19,712 |
| Centre | 20,683 | 60.48% | 13,194 | 38.58% | 273 | 0.80% | 47 | 0.14% | 7,489 | 21.90% | 34,197 |
| Chester | 72,726 | 68.44% | 31,118 | 29.29% | 2,281 | 2.15% | 134 | 0.13% | 41,608 | 39.16% | 106,259 |
| Clarion | 10,073 | 67.96% | 4,509 | 30.42% | 193 | 1.30% | 46 | 0.31% | 5,564 | 37.54% | 14,821 |
| Clearfield | 16,780 | 63.54% | 9,246 | 35.01% | 299 | 1.13% | 84 | 0.32% | 7,534 | 28.53% | 26,409 |
| Clinton | 8,205 | 62.54% | 4,772 | 36.37% | 107 | 0.82% | 35 | 0.27% | 3,433 | 26.17% | 13,119 |
| Columbia | 14,187 | 63.59% | 7,222 | 32.37% | 857 | 3.84% | 43 | 0.19% | 6,965 | 31.22% | 22,309 |
| Crawford | 18,393 | 64.38% | 9,371 | 32.80% | 760 | 2.66% | 45 | 0.16% | 9,022 | 31.58% | 28,569 |
| Cumberland | 42,099 | 72.87% | 14,562 | 25.20% | 1,010 | 1.75% | 104 | 0.18% | 27,537 | 47.66% | 57,775 |
| Dauphin | 54,307 | 69.38% | 22,587 | 28.86% | 1,270 | 1.62% | 106 | 0.14% | 31,720 | 40.53% | 78,270 |
| Delaware | 175,414 | 63.91% | 94,144 | 34.30% | 4,502 | 1.64% | 391 | 0.14% | 81,270 | 29.61% | 274,451 |
| Elk | 7,900 | 61.20% | 4,710 | 36.49% | 245 | 1.90% | 53 | 0.41% | 3,190 | 24.71% | 12,908 |
| Erie | 61,542 | 58.22% | 42,022 | 39.75% | 1,986 | 1.88% | 163 | 0.15% | 19,520 | 18.47% | 105,713 |
| Fayette | 27,288 | 54.06% | 22,475 | 44.52% | 649 | 1.29% | 67 | 0.13% | 4,813 | 9.53% | 50,479 |
| Forest | 1,374 | 71.75% | 509 | 26.58% | 21 | 1.10% | 11 | 0.57% | 865 | 45.17% | 1,915 |
| Franklin | 24,093 | 70.01% | 9,456 | 27.48% | 808 | 2.35% | 58 | 0.17% | 14,637 | 42.53% | 34,415 |
| Fulton | 2,515 | 66.24% | 1,192 | 31.39% | 86 | 2.26% | 4 | 0.11% | 1,323 | 34.84% | 3,797 |
| Greene | 7,790 | 57.52% | 5,562 | 41.07% | 151 | 1.11% | 40 | 0.30% | 2,228 | 16.45% | 13,543 |
| Huntingdon | 9,606 | 72.68% | 3,394 | 25.68% | 203 | 1.54% | 13 | 0.10% | 6,212 | 47.00% | 13,216 |
| Indiana | 18,122 | 61.90% | 10,833 | 37.01% | 290 | 0.99% | 29 | 0.10% | 7,289 | 24.90% | 29,274 |
| Jefferson | 11,631 | 68.92% | 5,024 | 29.77% | 204 | 1.21% | 17 | 0.10% | 6,607 | 39.15% | 16,876 |
| Juniata | 4,412 | 66.32% | 2,156 | 32.41% | 61 | 0.92% | 24 | 0.36% | 2,256 | 33.91% | 6,653 |
| Lackawanna | 58,838 | 56.11% | 45,465 | 43.35% | 495 | 0.47% | 71 | 0.07% | 13,373 | 12.75% | 104,869 |
| Lancaster | 81,036 | 75.64% | 24,223 | 22.61% | 1,760 | 1.64% | 119 | 0.11% | 56,813 | 53.03% | 107,138 |
| Lawrence | 23,712 | 56.06% | 17,595 | 41.60% | 832 | 1.97% | 158 | 0.37% | 6,117 | 14.46% | 42,297 |
| Lebanon | 25,008 | 77.38% | 6,683 | 20.68% | 573 | 1.77% | 56 | 0.17% | 18,325 | 56.70% | 32,320 |
| Lehigh | 58,023 | 62.39% | 33,325 | 35.83% | 1,518 | 1.63% | 136 | 0.15% | 24,698 | 26.56% | 93,002 |
| Luzerne | 81,358 | 60.89% | 51,128 | 38.27% | 973 | 0.73% | 147 | 0.11% | 30,230 | 22.63% | 133,606 |
| Lycoming | 28,913 | 68.70% | 11,999 | 28.51% | 1,058 | 2.51% | 117 | 0.28% | 16,914 | 40.19% | 42,087 |
| McKean | 11,958 | 71.72% | 4,513 | 27.07% | 176 | 1.06% | 26 | 0.16% | 7,445 | 44.65% | 16,673 |
| Mercer | 27,961 | 59.37% | 18,087 | 38.40% | 985 | 2.09% | 67 | 0.14% | 9,874 | 20.96% | 47,100 |
| Mifflin | 9,989 | 72.10% | 3,667 | 26.47% | 169 | 1.22% | 30 | 0.22% | 6,322 | 45.63% | 13,855 |
| Monroe | 12,701 | 67.51% | 5,619 | 29.87% | 450 | 2.39% | 44 | 0.23% | 7,082 | 37.64% | 18,814 |
| Montgomery | 173,662 | 64.31% | 91,959 | 34.06% | 3,960 | 1.47% | 437 | 0.16% | 81,703 | 30.26% | 270,018 |
| Montour | 4,386 | 69.64% | 1,755 | 27.87% | 152 | 2.41% | 5 | 0.08% | 2,631 | 41.78% | 6,298 |
| Northampton | 41,822 | 56.30% | 32,335 | 43.53% | 93 | 0.13% | 31 | 0.04% | 9,487 | 12.77% | 74,281 |
| Northumberland | 25,912 | 64.16% | 13,885 | 34.38% | 541 | 1.34% | 47 | 0.12% | 12,027 | 29.78% | 40,385 |
| Perry | 8,082 | 73.31% | 2,731 | 24.77% | 197 | 1.79% | 15 | 0.14% | 5,351 | 48.54% | 11,025 |
| Philadelphia | 344,096 | 43.89% | 431,736 | 55.07% | 5,925 | 0.76% | 2,213 | 0.28% | -87,640 | -11.18% | 783,970 |
| Pike | 4,568 | 74.79% | 1,385 | 22.68% | 143 | 2.34% | 12 | 0.20% | 3,183 | 52.11% | 6,108 |
| Potter | 4,422 | 70.91% | 1,710 | 27.42% | 81 | 1.30% | 23 | 0.37% | 2,712 | 43.49% | 6,236 |
| Schuylkill | 44,071 | 61.56% | 26,077 | 36.42% | 1,261 | 1.76% | 186 | 0.26% | 17,994 | 25.13% | 71,595 |
| Snyder | 7,308 | 78.20% | 1,834 | 19.63% | 190 | 2.03% | 13 | 0.14% | 5,474 | 58.58% | 9,345 |
| Somerset | 19,739 | 68.44% | 8,743 | 30.31% | 303 | 1.05% | 56 | 0.19% | 10,996 | 38.13% | 28,841 |
| Sullivan | 1,886 | 67.17% | 885 | 31.52% | 32 | 1.14% | 5 | 0.18% | 1,001 | 35.65% | 2,808 |
| Susquehanna | 9,476 | 67.79% | 4,154 | 29.72% | 328 | 2.35% | 21 | 0.15% | 5,322 | 38.07% | 13,979 |
| Tioga | 10,028 | 72.05% | 3,733 | 26.82% | 142 | 1.02% | 15 | 0.11% | 6,295 | 45.23% | 13,918 |
| Union | 6,905 | 73.57% | 2,278 | 24.27% | 158 | 1.68% | 44 | 0.47% | 4,627 | 49.30% | 9,385 |
| Venango | 13,991 | 67.28% | 6,302 | 30.31% | 474 | 2.28% | 27 | 0.13% | 7,689 | 36.98% | 20,794 |
| Warren | 10,018 | 66.05% | 4,877 | 32.16% | 252 | 1.66% | 20 | 0.13% | 5,141 | 33.90% | 15,167 |
| Washington | 42,587 | 54.00% | 34,781 | 44.10% | 1,119 | 1.42% | 375 | 0.48% | 7,806 | 9.90% | 78,862 |
| Wayne | 8,948 | 74.51% | 2,733 | 22.76% | 311 | 2.59% | 17 | 0.14% | 6,215 | 51.75% | 12,009 |
| Westmoreland | 75,085 | 54.60% | 59,322 | 43.13% | 2,814 | 2.05% | 306 | 0.22% | 15,763 | 11.46% | 137,527 |
| Wyoming | 6,423 | 74.42% | 2,112 | 24.47% | 86 | 1.00% | 10 | 0.12% | 4,311 | 49.95% | 8,631 |
| York | 63,606 | 68.19% | 27,520 | 29.50% | 1,953 | 2.09% | 201 | 0.22% | 36,086 | 38.69% | 93,280 |
| Totals | 2,714,521 | 59.11% | 1,796,951 | 39.13% | 70,593 | 1.54% | 10,041 | 0.22% | 917,570 | 19.98% | 4,592,106 |
See also[]
- List of United States presidential elections in Pennsylvania
Notes[]
- ^ Jump up to: a b c Although these candidates are included in the “other” total from Dave Leip’s Atlas, they are not separated by county in any available data set.[3]
References[]
- ^ Sullivan, Robert David; ‘How the Red and Blue Map Evolved Over the Past Century’; America Magazine in The National Catholic Review; June 29, 2016
- ^ David Leip. "1972 Presidential General Election Results – Pennsylvania". Dave Leip’s U.S. Election Atlas. Retrieved 2018-03-24.
- ^ Jump up to: a b c "PA US President Race, November 02, 1976". Our Campaigns.
| hide State and district results of the 1972 United States presidential election | ||
|---|---|---|
|  | |
| show |
|---|
- 1972 United States presidential election by state
- United States presidential elections in Pennsylvania
- 1972 Pennsylvania elections