1973 Belfast City Council election
| |||
All 51 seats to Belfast City Council 26 seats needed for a majority | |||
|---|---|---|---|
| Turnout | 62.54% | ||
|
| |||
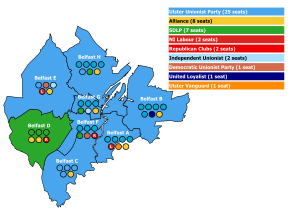 Map showing results by electoral area. | |||
| |||
Elections to Belfast City Council were held on 30 May 1973 on the same day as the other Northern Irish local government elections. The election used eight district electoral areas to elect a total of 51 councillors.
The elections were the first following the reorganisation of local government in Northern Ireland, brought about by the Local Government (Boundaries) Act (Northern Ireland) 1971 & Local Government Act (Northern Ireland) 1972, which replaced the previous FPTP ward system with a new system of proportional representation using multi-member district electoral areas.
The Ulster Unionist Party maintained its position as the largest party, winning just short of a majority, and William Christie continued as Lord Mayor.
Results by party[]
| Party | Seats | ± | First Pref. votes | FPv% | ±% | |
|---|---|---|---|---|---|---|
| UUP | 25 | 83,658 | 50.7% | |||
| Alliance | 8 | 22,081 | 13.4% | |||
| SDLP | 7 | 18,827 | 11.4% | |||
| NI Labour | 2 | 9,046 | 5.5% | |||
| Republican Clubs | 2 | 6,584 | 4.0% | |||
| United Loyalist | 2 | 6,274 | 3.8% | |||
| Ind U | 2 | 4,997 | 3.0% | |||
| DUP | 2 | 3,860 | 2.3% | |||
| Loyalist Coalition | 1 | 4,823 | 2.9% | |||
| Republican Labour | 0 | 2,594 | 1.6% | |||
| Independent Unionist Loyalist | 0 | 967 | 0.6% | |||
| Independent Ratepayer | 0 | 610 | 0.4% | |||
| Communist Party | 0 | 211 | 0.1% | |||
| Ulster Liberal | 0 | 172 | 0.1% | |||
| Non-Party | 0 | 88 | 0.1% | |||
| Independent | 0 | 180 | 0.1% | |||
| Totals | 51 | 168,667 | 100% | — | ||
Districts summary[]
| Ward | % |
Cllrs |
% |
Cllrs |
% |
Cllrs |
% |
Cllrs |
% |
Cllrs |
% |
Cllrs |
% |
Cllrs |
Total Cllrs |
|---|---|---|---|---|---|---|---|---|---|---|---|---|---|---|---|
| UUP | Alliance | SDLP | NILP | RC | DUP | Others | |||||||||
| Area A | 55.4 | 4 | 10.6 | 1 | 5.2 | 0 | 6.1 | 1 | 0.0 | 0 | 8.2 | 0 | 14.5 | 1 | 7 |
| Area B | 62.3 | 5 | 19.6 | 1 | 0.0 | 0 | 5.4 | 0 | 0.0 | 0 | 0.0 | 0 | 12.7 | 0 | 7 |
| Area C | 54.7 | 4 | 22.8 | 2 | 4.5 | 0 | 4.7 | 0 | 2.4 | 0 | 0.0 | 0 | 10.9 | 0 | 6 |
| Area D | 7.0 | 0 | 19.3 | 1 | 44.5 | 4 | 4.0 | 0 | 18.2 | 1 | 0.0 | 0 | 7.0 | 0 | 6 |
| Area E | 39.9 | 1 | 7.4 | 1 | 7.3 | 0 | 10.2 | 1 | 0.0 | 0 | 13.5 | 1 | 21.7 | 2 | 6 |
| Area F | 49.2 | 3 | 3.8 | 0 | 18.7 | 1 | 2.5 | 0 | 16.1 | 1 | 7.5 | 1 | 2.2 | 0 | 6 |
| Area G | 56.6 | 3 | 3.3 | 1 | 16.5 | 1 | 3.9 | 0 | 4.8 | 0 | 0.0 | 0 | 14.9 | 0 | 6 |
| Area H | 62.0 | 5 | 15.9 | 1 | 14.8 | 1 | 4.7 | 0 | 0.0 | 0 | 0.0 | 0 | 2.6 | 0 | 7 |
| Total | 50.7 | 25 | 13.4 | 8 | 11.4 | 7 | 5.5 | 2 | 4.0 | 2 | 2.3 | 2 | 12.7 | 5 | 51 |
Districts results[]
Area A[]
1973: 4 x UUP, 1 x Alliance, 1 x Vanguard, 1 x NILP
| Party | Candidate | FPv% | Count | ||||||||||||||||
|---|---|---|---|---|---|---|---|---|---|---|---|---|---|---|---|---|---|---|---|
| 1 | 2 | 3 | 4 | 5 | 6 | 7 | 8 | 9 | 10 | 11 | 12 | 13 | 14 | 15 | 16 | ||||
| UUP | Grace Bannister | 25.50% | 6,328 | ||||||||||||||||
| UUP | William Blair | 6.04% | 1,498 | 3,050 | 3,050 | 3,053.5 | 3,065.5 | 3,066.5 | 3,098.5 | 3,103.5 | |||||||||
| UUP | Benjamin Horan | 11.15% | 2,768 | 2,958.5 | 2,959.5 | 2,959.5 | 2,982 | 2,984 | 3,069.5 | 3,075.5 | 3,099 | 3,176 | |||||||
| UUP | Thomas Gildea | 6.44% | 1,598 | 2,079 | 2,079 | 2,084.5 | 2,096.5 | 2,096.5 | 2,111 | 2,122 | 2,146.5 | 2,170.5 | 2,786 | 2,792 | 3,714 | ||||
| Alliance | Patricia Carson | 5.30% | 1,315 | 1,373 | 1,376 | 1,440 | 1,440 | 1,457 | 1,459 | 1,675.5 | 2,398.5 | 2,410 | 2,444.5 | 2,444.5 | 2,535.5 | 2,688.5 | 3,226.5 | ||
| Vanguard | William Elliott | 5.33% | 1,322 | 1,358.5 | 1,358.5 | 1,358.5 | 1,418.5 | 1,419.5 | 1,498 | 1,500 | 1,506 | 1,622 | 1,698 | 1,705 | 1,773.5 | 1,847.5 | 1,850.5 | 3,049 | |
| NI Labour | Erskine Holmes | 5.39% | 1,337 | 1,378.5 | 1,421.5 | 1,431.5 | 1,437 | 1,662.5 | 1,669.5 | 1,730 | 1,841 | 1,856 | 1,881.5 | 1,884.5 | 1,953 | 2,048 | 2,860.5 | 2,901.5 | |
| DUP | Thomas Wright | 4.67% | 1,158 | 1,176.5 | 1,177.5 | 1,177.5 | 1,209.5 | 1,212.5 | 1,269.5 | 1,271.5 | 1,273.5 | 1,860.5 | 1,889 | 1,927 | 2,025 | 2,184 | 2,187 | 2,391.5 | |
| United Loyalist | W. Dougherty | 4.83% | 1,198 | 1,265 | 1,265 | 1,265 | 1,317 | 1,317 | 1,405 | 1,406 | 1,414 | 1,527.5 | 1,568 | 1,571 | 1,619 | 1,666 | 1,670 | ||
| SDLP | Ben Caraher | 5.25% | 1,302 | 1,309.5 | 1,329.5 | 1,332.5 | 1,332.5 | 1,445 | 1,446 | 1,483 | 1,502.5 | 1,504 | 1,509.5 | 1,510.5 | 1,512.5 | 1,512.5 | |||
| UUP | John McKeown | 4.11% | 1,021 | 1,218.5 | 1,218.5 | 1,221.5 | 1,226.5 | 1,226.5 | 1,238 | 1,240 | 1,252 | 1,274 | 1,463.5 | 1,476.5 | |||||
| UUP | Emma Dunbar | 2.20% | 546 | 964.5 | 965.5 | 967.5 | 971.5 | 971.5 | 996.5 | 1,001.5 | 1,020.5 | 1,056 | |||||||
| DUP | W. G. Greene | 3.52% | 874 | 905 | 907 | 907 | 937.5 | 940.5 | 1,004.5 | 1,005.5 | 1,013.5 | ||||||||
| Alliance | Sam Edgerton | 2.83% | 702 | 716 | 720 | 756 | 761 | 780 | 784 | 979.5 | |||||||||
| Alliance | Bernadette Hopkirk | 1.73% | 430 | 435.5 | 436.5 | 494.5 | 497 | 550 | 552 | ||||||||||
| Ind U | J. Keenan | 1.74% | 432 | 443 | 443 | 446 | 479 | 480 | |||||||||||
| NI Labour | J. Murray | 1.70% | 421 | 422.5 | 440.5 | 446.5 | 450.5 | ||||||||||||
| Ulster Constitution Party | Lindsay Mason | 1.09% | 271 | 280 | 280 | 281 | |||||||||||||
| Alliance | Jacqueline Maguire | 0.77% | 192 | 194 | 196 | ||||||||||||||
| Communist Party | H. Moore | 0.41% | 101 | 101 | |||||||||||||||
| Electorate: 38,311 Valid: 24,814 (64.77%) Spoilt: 360 Quota: 3,102 Turnout: 25,174 (65.71%) | |||||||||||||||||||
Area B[]
1973: 5 x UUP, 1 x Alliance, 1 x United Loyalist
| Party | Candidate | FPv% | Count | ||||||||||||
|---|---|---|---|---|---|---|---|---|---|---|---|---|---|---|---|
| 1 | 2 | 3 | 4 | 5 | 6 | 7 | 8 | 9 | 10 | 11 | 12 | ||||
| UUP | Joshua Cardwell | 25.41% | 6,708 | ||||||||||||
| UUP | John Allen | 14.81% | 3,910 | ||||||||||||
| United Loyalist | H. K. Dickey | 12.77% | 3,371 | ||||||||||||
| Alliance | Michael Brown | 9.65% | 2,549 | 2,646.41 | 2,685.56 | 2,707.71 | 2,708.93 | 2,860.37 | 2,899.56 | 3,386.56 | |||||
| UUP | William Corry | 5.64% | 1,488 | 2,786.46 | 3,156.21 | 3,158.38 | 3,174.74 | 3,193.73 | 3,212.88 | 3,266.45 | 3,331.45 | ||||
| UUP | Thomas Patton | 6.94% | 1,833 | 2,274.66 | 2,305.86 | 2,310.37 | 2,332.83 | 2,342.57 | 2,354.71 | 2,372.88 | 2,490.79 | 2,491.87 | 2,498.14 | 3,223.5 | |
| UUP | H. Cranston | 4.11% | 1,085 | 1,953.53 | 2,024.63 | 2,029.29 | 2,036.75 | 2,041.6 | 2,056.47 | 2,095.94 | 2,170.59 | 2,175.99 | 2,194.23 | 3,261.63 | |
| Alliance | David Wonnacott | 4.56% | 1,205 | 1,241.21 | 1,243.31 | 1,260.37 | 1,260.71 | 1,536 | 1,546.59 | 1,902.65 | 2,630.45 | 2,705.33 | 2,707.04 | 2,896.56 | |
| UUP | Dorothy Dunlop | 5.41% | 1,428 | 1,942.59 | 1,988.64 | 1,992.3 | 2,002.48 | 2,009.67 | 2,028.6 | 2,074.11 | 2,144.78 | 2,148.56 | 2,152.55 | ||
| NI Labour | William Gunning | 2.18% | 575 | 607.64 | 609.74 | 795.29 | 797.43 | 804.64 | 1,290.46 | 1,328.86 | |||||
| Alliance | Samuel Coulson | 3.33% | 878 | 920.84 | 930.44 | 936.63 | 936.99 | 1,024.69 | 1,048.94 | ||||||
| NI Labour | H. Conway | 1.92% | 507 | 533.52 | 539.07 | 626.58 | 627.76 | 631.8 | |||||||
| Alliance | P. Miller | 2.02% | 534 | 555.93 | 558.93 | 566.59 | 567.13 | ||||||||
| NI Labour | W. Kirkpatrick | 1.26% | 332 | 343.73 | 344.63 | ||||||||||
| Electorate: 39,227 Valid: 26,403 (67.31%) Spoilt: 385 Quota: 3,301 Turnout: 26,788 (68.29%) | |||||||||||||||
Area C[]
1973: 4 x UUP, 2 x Alliance
| Party | Candidate | FPv% | Count | |||||||||
|---|---|---|---|---|---|---|---|---|---|---|---|---|
| 1 | 2 | 3 | 4 | 5 | 6 | 7 | 8 | 9 | ||||
| Alliance | David Cook | 10.60% | 2,241 | 2,254 | 2,327 | 2,360 | 2,584 | 3,027 | ||||
| UUP | John Webster | 13.11% | 2,770 | 2,771 | 2,771 | 2,946 | 2,952 | 2,985 | 3,023 | |||
| Alliance | Muriel Pritchard | 5.55% | 1,172 | 1,174 | 1,176 | 1,198 | 1,427 | 1,757 | 2,279 | 3,158 | ||
| UUP | F. J. McGibben | 10.63% | 2,247 | 2,247 | 2,247 | 2,278 | 2,296 | 2,314 | 2,355 | 2,364 | 3,114 | |
| UUP | John William Kennedy | 12.35% | 2,611 | 2,616 | 2,618 | 2,648 | 2,660 | 2,678 | 2,743 | 2,753 | 3,113 | |
| UUP | W. D. Gilmore | 11.93% | 2,522 | 2,525 | 2,528 | 2,616 | 2,626 | 2,645 | 2,726 | 2,741 | 3,003 | |
| United Loyalist | N. McNarry | 8.01% | 1,693 | 1,694 | 1,697 | 1,794 | 1,797 | 1,806 | 1,857 | 1,871 | 1,926 | |
| UUP | N. Preston | 6.64% | 1,404 | 1,404 | 1,404 | 1,420 | 1,424 | 1,432 | 1,453 | 1,464 | ||
| SDLP | Mary Scott | 4.49% | 948 | 949 | 1,149 | 1,160 | 1,177 | 1,197 | 1,413 | |||
| NI Labour | Brian Garrett | 3.87% | 817 | 957 | 1,029 | 1,077 | 1,103 | 1,146 | ||||
| Alliance | William Jeffrey | 3.46% | 731 | 737 | 745 | 800 | 948 | |||||
| Alliance | W. McDonough | 3.22% | 681 | 683 | 685 | 699 | ||||||
| Independent | D. Donaghy | 2.87% | 610 | 614 | 639 | |||||||
| Republican Clubs | P. Callaghan | 2.38% | 503 | 508 | ||||||||
| NI Labour | W. Copley | 0.88% | 186 | |||||||||
| Electorate: 32,071 Valid: 21,136 (65.90%) Spoilt: 210 Quota: 3,020 Turnout: 21,346 (66.56%) | ||||||||||||
Area D[]
1973: 4 x SDLP, 1 x Alliance, 1 x Republican Clubs
| Party | Candidate | FPv% | Count | ||||||||||||||||||||
|---|---|---|---|---|---|---|---|---|---|---|---|---|---|---|---|---|---|---|---|---|---|---|---|
| 1 | 2 | 3 | 4 | 5 | 6 | 7 | 8 | 9 | 10 | 11 | 12 | 13 | 14 | 15 | 16 | 17 | 18 | 19 | 20 | ||||
| SDLP | J. Gillespie | 15.46% | 2,306 | ||||||||||||||||||||
| Republican Clubs | Raymond O'Hagan | 4.35% | 649 | 649.84 | 652.84 | 652.84 | 652.84 | 657.84 | 663.91 | 791.91 | 796.91 | 799.91 | 985.05 | 996.26 | 1,005.47 | 1,035.47 | 1,040.75 | 1,509.82 | 1,573.78 | 1,574.78 | 2,559.38 | ||
| SDLP | Desmond O'Donnell | 8.93% | 1,332 | 1,360.84 | 1,364.91 | 1,366.98 | 1,371.19 | 1,383.19 | 1,394.19 | 1,402.19 | 1,406.19 | 1,414.33 | 1,416.33 | 1,471.82 | 1,690.48 | 1,728.97 | 1,760.95 | 1,776.02 | 2,114.9 | 2,115.9 | 2,138.32 | ||
| Alliance | P. D. Corrie | 7.77% | 1,159 | 1,162.92 | 1,163.92 | 1,164.92 | 1,167.99 | 1,174.99 | 1,175.99 | 1,177.99 | 1,184.06 | 1,266.06 | 1,268.06 | 1,351.13 | 1,366.41 | 1,386.48 | 1,656.7 | 1,668.9 | 1,698.18 | 1,810.18 | 1,853.18 | 1,819.18 | |
| SDLP | J. P. McCarron | 5.84% | 871 | 954.09 | 959.16 | 963.65 | 965.72 | 971.93 | 979.07 | 983.07 | 1,004.21 | 1,015.95 | 1,017.42 | 1,099.96 | 1,176.73 | 1,244.36 | 1,272.78 | 1,286.13 | 1,493.21 | 1,498.21 | 1,566.26 | 1,701.26 | |
| SDLP | P. G. Wilson | 7.24% | 1,080 | 1,087.14 | 1,088.14 | 1,091.14 | 1,097.14 | 1,104.35 | 1,108.4 | 1,112.42 | 1,136.49 | 1,145.7 | 1,152.7 | 1,183.7 | 1,294.75 | 1,332.96 | 1,356.1 | 1,383.17 | 1,532.53 | 1,553.53 | 1,572.53 | 1,687.53 | |
| Alliance | Reginald Donnelly | 5.52% | 822 | 825.29 | 827.29 | 828.29 | 832.29 | 838.29 | 839.29 | 847.29 | 849.36 | 923.43 | 924.43 | 986.57 | 1,005.64 | 1,023.92 | 1,364.48 | 1,375.55 | 1,396.76 | 1,441.76 | 1,468.83 | 1,483.83 | |
| Republican Clubs | John Brady | 5.08% | 758 | 758.91 | 765.91 | 773.05 | 774.05 | 775.05 | 787.19 | 866.19 | 888.86 | 889.26 | 945.26 | 955.47 | 963.47 | 1,136.89 | 1,143.89 | 1,383.03 | 1,412.1 | 1,412.1 | |||
| UUP | A. W. Shaw | 7.01% | 1,045 | 1,045.07 | 1,045.07 | 1,046.07 | 1,046.07 | 1,049.07 | 1,050.07 | 1,050.07 | 1,050.07 | 1,052.07 | 1,052.07 | 1,057.07 | 1,058.07 | 1,059.07 | 1,065.14 | 1,066.14 | 1,066.14 | ||||
| SDLP | A. McKenna | 3.55% | 530 | 541.97 | 548.97 | 562.11 | 565.11 | 568.11 | 672.18 | 676.18 | 680.18 | 701.39 | 709.39 | 730.88 | 808.37 | 851.72 | 878.14 | 909.21 | |||||
| Republican Clubs | Ethel McAllister | 4.59% | 684 | 684.56 | 686.56 | 691.7 | 691.7 | 691.7 | 692.7 | 709.7 | 727.84 | 729.84 | 818.84 | 826.05 | 832.05 | 861.12 | 866.12 | ||||||
| Alliance | A. J. McGrogan | 3.82% | 569 | 572.01 | 573.08 | 573.08 | 579.15 | 585.22 | 585.22 | 586.22 | 588.22 | 691.29 | 698.29 | 754.36 | 764.36 | 772.71 | |||||||
| Republican Labour | D. Barnes | 2.41% | 360 | 362.66 | 376.66 | 388.73 | 389.73 | 392.73 | 451.73 | 454.73 | 592.8 | 596.94 | 607.01 | 634.08 | 652.15 | ||||||||
| SDLP | O'Connor | 3.51% | 524 | 529.32 | 532.32 | 533.32 | 534.32 | 537.32 | 543.6 | 544.6 | 550.6 | 557.67 | 565.74 | 583.81 | |||||||||
| NI Labour | T. Hannon | 2.19% | 326 | 329.64 | 330.64 | 334.64 | 362.64 | 501.64 | 508.64 | 508.64 | 526.71 | 538.71 | 539.71 | ||||||||||
| Republican Clubs | Bernard McDonagh | 2.28% | 340 | 340.21 | 343.21 | 346.42 | 346.42 | 346.42 | 346.49 | 369.49 | 378.56 | 381.56 | |||||||||||
| Alliance | Monica Slavin | 2.23% | 332 | 332.98 | 334.05 | 336.05 | 341.12 | 345.12 | 350.12 | 351.12 | 353.12 | ||||||||||||
| Republican Labour | J. Flanigan | 1.62% | 241 | 241.84 | 248.84 | 275.84 | 275.84 | 277.84 | 299.84 | 303.84 | |||||||||||||
| Republican Clubs | J. J. McElroy | 1.85% | 276 | 276.07 | 281.07 | 283.07 | 283.07 | 285.07 | 291.07 | ||||||||||||||
| Republican Labour | J. J. McNamee | 1.72% | 256 | 256.7 | 264.84 | 269.84 | 271.91 | 272.91 | |||||||||||||||
| NI Labour | R. Watson | 1.13% | 169 | 169.56 | 170.56 | 171.56 | 220.63 | ||||||||||||||||
| NI Labour | P. Moyna | 0.73% | 109 | 109.63 | 112.63 | 112.7 | |||||||||||||||||
| Republican Labour | J. Lavelle | 0.60% | 90 | 91.26 | 97.33 | ||||||||||||||||||
| Republican Labour | F. McDermott | 0.58% | 86 | 86.49 | |||||||||||||||||||
| Electorate: 34,437 Valid: 14,914 (43.31%) Spoilt: 1,001 Quota: 2,131 Turnout: 15,915 (46.21%) | |||||||||||||||||||||||
Area E[]
1973: 1 x UUP, 1 x DUP, 1 x NILP, 1 x Alliance, 1 x United Loyalist, 1 x Independent Unionist
| Party | Candidate | FPv% | Count | ||||||||
|---|---|---|---|---|---|---|---|---|---|---|---|
| 1 | 2 | 3 | 4 | 5 | 6 | 7 | 8 | ||||
| UUP | William Christie | 39.88% | 7,875 | ||||||||
| DUP | Fred Proctor | 10.92% | 2,156 | 3,413.95 | |||||||
| Ind U | Hugh Smyth | 10.86% | 2,145 | 3,131.7 | |||||||
| NI Labour | Billy Boyd | 8.90% | 1,758 | 2,439.85 | 2,485.73 | 2,518.7 | 2,554.11 | 2,808.9 | 2,879.9 | ||
| United Loyalist | David Smylie | 6.13% | 1,210 | 1,761.2 | 2,295.1 | 2,463.53 | 2,556.84 | 2,578.66 | 2,581.61 | 3,030.61 | |
| Alliance | James Robinson | 7.35% | 1,452 | 2,003.85 | 2,051.95 | 2,071.27 | 2,104.13 | 2,183.45 | 2,216.75 | 2,487.35 | |
| SDLP | J. P. Goan | 5.12% | 1,012 | 1,016.55 | 1,018.03 | 1,018.03 | 1,018.03 | 1,388.98 | 1,974.63 | 1,985.47 | |
| DUP | K. B. Hoy | 2.60% | 514 | 1,110.05 | 1,247.32 | 1,309.48 | 1,352.84 | 1,376.8 | 1,380.8 | ||
| Republican Labour | T. Fleming | 4.26% | 842 | 845.25 | 845.25 | 845.25 | 845.9 | 870.9 | |||
| SDLP | P. J. Tanney | 2.19% | 432 | 433.3 | 433.67 | 434.3 | 434.51 | ||||
| NI Labour | George Chambers | 1.34% | 264 | 338.1 | 346.24 | 349.6 | 358.59 | ||||
| Independent | J. Moore | 0.45% | 88 | 208.25 | 223.79 | 236.81 | |||||
| Electorate: 31,548 Valid: 19,748 (62.60%) Spoilt: 267 Quota: 2,822 Turnout: 20,015 (63.44%) | |||||||||||
Area F[]
1973: 3 x UUP, 1 x SDLP, 1 x DUP, 1 x Republican Clubs
| Party | Candidate | FPv% | Count | ||||||||||||||||
|---|---|---|---|---|---|---|---|---|---|---|---|---|---|---|---|---|---|---|---|
| 1 | 2 | 3 | 4 | 5 | 6 | 7 | 8 | 9 | 10 | 11 | 12 | 13 | 14 | 15 | 16 | ||||
| UUP | Harry Fletcher | 21.82% | 3,441 | ||||||||||||||||
| UUP | James Stewart | 21.06% | 3,320 | ||||||||||||||||
| UUP | Thomas Murphy | 6.34% | 1,000 | 2,049.24 | 2,971.48 | ||||||||||||||
| SDLP | Paddy Devlin | 14.22% | 2,242 | 2,242 | 2,242.64 | 2,242.96 | 2,259.96 | ||||||||||||
| Republican Clubs | Jim Sullivan | 4.66% | 735 | 735.34 | 735.66 | 735.98 | 740.98 | 752.98 | 753.98 | 753.98 | 756.98 | 758.98 | 772.98 | 1,072.98 | 1,072.98 | 1,461.98 | 1,691.64 | 2,419.62 | |
| DUP | William Spence | 7.55% | 1,190 | 1,286.9 | 1,389.3 | 1,768.5 | 1,771.46 | 1,776.1 | 1,779.1 | 1,796.54 | 1,796.54 | 1,797.86 | 1,808.06 | 1,859.24 | 1,860.56 | 1,861.56 | 1,935.46 | 1,939.46 | |
| SDLP | Owen Allen | 3.01% | 475 | 475.34 | 475.98 | 476.3 | 482.62 | 493.62 | 524.62 | 533.42 | 536.36 | 704.56 | 720.05 | 804.39 | 877.39 | 896.71 | 1,228.12 | 1,282.44 | |
| Republican Clubs | Sean O'Hare | 4.44% | 700 | 700.68 | 701.64 | 701.64 | 705.64 | 720.64 | 744.64 | 747.64 | 748.13 | 751.62 | 751.62 | 769.94 | 850.92 | 1,089.92 | 1,111.24 | ||
| Alliance | Mary Smyth | 2.35% | 370 | 376.12 | 382.2 | 413.88 | 416.22 | 431.9 | 423.24 | 448.44 | 448.44 | 475.44 | 693.79 | 859.69 | 872.69 | 876.69 | |||
| Republican Clubs | A. Dornan | 3.55% | 560 | 560 | 560.32 | 560.32 | 562.32 | 546.32 | 595.32 | 595.32 | 595.32 | 595.64 | 597.64 | 606.64 | 681.64 | ||||
| Republican Clubs | Sean Flynn | 3.41% | 538 | 538.34 | 538.66 | 538.98 | 539.98 | 543.98 | 556.98 | 558.98 | 559.96 | 573.96 | 576.96 | 581.96 | |||||
| NI Labour | T. Magee | 1.47% | 232 | 538.34 | 538.66 | 538.98 | 539.98 | 543.98 | 556.98 | 558.98 | 559.96 | 573.96 | 576.96 | ||||||
| Alliance | P. Woods | 1.46% | 230 | 231.02 | 234.22 | 249.58 | 260.58 | 258.9 | 258.9 | 270.82 | 272.29 | 285.29 | |||||||
| SDLP | Desmond Gillespie | 1.46% | 230 | 231.02 | 231.02 | 231.98 | 234.98 | 237.98 | 257.98 | 265.3 | 265.79 | ||||||||
| NI Labour | W. Ritchie | 1.05% | 165 | 170.44 | 180.36 | 213.32 | 213.66 | 229.98 | 232.98 | ||||||||||
| Republican Labour | W. J. Clarke | 0.82% | 129 | 129.34 | 129.34 | 129.66 | 179.66 | 186.66 | |||||||||||
| Communist Party | Betty Sinclair | 0.70% | 110 | 110.68 | 111.96 | 113.88 | 115.22 | ||||||||||||
| Republican Labour | Margaret McKenna | 0.46% | 72 | 72 | 72.64 | 73.28 | |||||||||||||
| Republican Labour | J. Marron | 0.18% | 29 | 31.72 | 33.64 | 33.96 | |||||||||||||
| Electorate: 27,067 Valid: 15,768 (58.26%) Spoilt: 622 Quota: 2,253 Turnout: 16,390 (60.55%) | |||||||||||||||||||
Area G[]
1973: 3 x UUP, 1 x SDLP, 1 x Alliance, 1 x Independent Unionist
| Party | Candidate | FPv% | Count | |||||||||||||||
|---|---|---|---|---|---|---|---|---|---|---|---|---|---|---|---|---|---|---|
| 1 | 2 | 3 | 4 | 5 | 6 | 7 | 8 | 9 | 10 | 11 | 12 | 13 | 14 | 15 | ||||
| UUP | Margaret Laird | 20.90% | 3,632 | |||||||||||||||
| UUP | Herbert Ditty | 20.46% | 3,556 | |||||||||||||||
| SDLP | Gerry Fitt | 16.55% | 2,876 | |||||||||||||||
| UUP | Hugh Kidd | 15.25% | 2,651 | |||||||||||||||
| Ind U | Samuel Millar | 13.18% | 2,291 | 3,210.98 | ||||||||||||||
| Alliance | Mary McKeown | 3.29% | 572 | 680.68 | 1,104.32 | 1,194 | 1,259.66 | 1,314.91 | 1,315.05 | 1,320.88 | 1,331.8 | 1,334.48 | 1,366.76 | 1,386.81 | 1,408.92 | 1,618.44 | 1,757.85 | |
| NI Labour | T. Pakenham | 1.05% | 182 | 240.14 | 552.26 | 670.06 | 677.06 | 723.3 | 724.44 | 727.42 | 757.33 | 738.57 | 860.69 | 867.43 | 882.73 | 1,242.63 | 1,366.79 | |
| Republican Clubs | John McAlea | 2.16% | 376 | 376.76 | 384.24 | 385 | 433.86 | 434.37 | 435.93 | 440.35 | 446.91 | 515.49 | 517.33 | 585.17 | 971.62 | 1,029.61 | ||
| Republican Clubs | J. Boyle | 2.12% | 368 | 398.02 | 533.34 | 568.3 | 627.66 | 653.16 | 653.86 | 661.66 | 671.64 | 673.79 | 779.83 | 803.97 | 847.81 | |||
| Republican Clubs | F. P. McGlade | 1.67% | 291 | 292.9 | 296.3 | 296.3 | 340.54 | 341.56 | 343.26 | 346.68 | 348.82 | 451.24 | 457.64 | 547.92 | ||||
| Republican Labour | Jim O'Kane | 1.11% | 193 | 193.38 | 194.06 | 194.44 | 277.6 | 277.94 | 295.68 | 305.6 | 315 | 333.75 | 339.57 | |||||
| NI Labour | Jack Sharkey | 0.76% | 132 | 143.78 | 228.78 | 260.7 | 282.96 | 301.83 | 304.33 | 312.6 | 328.29 | 330.69 | ||||||
| Republican Clubs | D. O'Hare | 1.00% | 174 | 174.38 | 177.78 | 177.78 | 198.22 | 198.9 | 200.16 | 205 | 206.7 | |||||||
| Independent | J. P. Rigby | 0.01% | 13 | 16.42 | 81.7 | 108.3 | 112.08 | 122.62 | 122.76 | 154.57 | ||||||||
| Independent | Moya Saunders | 0.03% | 52 | 56.56 | 77.64 | 90.56 | 100.42 | 105.17 | 106.31 | |||||||||
| Republican Labour | H. Scullion | 0.01% | 19 | 19.38 | 20.06 | 20.44 | 31.64 | 31.64 | ||||||||||
| Electorate: 29,530 Valid: 17,378 (58.85%) Spoilt: 517 Quota: 2,483 Turnout: 17,895 (60.60%) | ||||||||||||||||||
Area H[]
1973: 5 x UUP, 1 x Alliance, 1 x SDLP
| Party | Candidate | FPv% | Count | ||||||||||||||||
|---|---|---|---|---|---|---|---|---|---|---|---|---|---|---|---|---|---|---|---|
| 1 | 2 | 3 | 4 | 5 | 6 | 7 | 8 | 9 | 10 | 11 | 12 | 13 | 14 | 15 | 16 | ||||
| UUP | John Carson | 22.24% | 5,518 | ||||||||||||||||
| UUP | Frank Millar | 16.09% | 3,993 | ||||||||||||||||
| SDLP | Thomas Donnelly | 10.75% | 2,667 | 2,668.32 | 2,669.01 | 2,671.01 | 2,701.24 | 2,701.24 | 2,934.24 | 2,956.91 | 2,989.91 | 3,013.91 | 3,162.91 | ||||||
| Alliance | John Ferguson | 9.15% | 2,271 | 2,325.12 | 2,336.12 | 2,347.92 | 2,370.15 | 2,384.26 | 2,389.26 | 2,424.69 | 2,474.68 | 2,805.17 | 3,160.17 | ||||||
| UUP | Myles Humphreys | 7.80% | 1,935 | 2,443.64 | 2,583.48 | 2,609.11 | 2,613.78 | 2,637.6 | 2,637.83 | 2,656.64 | 2,668.86 | 2,686.42 | 2,706.16 | 2,706.74 | 2,998.55 | 3,215.55 | |||
| UUP | Mary Creighton | 2.94% | 730 | 1,792.16 | 1,974.32 | 1,987.98 | 1,995.32 | 2,026.6 | 2,026.6 | 2,051.29 | 2,064.96 | 2,078.18 | 2,157.54 | 2,158.12 | 2,489.68 | 2,892.62 | 3,127.62 | ||
| UUP | W. Shannon | 5.09% | 1,263 | 1,471.56 | 1,585.41 | 1,592.28 | 1,598.11 | 1,616.52 | 1,616.52 | 1,622.98 | 1,631.53 | 1,640.64 | 1,648.08 | 1,648.08 | 1,908.68 | 2,187.26 | 2,291.6 | 2,359.61 | |
| UUP | H. E. Smith | 5.02% | 1,245 | 1,379.64 | 1,444.04 | 1,455.27 | 1,464.82 | 1,478.61 | 1,478.61 | 1,485.95 | 1,500.73 | 1,526.05 | 1,540.72 | 1,542.16 | 1,715.71 | 1,965.18 | 2,162.03 | 2,207.17 | |
| Alliance | Maureen McManus | 3.93% | 974 | 980.16 | 981.31 | 983.31 | 1,003.31 | 1,010.75 | 1,013.75 | 1,027.19 | 1,075.19 | 1,406.39 | 1,566.17 | 1,621.85 | 1,638.53 | 1,657.53 | |||
| Ulster Constitution Party | David Riddelsdell | 3.90% | 967 | 1,045.76 | 1,199.4 | 1,204.72 | 1,209.95 | 1,252.8 | 1,254.8 | 1,258.47 | 1,262.14 | 1,263.81 | 1,280.59 | 1,281.17 | 1,359.64 | ||||
| UUP | W. Lavery | 2.78% | 689 | 967.96 | 1,132.64 | 1,141.22 | 1,146.22 | 1,157.4 | 1,157.63 | 1,168.22 | 1,185.46 | 1,195.79 | 1,218 | 1,219.16 | |||||
| NI Labour | S. Barbour | 1.74% | 432 | 442.56 | 446.01 | 448.01 | 456.01 | 456.01 | 474.01 | 602.58 | 905.73 | 923.17 | |||||||
| Alliance | Hannah Lantin | 2.82% | 700 | 710.56 | 713.55 | 729.99 | 741.99 | 745.99 | 746.99 | 762.66 | 791.77 | ||||||||
| NI Labour | Mary Simpson | 1.64% | 407 | 416.68 | 420.82 | 420.82 | 441.28 | 441.95 | 452.95 | 544.5 | |||||||||
| NI Labour | B. Boyd | 1.32% | 327 | 341.96 | 350.93 | 351.93 | 367.81 | 372.81 | 379.81 | ||||||||||
| Republican Labour | B. Loughran | 1.12% | 277 | 277 | 277.46 | 280.46 | 288.46 | 288.46 | |||||||||||
| Ind U | J. N. McCauley | 0.52% | 129 | 148.36 | 160.32 | 181.47 | 184.47 | ||||||||||||
| Ulster Liberal | R. A. Smith | 0.69% | 172 | 175.96 | 178.72 | 180.72 | |||||||||||||
| Independent | S. Daly | 0.47% | 115 | 126.88 | 134.7 | ||||||||||||||
| Electorate: 37,491 Valid: 24,811 (66.18%) Spoilt: 333 Quota: 3,102 Turnout: 25,144 (67.07%) | |||||||||||||||||||
References[]
| Antrim and Newtownabbey Borough Council | |
|---|---|
| Belfast City Council | |
| Causeway Coast and Glens Borough Council | |
| Lisburn and Castlereagh District Council |
|
| Mid and East Antrim District Council | |
| Antrim Borough Council |
|
| Ballymena Borough Council | |
| Ballymoney Borough Council | |
| Carrickfergus Borough Council | |
| Larne Borough Council | |
| Lisburn City Council |
|
| Moyle District Council | |
| Newtownabbey Borough Council |
|
| Antrim County Council |
|
| Armagh City, Banbridge and Craigavon Borough Council | |
|---|---|
| Lisburn and Castlereagh City Council | |
| Newry, Mourne and Down District Council | |
| Ards and North Down Borough Council | |
| Ards Borough Council |
|
| Banbridge District Council | |
| Castlereagh Borough Council |
|
| Craigavon Borough Council |
|
| Down District Council | |
| Lisburn City Council |
|
| Newry and Mourne District Council | |
| North Down Borough Council |
|
| County councils (England) | |
|---|---|
| County councils (Wales) |
|
| County councils (Scotland) | |
| Unicameral area | |
| Metropolitan boroughs | |
| City corporations | |
| District councils (England) | |
| District councils (Wales) | |
| District councils (Northern Ireland) |
|
| Town councils | |
| Sui generis | |
- Belfast City Council elections
- 1973 Northern Ireland local elections
- 20th century in Belfast