1988 United States presidential election in California
| ||||||||||||||||||||||||||
| Turnout | 72.81% (of registered voters) 53.51% (of eligible voters) | |||||||||||||||||||||||||
|---|---|---|---|---|---|---|---|---|---|---|---|---|---|---|---|---|---|---|---|---|---|---|---|---|---|---|
| ||||||||||||||||||||||||||
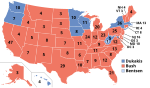
 County Results
| ||||||||||||||||||||||||||
| ||||||||||||||||||||||||||


| Elections in California |
|---|
 |
|
|
|
|
|
|
|
|
|
|
|
|
|
|
|
|
|
|
|
|
|
|
|
|
|
|
|
|
|
|
|
|


The 1988 United States presidential election in California took place on November 8, 1988, and was part of the 1988 United States presidential election. Voters chose 47 representatives, or electors to the Electoral College, who voted for president and vice president.
California voted for the Republican nominee, Vice President George H. W. Bush, over the Democratic nominee, Massachusetts governor Michael Dukakis by a margin of 3.57 percent. Bush won forty-four of the state's fifty-eight counties, but the election was kept close by Dukakis’ strong performance in the Bay Area and his victory in Los Angeles, the state's most populated county. Also, Dukakis won at least 31% of the vote in every county and at least 40 percent in forty of them. Much like Vermont in the same year, California was seen by observers as a swing state in this year's presidential election cycle due to fairly close polling.
California weighed in for this election as 4.2% more Democratic than the nation-at-large. To date, this is the last presidential election in which the state of California was carried by a Republican candidate. From the next election onwards, California would, like the other two states on the West Coast, transition from being solidly Republican states to voting consistently for Democratic candidates (Oregon and Washington even voted for Dukakis in 1988), forming a "blue wall" of sorts over the next three decades. In fact, this is the only time since 1948 that Oregon and California voted for different candidates. Bush is also the last Republican to carry the following counties in a presidential election: Imperial, Monterey, Napa, Sacramento, San Benito and Santa Barbara, the last Republican to win any county in the Bay Area (Napa), the last Republican to secure at least one-quarter of the vote in San Francisco, and the last Republican to secure at least 40% of the vote in Los Angeles County.
Bush became the first Republican to win the White House without carrying Sonoma County, a Republican stronghold for most of the 20th century,[2] since Benjamin Harrison in 1888, as well as the first to do so without carrying Los Angeles County, a bellwether county from 1920 to 1984, since Rutherford Hayes in 1876.
Analysis[]
California voted Republican in 1988 for the ninth time out of ten elections from 1952 on, confirming its status as a Republican electoral bulwark during this period.[3] However, George H. W. Bush won California by only 3.57% even as he won nationally by 7.72%; and Florida displaced it as the state providing the Republican with his biggest raw-vote margin in the nation. Signs of the phenomena that would come to make California a 'Blue Wall' state from 1992 on emerged in this election; for the first time since 1916, Los Angeles County voted for the loser of the national election. Bush was also nearly swept out of the Bay Area, losing populous former Republican strongholds such as Santa Clara, San Mateo, Sonoma, and Marin Counties (as well as Santa Cruz County, the northernmost Central Coast county). While Bush continued to do well in San Diego, Orange, and Ventura Counties (and, to a lesser extent, Santa Barbara, San Luis Obispo, and Monterey Counties, as well as in relatively thinly populated Napa County), this represented a significant erosion of the Republican Party's traditional base along the length of California's coast.[4] By 2016 and 2020, this process was complete, as every coastal county in the state save Del Norte voted Democratic two elections in a row.
On the other hand, in contrast to the 1976, 1968, 1960, and 1948 elections in California, all of which had been close (and which had been won by the Democrat in 1948), Dukakis carried little of inland California, which had traditionally been the Democratic base in the state.[5] Counties that had voted Democratic in all four of those elections, but voted Republican in 1988, included Sacramento, Fresno, Placer, Merced, Shasta, Madera, Amador, Lassen, Plumas, Trinity, and Sierra Counties. Apart from Sacramento, Fresno, and Merced Counties, these have continued to remain as Republican strongholds in the state even as overall it has become increasingly blue in the 21st century. Comparing 1988 directly with what at the time was the most recent close election in California, 1976, Dukakis carried only nine of the 27 counties Carter carried in the state. Three of these (Shasta, Plumas, and Sierra) had even voted for McGovern in the disastrous Democratic defeat of 1972.
Results[]
| 1988 United States presidential election in California[6] | |||||
|---|---|---|---|---|---|
| Party | Candidate | Votes | Percentage | Electoral votes | |
| Republican | George Herbert Walker Bush | 5,054,917 | 51.13% | 47 | |
| Democratic | Michael Stanley Dukakis | 4,702,233 | 47.56% | 0 | |
| Libertarian | Ron Paul | 70,105 | 0.71% | 0 | |
| Independent | Lenora Fulani | 31,180 | 0.32% | 0 | |
| American Independent | 27,818 | 0.28% | 0 | ||
| No party | David Duke (write-in) | 483 | 0.00% | 0 | |
| No party | Eugene McCarthy (write-in) | 234 | 0.00% | 0 | |
| No party | Herbert G. Lewin (write-in) | 58 | 0.00% | 0 | |
| No party | Write-in | 25 | 0.00% | 0 | |
| No party | Larry Holmes (write-in) | 11 | 0.00% | 0 | |
| Invalid or blank votes | — | ||||
| Totals | 9,887,064 | 100.00% | 47 | ||
| Voter turnout | — | ||||
Results Breakdown[]
By county[]
| County | Bush | Votes | Dukakis | Votes | Others | Votes |
|---|---|---|---|---|---|---|
| Orange | 67.75% | 586,230 | 31.09% | 269,013 | 1.16% | 10,064 |
| Sutter | 67.47% | 14,100 | 31.09% | 6,557 | 1.15% | 241 |
| Inyo | 64.34% | 5,042 | 33.85% | 2,653 | 1.81% | 142 |
| Modoc | 62.68% | 2,518 | 35.25% | 1,416 | 2.07% | 83 |
| Glenn | 62.06% | 4,944 | 36.33% | 2,894 | 1.61% | 128 |
| Ventura | 61.64% | 147,604 | 37.19% | 89,065 | 1.17% | 2,804 |
| Kern | 61.48% | 90,550 | 37.40% | 55,083 | 1.13% | 1,660 |
| Mono | 61.38% | 2,177 | 36.20% | 1,284 | 2.42% | 86 |
| Yuba | 61.37% | 8,937 | 37.38% | 5,444 | 1.25% | 182 |
| San Diego | 60.19% | 523,143 | 38.34% | 333,264 | 1.47% | 12,788 |
| San Bernardino | 59.99% | 235,167 | 38.55% | 151,118 | 1.46% | 5,723 |
| Tulare | 59.61% | 46,891 | 39.04% | 30,711 | 1.36% | 1,067 |
| Placer | 59.59% | 42,096 | 38.95% | 27,516 | 1.46% | 1,030 |
| Colusa | 59.49% | 3,077 | 39.10% | 2,022 | 1.41% | 73 |
| Riverside | 59.46% | 199,979 | 39.58% | 133,122 | 0.97% | 3,247 |
| Shasta | 59.36% | 32,402 | 38.79% | 21,171 | 1.85% | 1,012 |
| El Dorado | 59.33% | 30,021 | 39.13% | 19,801 | 1.54% | 781 |
| Lassen | 58.59% | 5,157 | 39.15% | 3,446 | 2.26% | 199 |
| Nevada | 57.76% | 21,383 | 40.46% | 14,980 | 1.78% | 660 |
| Tehama | 56.52% | 9,854 | 41.37% | 7,213 | 2.11% | 367 |
| Kings | 56.41% | 12,118 | 42.56% | 9,142 | 1.03% | 222 |
| Calaveras | 56.28% | 7,640 | 41.80% | 5,674 | 1.92% | 260 |
| Butte | 56.04% | 40,143 | 42.45% | 30,406 | 1.51% | 1,082 |
| Amador | 55.87% | 6,893 | 42.12% | 5,197 | 2.01% | 248 |
| San Luis Obispo | 55.85% | 46,613 | 42.73% | 35,667 | 1.42% | 1,187 |
| Alpine | 55.43% | 306 | 41.67% | 230 | 2.90% | 16 |
| Imperial | 55.16% | 12,889 | 43.84% | 10,243 | 1.00% | 233 |
| Trinity | 54.63% | 3,267 | 42.11% | 2,518 | 3.26% | 195 |
| Madera | 54.59% | 13,255 | 43.83% | 10,642 | 1.58% | 384 |
| Mariposa | 54.53% | 3,768 | 43.39% | 2,998 | 2.08% | 144 |
| San Joaquin | 54.39% | 75,309 | 44.56% | 61,699 | 1.04% | 1,445 |
| Santa Barbara | 54.24% | 77,524 | 44.48% | 63,586 | 1.28% | 1,830 |
| San Benito | 54.11% | 5,578 | 44.23% | 4,559 | 1.66% | 171 |
| Tuolumne | 54.00% | 10,646 | 44.22% | 8,717 | 1.79% | 352 |
| Stanislaus | 53.07% | 51,648 | 45.92% | 44,685 | 1.01% | 982 |
| Merced | 51.20% | 21,717 | 47.40% | 20,105 | 1.40% | 592 |
| Plumas | 51.06% | 4,603 | 47.15% | 4,251 | 1.79% | 161 |
| Sacramento | 51.01% | 201,832 | 47.65% | 188,557 | 1.34% | 5,301 |
| Siskiyou | 50.88% | 9,056 | 47.00% | 8,365 | 2.11% | 376 |
| Sierra | 50.71% | 860 | 46.64% | 791 | 2.65% | 45 |
| Napa | 50.19% | 23,235 | 48.14% | 22,283 | 1.67% | 772 |
| Fresno | 49.95% | 94,835 | 48.79% | 92,635 | 1.26% | 2,400 |
| Monterey | 49.83% | 50,022 | 48.81% | 48,998 | 1.36% | 1,361 |
| Del Norte | 49.73% | 3,714 | 48.03% | 3,587 | 2.24% | 167 |
| Lake | 48.03% | 9,366 | 50.39% | 9,828 | 1.58% | 308 |
| Contra Costa | 47.86% | 158,652 | 51.10% | 169,411 | 1.04% | 3,448 |
| Solano | 47.43% | 50,314 | 51.23% | 54,344 | 1.35% | 1,430 |
| Santa Clara | 46.99% | 254,442 | 51.30% | 277,810 | 1.71% | 9,276 |
| Los Angeles | 46.88% | 1,239,716 | 51.89% | 1,372,352 | 1.23% | 32,603 |
| San Mateo | 42.94% | 109,261 | 55.74% | 141,859 | 1.32% | 3,360 |
| Mendocino | 41.94% | 12,979 | 55.42% | 17,152 | 2.64% | 816 |
| Sonoma | 41.91% | 67,725 | 56.48% | 91,262 | 1.61% | 2,596 |
| Yolo | 41.89% | 22,358 | 57.01% | 30,429 | 1.10% | 585 |
| Humboldt | 41.15% | 21,460 | 57.11% | 29,781 | 1.74% | 905 |
| Marin | 39.73% | 46,855 | 58.85% | 69,394 | 1.42% | 1,671 |
| Santa Cruz | 36.77% | 37,728 | 61.53% | 63,133 | 1.71% | 1,750 |
| Alameda | 33.99% | 162,815 | 64.78% | 310,283 | 1.23% | 5,899 |
| San Francisco | 26.14% | 72,503 | 72.78% | 201,887 | 1.08% | 3,004 |
References[]
- ^ https://elections.cdn.sos.ca.gov/sov/2018-general/sov/04-historical-voter-reg-participation.pdf
- ^ "Opinion: The GOP's Long Slide into Irrelevance in California". Times of San Diego. 2018-07-03. Retrieved 2021-05-31.
- ^ "Red States and Blue States Are a Myth". National Review. 2016-12-01. Retrieved 2020-12-31.
- ^ "The California Republican Party's long slide into irrelevance". Orange County Register. 2018-07-02. Retrieved 2020-12-31.
- ^ "The California Republican Party's long slide into irrelevance". Orange County Register. 2018-07-02. Retrieved 2020-12-31.
- ^ "1988 Presidential General Election Results - California". Dave Leip's U.S. Election Atlas. Retrieved 2008-08-25.
State and district results of the 1988 U.S. presidential election | ||
|---|---|---|
|  | |
- 1988 United States presidential election by state
- United States presidential elections in California
- 1988 California elections