1989 Quebec general election
| |||||||||||||||||||||||||||||||||||||||||||||
125 seats in the 34th National Assembly of Quebec 63 seats were needed for a majority | |||||||||||||||||||||||||||||||||||||||||||||
|---|---|---|---|---|---|---|---|---|---|---|---|---|---|---|---|---|---|---|---|---|---|---|---|---|---|---|---|---|---|---|---|---|---|---|---|---|---|---|---|---|---|---|---|---|---|
| Turnout | 75.02% | ||||||||||||||||||||||||||||||||||||||||||||
| |||||||||||||||||||||||||||||||||||||||||||||
| |||||||||||||||||||||||||||||||||||||||||||||
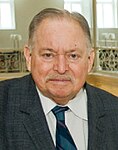
The 1989 Quebec general election was held on September 25, 1989, to elect members of the National Assembly of the Province of Quebec, Canada. The incumbent Quebec Liberal Party, led by Premier Robert Bourassa, won re-election, defeating the Parti Québécois, led by Jacques Parizeau.
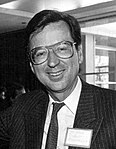
This election was notable for the arrival of the Equality Party, which advocated English-speaking minority rights. It won four seats, but never had any success in any subsequent election.
Results[]
The overall results were:[1]
| Party | Party leader | # of candidates |
Seats | Popular vote | |||||
|---|---|---|---|---|---|---|---|---|---|
| 1985 | Elected | % Change | # | % | % Change | ||||
| Liberal | Robert Bourassa | 125 | 99 | 92 | -7.1% | 1,702,808 | 49.95% | -6.04% | |
| Parti Québécois | Jacques Parizeau | 125 | 23 | 29 | +26.1% | 1,369,067 | 40.16% | +1.47% | |
| Equality | Robert Libman | 19 | * | 4 | * | 125,726 | 3.69% | * | |
| Green | Jean Ouimet | 46 | - | - | - | 67,675 | 1.99% | +1.85% | |
| New Democratic | Gaétan Nadeau | 55 | - | - | - | 41 504 | 1.22% | -1.20% | |
| Unity | 16 | * | - | * | 33 862 | 0.99% | * | ||
| Lemon | 11 | * | - | * | 7 550 | 0.22% | * | ||
| Workers | Gérard Lachance | 19 | * | - | * | 5 497 | 0.16% | * | |
| Progressive Conservative | 12 | - | - | - | 4 750 | 0.14% | -0.89% | ||
| Parti indépendantiste | Gilles Rhéaume | 12 | - | - | - | 4 607 | 0.14% | -0.31% | |
| Marxist–Leninist | 30 | * | - | * | 4 245 | 0.12% | * | ||
| Parti 51 | 11 | * | - | * | 3,846 | 0.11% | * | ||
| United Social Credit | Jean-Paul Poulin | 11 | - | - | - | 2,973 | 0.09% | +0.04% | |
| Socialist | 10 | - | - | - | 2,203 | 0.06% | +0.01% | ||
| Commonwealth of Canada | 11 | - | - | - | 1,799 | 0.05% | -0.02% | ||
| Communist | 10 | - | - | - | 808 | 0.02% | - | ||
| Independents/no designation | 34 | - | - | - | 29,989 | 0.88% | +0.45% | ||
| Total | 557 | 122 | 125 | +2.5% | 3,408,909 | 100% | |||
| Party | Seats | Second | Third | |
|---|---|---|---|---|
| Liberal | 92 | 33 | 0 | |
| Parti Québécois | 29 | 86 | 10 | |
| Equality | 4 | 5 | 10 | |
See also[]
- List of Quebec premiers
- Politics of Quebec
- Timeline of Quebec history
- 34th National Assembly of Quebec
External links[]
References[]
- ^ "Résultats officiels par parti politique pour l'ensemble des circonscriptions". Directeur général des élections du Québec. Archived from the original on 2014-10-08. Retrieved 2012-01-31.
Further reading[]
- Leyton-Brown, David, ed. (1995). Canadian Annual Review of Politics and Public Affairs, 1989. Toronto: University of Toronto Press. ISBN 9780802007148.
| General elections | |
|---|---|
| Municipal elections | |
| Referendums | |
See also: List of Quebec by-elections | |
Categories:
- 1989 elections in Canada
- Elections in Quebec
- 1989 in Quebec
- September 1989 events in Canada