1990 North Rhine-Westphalia state election
This article does not cite any sources. (April 2019) |
| |||||||||||||||||||||||||||||||||||||||||||||||||||||||||||
All 237 seats of the Landtag of North Rhine-Westphalia 119 seats needed for a majority | |||||||||||||||||||||||||||||||||||||||||||||||||||||||||||
|---|---|---|---|---|---|---|---|---|---|---|---|---|---|---|---|---|---|---|---|---|---|---|---|---|---|---|---|---|---|---|---|---|---|---|---|---|---|---|---|---|---|---|---|---|---|---|---|---|---|---|---|---|---|---|---|---|---|---|---|
| Turnout | 9,291,974 (71.8%) | ||||||||||||||||||||||||||||||||||||||||||||||||||||||||||
| |||||||||||||||||||||||||||||||||||||||||||||||||||||||||||
| |||||||||||||||||||||||||||||||||||||||||||||||||||||||||||
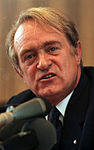


The 1990 North Rhine-Westphalia state election was held on 13 May 1990 to elect the members of the Landtag of North Rhine-Westphalia. The incumbent Social Democratic Party (SPD) government led by Minister-President Johannes Rau retained its majority and continued in office.
Parties[]
The table below lists parties represented in the previous Landtag of North Rhine-Westphalia.
| Name | Ideology | Leader(s) | 1985 result | |||
|---|---|---|---|---|---|---|
| Votes (%) | Seats | |||||
| SPD | Social Democratic Party of Germany Sozialdemokratische Partei Deutschlands |
Social democracy | Johannes Rau | 55.1% | 125 / 227
| |
| CDU | Christian Democratic Union of Germany Christlich Demokratische Union Deutschlands |
Christian democracy | Norbert Blüm | 36.5% | 88 / 227
| |
| FDP | Free Democratic Party Freie Demokratische Partei |
Classical liberalism | 6.0% | 14 / 227
| ||
Election result[]
| Party | Votes | % | +/- | Seats | +/- | Seats % | |
|---|---|---|---|---|---|---|---|
| Social Democratic Party (SPD) | 4,644,431 | 50.0 | 122 | 51.5 | |||
| Christian Democratic Union (CDU) | 3,409,953 | 36.7 | 89 | 37.6 | |||
| Free Democratic Party (FDP) | 535,656 | 5.8 | 14 | 5.9 | |||
| Alliance 90/The Greens (Grüne) | 469,098 | 5.0 | 12 | 5.1 | |||
| The Republicans (REP) | 171,867 | 1.8 | 0 | ±0 | 0 | ||
| Ecological Democratic Party (ÖDP) | 46,650 | 0.5 | 0 | ±0 | 0 | ||
| Others | 14,319 | 0.2 | 0 | ±0 | 0 | ||
| Total | 9,291,974 | 100.0 | 237 | ||||
| Voter turnout | 72.8 | ||||||
Categories:
- Elections in North Rhine-Westphalia
- 1990 elections in Germany
- Johannes Rau