1994 Swedish general election
| |||||||||||||||||||||||||||||||||||||||||||||||||||||||||||||||||||||||||||||||||||||||||||||||||||||||||||||||||||||||
All 349 seats to the Riksdag 175 seats were needed for a majority | |||||||||||||||||||||||||||||||||||||||||||||||||||||||||||||||||||||||||||||||||||||||||||||||||||||||||||||||||||||||
|---|---|---|---|---|---|---|---|---|---|---|---|---|---|---|---|---|---|---|---|---|---|---|---|---|---|---|---|---|---|---|---|---|---|---|---|---|---|---|---|---|---|---|---|---|---|---|---|---|---|---|---|---|---|---|---|---|---|---|---|---|---|---|---|---|---|---|---|---|---|---|---|---|---|---|---|---|---|---|---|---|---|---|---|---|---|---|---|---|---|---|---|---|---|---|---|---|---|---|---|---|---|---|---|---|---|---|---|---|---|---|---|---|---|---|---|---|---|---|---|
| |||||||||||||||||||||||||||||||||||||||||||||||||||||||||||||||||||||||||||||||||||||||||||||||||||||||||||||||||||||||
| |||||||||||||||||||||||||||||||||||||||||||||||||||||||||||||||||||||||||||||||||||||||||||||||||||||||||||||||||||||||


General elections were held in Sweden on 18 September 1994.[1] The Swedish Social Democratic Party remained the largest party in the Riksdag, winning 161 of the 349 seats.[2] Led by Ingvar Carlsson, the party returned to power and formed a minority government after the election. This was the final time the Social Democrats recorded 45% of the vote before the party's vote share steeply declined four years later and never recovered. The Greens also returned to the Riksdag after a three-year absence.
The election saw the largest bloc differences for a generation, with the red-green parties making sizeable inroads into the blue heartlands of inner Småland and Western Götaland, at an even higher rate than 1988. The Social Democrats gathered more than 50% of the vote in all five northern counties, Blekinge, Södermanland, Västmanland and Örebro.[3]
In spite of the loss of power, the Moderates retained their 80 seats and gained 0.5% from 1991. Due to the sizeable losses of their coalition, the net difference between the blocs was 53, with the red-greens making up 201 and the blue parties 148.[3]
The Christian Democrats fared poorly, merely beating the threshold by 3,752 votes.[3] New Democracy, a right-wing populist political party which had entered the Riksdag three years earlier, performed poorly, losing most of its voters and all of its seats in the Riksdag. In total the party's vote share dropped from 6.7% in 1991 to 1.2% in 1994. The election introduced an extended electoral cycle of four years, replacing the previous three-year terms.
It was also notable for being the first electoral event in the world whose official results were published live on the nascent World Wide Web (other countries had previously used the then-fledgling Internet to officially broadcast election results, but with simpler methods such as e-mail lists).[4]
Results[]
There were 5,555,540 valid ballots cast.[3]
 | ||||||
| Party | Votes | % | Seats | +/– | ||
|---|---|---|---|---|---|---|
| Swedish Social Democratic Party | 2,513,905 | 45.3 | 161 | +23 | ||
| Moderate Party | 1,243,253 | 22.4 | 80 | 0 | ||
| Centre Party | 425,153 | 7.7 | 27 | –4 | ||
| Liberal People's Party | 399,556 | 7.2 | 26 | –7 | ||
| Left Party | 342,988 | 6.2 | 22 | +6 | ||
| Green Party | 279,042 | 5.0 | 18 | +18 | ||
| Christian Democratic Society Party | 225,974 | 4.1 | 15 | –11 | ||
| New Democracy | 68,663 | 1.2 | 0 | –25 | ||
| Other parties | 57,006 | 1.0 | 0 | 0 | ||
| Invalid/blank votes | 84,853 | – | – | – | ||
| Total | 5,640,393 | 100 | 349 | 0 | ||
| Registered voters/turnout | 6,496,120 | 86.8 | – | – | ||
| Source: Nohlen & Stöver | ||||||
By municipality[]
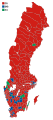
Votes by municipality. The municipalities are the color of the party that got the most votes within the coalition that won relative majority.
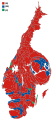
Cartogram of the map to the left with each municipality rescaled to the number of valid votes cast.

Map showing the voting shifts from the 1991 to the 1994 election. Darker blue indicates a municipality voted more towards the parties that formed the centre-right bloc. Darker red indicates a municipality voted more towards the parties that form the left-wing bloc.

Votes by municipality as a scale from red/Left-wing bloc to blue/Centre-right bloc.

Cartogram of vote with each municipality rescaled in proportion to number of valid votes cast. Deeper blue represents a relative majority for the centre-right coalition, brighter red represents a relative majority for the left-wing coalition.


References[]
- ^ Nohlen, D & Stöver, P (2010) Elections in Europe: A data handbook, p1858 ISBN 978-3-8329-5609-7
- ^ Nohlen & Stöver, p1873
- ^ a b c d "Allmänna valen 1994. Del 1, Riksdagsvalet den 18 september 1994" (PDF) (in Swedish). Statistical Central Bureau. Retrieved 18 November 2019.
- ^ General aspects of Sweden's electoral system
| General elections | |
|---|---|
| Local elections | |
| European elections | |
| Referendums | |
- General elections in Sweden
- 1994 elections in Sweden
- September 1994 events in Europe