1999 Scottish Parliament election
| |||||||||||||||||||||||||||||||||||||||||||||||||||||||||||||||||||||||||||||
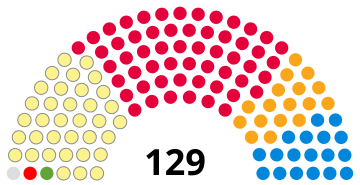
All 129 seats to the Scottish Parliament 65 seats were needed for a majority | |||||||||||||||||||||||||||||||||||||||||||||||||||||||||||||||||||||||||||||
|---|---|---|---|---|---|---|---|---|---|---|---|---|---|---|---|---|---|---|---|---|---|---|---|---|---|---|---|---|---|---|---|---|---|---|---|---|---|---|---|---|---|---|---|---|---|---|---|---|---|---|---|---|---|---|---|---|---|---|---|---|---|---|---|---|---|---|---|---|---|---|---|---|---|---|---|---|---|
| Turnout | Constituency - 58.4% Regional - 58.3% | ||||||||||||||||||||||||||||||||||||||||||||||||||||||||||||||||||||||||||||
| |||||||||||||||||||||||||||||||||||||||||||||||||||||||||||||||||||||||||||||
 The left side shows constituency winners of the election by their party colours. The right side shows regional winners of the election for the additional members by their party colours. Constituency names are listed at the bottom. | |||||||||||||||||||||||||||||||||||||||||||||||||||||||||||||||||||||||||||||
| |||||||||||||||||||||||||||||||||||||||||||||||||||||||||||||||||||||||||||||


The first election to the devolved Scottish Parliament, to fill 129 seats, took place on 6 May 1999. Following the election, the Labour Party and the Liberal Democrats formed the Scottish Executive, with Labour Member of the Scottish Parliament (MSP) Donald Dewar becoming First Minister.
The Scottish Parliament was created after a referendum on devolution took place on 11 September 1997 in which 74.3% of those who voted approved the idea. The Scotland Act (1998) was then passed by the UK Parliament which established the devolved Scottish Parliament and Scottish Executive. The parliament was elected using Mixed-member proportional representation, combining 73 (First-past-the-post) constituencies[note 1] and proportional representation with the 73 constituencies being grouped together to make eight regions each electing seven additional members to make a total of 129. This meant that it would be unlikely for any party to gain a majority of seats in the new parliament and either minority or coalition Scottish Executives would have to be formed.
The first general election to the Scottish Parliament overall produced few surprises with the Labour Party still enjoying high popularity following their landslide victory in the 1997 UK general election as widely expected was the largest party winning 56 seats, mostly in their traditional Central Belt heartlands, which was nine seats short of an overall majority. Labour formed a coalition government with the Liberal Democrats, who won 17 seats. The Scottish National Party (SNP) had done well in opinion polls running up to the election, gaining 40% in some approval ratings, but this level of support was not maintained. The SNP were the second largest party with 35 seats, which still represented their best performance since the October 1974 UK general election. The Conservative Party, still recovering from their wipeout in the 1997 UK general election across Scotland, failed to win a single constituency seat but did manage to win 18 seats through the Additional Member System.
The Scottish Socialist Party (SSP) and the Greens picked up unexpected additional member seats. Robin Harper became the first ever elected Green parliamentarian in the history of the United Kingdom. Dennis Canavan, who had failed to become an approved Labour candidate, won the Falkirk West constituency as an independent candidate.
Following the election the new parliament met in the General Assembly Hall of the Church of Scotland in Edinburgh for the first time on Wednesday 12 May 1999 although the actual devolution of powers from Westminster to the Scottish Parliament did not take place until midnight on Thursday 1 July 1999, almost two months later.
For a full list of MSPs elected, see 1st Scottish Parliament. For lists of constituencies and regions, see Scottish Parliament constituencies and electoral regions.
Results[]
| 56 | 17 | 35 | 18 | |||
| Labour | Lib Dems | SNP | Conservative |
| This article is part of a series within UK politics on the |
| Politics of Scotland |
|---|
 |
Category · Scotland portal
|
 | ||||||||||||||||
| Party | Constituencies | Regional additional members | Total seats | |||||||||||||
|---|---|---|---|---|---|---|---|---|---|---|---|---|---|---|---|---|
| Votes | % | ± | Seats | ± | Votes | % | ± | Seats | ± | Total | ± | % | ||||
| Labour | 908,346 | 38.8 | new | 53 | new | 786,818 | 33.6 | new | 3 | new | 56 | new | 43.4 | |||
| SNP | 672,768 | 28.7 | new | 7 | new | 638,644 | 27.3 | new | 28 | new | 35 | new | 27.1 | |||
| Conservative | 364,425 | 15.6 | new | 0 | new | 359,109 | 15.4 | new | 18 | new | 18 | new | 14.0 | |||
| Liberal Democrats | 333,179 | 14.2 | new | 12 | new | 290,760 | 12.4 | new | 5 | new | 17 | new | 13.2 | |||
| Green | – | – | – | – | – | 84,023 | 3.6 | new | 1 | new | 1 | new | 0.8 | |||
| Scottish Socialist | 23,654 | 1.0 | new | 0 | new | 46,635 | 2.0 | new | 1 | new | 1 | new | 0.8 | |||
| MSP for Falkirk West | 18,511 | 0.8 | new | 1 | new | 27,712 | 1.2 | new | 0 | new | 1 | new | 0.8 | |||
| Socialist Labour | 5,268 | 0.2 | new | 0 | new | 55,153 | 2.4 | new | 0 | new | 0 | new | 0.0 | |||
| ProLife Alliance | – | – | – | – | – | 9,784 | 0.4 | new | 0 | new | 0 | new | 0.0 | |||
| Scottish Unionist | – | – | – | – | – | 7,011 | 0.3 | new | 0 | new | 0 | new | 0.0 | |||
| Liberal | – | – | – | – | – | 5,534 | 0.2 | new | 0 | new | 0 | new | 0.0 | |||
| Natural Law | – | – | – | – | – | 4,906 | 0.2 | new | 0 | new | 0 | new | 0.0 | |||
| Socialist Workers | 2757 | 0.1 | new | 0 | new | – | – | – | – | – | 0 | new | 0.0 | |||
| Highlands and Islands Alliance | – | – | – | – | – | 2,607 | 0.1 | new | 0 | new | 0 | new | 0.0 | |||
| Civil Rights Movement | – | – | – | – | – | 806 | 0.0 | new | 0 | new | 0 | new | 0.0 | |||
| Communist | 190 | 0.0 | new | 0 | new | 521 | 0.0 | new | 0 | new | 0 | new | 0.0 | |||
| Socialist (GB) | – | – | – | – | – | 697 | 0.0 | new | 0 | new | 0 | new | 0.0 | |||
| Humanist | – | – | – | – | – | 447 | 0.0 | new | 0 | new | 0 | new | 0.0 | |||
| Anti-drug | 423 | 0.0 | new | 0 | new | – | – | – | – | – | 0 | new | 0.0 | |||
| Others | 12,967 | 0.6 | – | 0 | – | 17,668 | 0.7 | – | 0 | – | 0 | – | 0.0 | |||
| Valid votes | 2,342,488 | 99.7 | – | 2,338,914 | 99.7 | – | ||||||||||
| Spoilt votes | 7,839 | 0.3 | – | 7,268 | 0.3 | – | ||||||||||
| Total | 2,350,327 | 100 | 73 | – | 2,346,182 | 100 | 56 | – | 129 | – | 100 | |||||
| Electorate/turnout | 4,027,433 | 58.4 | – | 4,027,433 | 58.3 | – | ||||||||||
Constituency and regional summary[]
Central Scotland[]
| Constituency | Elected member | Result | |
|---|---|---|---|
| Airdrie and Shotts | Karen Whitefield | {{{party}}} win (new seat) | |
| Coatbridge and Chryston | Elaine Smith | {{{party}}} win (new seat) | |
| Cumbernauld and Kilsyth | Cathie Craigie | {{{party}}} win (new seat) | |
| East Kilbride | Andy Kerr | {{{party}}} win (new seat) | |
| Falkirk East | Cathy Peattie | {{{party}}} win (new seat) | |
| Falkirk West | Dennis Canavan | {{{party}}} win (new seat) | |
| Hamilton North and Bellshill | Michael McMahon | {{{party}}} win (new seat) | |
| Hamilton South | Tom McCabe | {{{party}}} win (new seat) | |
| Kilmarnock and Loudoun | Margaret Jamieson | {{{party}}} win (new seat) | |
| Motherwell and Wishaw | Jack McConnell | {{{party}}} win (new seat) | |
| Party | Elected candidates | Seats | +/− | Votes | % | +/−% | |
|---|---|---|---|---|---|---|---|
| Labour | 0 | N/A | 129,822 | 39.28% | N/A | ||
| SNP | Alex Neil Andrew Wilson Michael Matheson Gil Paterson Linda Fabiani |
5 | N/A | 91,802 | 27.78% | N/A | |
| Conservative | Lyndsay McIntosh | 1 | N/A | 30,243 | 9.15% | N/A | |
| Independent | 0 | N/A | 27,700 | 8.38% | N/A | ||
| Liberal Democrats | Donald Gorrie | 1 | N/A | 20,505 | 6.20% | N/A | |
| Socialist Labour | 0 | N/A | 10,956 | 3.32% | N/A | ||
| Green | 0 | N/A | 5,926 | 3.32% | N/A | ||
| Scottish Socialist | 0 | N/A | 5,739 | 1.74% | N/A | ||
| Scottish Unionist Party (modern) | 0 | N/A | 2,888 | 0.87% | N/A | ||
| ProLife Alliance | 0 | N/A | 2,567 | 0.78% | N/A | ||
| Scottish Families and Pensioners Party | 0 | N/A | 1,373 | 0.42% | N/A | ||
| Natural Law | 0 | N/A | 1,373 | 0.42% | N/A | ||
| Independent Progressive | 0 | N/A | 248 | 0.08% | N/A | ||
Glasgow[]
| Constituency | Elected member | Result | |
|---|---|---|---|
| Glasgow Anniesland | Donald Dewar | {{{party}}} win (new seat) | |
| Glasgow Baillieston | Margaret Curran | {{{party}}} win (new seat) | |
| Glasgow Cathcart | Mike Watson | {{{party}}} win (new seat) | |
| Glasgow Govan | Gordon Jackson | {{{party}}} win (new seat) | |
| Glasgow Kelvin | Pauline McNeill | {{{party}}} win (new seat) | |
| Glasgow Maryhill | Patricia Ferguson | {{{party}}} win (new seat) | |
| Glasgow Pollok | Johann Lamont | {{{party}}} win (new seat) | |
| Glasgow Rutherglen | Janis Hughes | {{{party}}} win (new seat) | |
| Glasgow Shettleston | Frank McAveety | {{{party}}} win (new seat) | |
| Glasgow Springburn | Paul Martin | {{{party}}} win (new seat) | |
| Party | Elected candidates | Seats | +/− | Votes | % | +/−% | |
|---|---|---|---|---|---|---|---|
| Labour | 0 | N/A | 112,588 | 43.9% | N/A | ||
| SNP | Nicola Sturgeon Dorothy-Grace Elder Kenneth Gibson Sandra White |
4 | N/A | 65,360 | 25.5% | N/A | |
| Conservative | Bill Aitken | 1 | N/A | 20,239 | 7.9% | N/A | |
| Scottish Socialist | Tommy Sheridan | 1 | N/A | 18,581 | 7.2% | N/A | |
| Liberal Democrats | Robert Brown | 1 | N/A | 18,473 | 7.2% | N/A | |
| Green | 0 | N/A | 10,159 | 4.0% | N/A | ||
| Socialist Labour | 0 | N/A | 4,391 | 1.7% | N/A | ||
| ProLife Alliance | 0 | N/A | 2,357 | 0.9% | N/A | ||
| Scottish Unionist | 0 | N/A | 2,283 | 0.9% | N/A | ||
| Communist | 0 | N/A | 521 | 0.2% | N/A | ||
| Humanist | 0 | N/A | 447 | 0.2% | N/A | ||
| Natural Law | 0 | N/A | 419 | 0.2% | N/A | ||
| Socialist (GB) | 0 | N/A | 309 | 0.1% | N/A | ||
| People's Choice | 0 | N/A | 221 | 0.1% | N/A | ||
Highlands and Islands[]
| Constituency | Elected member | Result | |
|---|---|---|---|
| Argyll and Bute | George Lyon | {{{party}}} win (new seat) | |
| Caithness, Sutherland and Easter Ross | Jamie Stone | {{{party}}} win (new seat) | |
| Inverness East, Nairn and Lochaber | Fergus Ewing | {{{party}}} win (new seat) | |
| Moray | Margaret Ewing | {{{party}}} win (new seat) | |
| Orkney | Jim Wallace | {{{party}}} win (new seat) | |
| Ross, Skye and Inverness West | John Farquhar Munro | {{{party}}} win (new seat) | |
| Shetland | Tavish Scott | {{{party}}} win (new seat) | |
| Western Isles | Alasdair Morrison | {{{party}}} win (new seat) | |
| Party | Elected candidates | Seats | +/− | Votes | % | +/−% | |
|---|---|---|---|---|---|---|---|
| SNP | Winnie Ewing Duncan Hamilton |
2 | N/A | 55,593 | 27.73% | N/A | |
| Labour | Peter Peacock Maureen Macmillan Rhoda Grant |
3 | N/A | 51,371 | 25.47% | N/A | |
| Liberal Democrats | 0 | N/A | 43,226 | 21.43% | N/A | ||
| Conservative | Jamie McGrigor Mary Scanlon |
2 | N/A | 30,122 | 14.94% | N/A | |
| Green | 0 | N/A | 7,560 | 3.75% | N/A | ||
| I Noble (Independent) | 0 | N/A | 3,522 | 1.75% | N/A | ||
| Socialist Labour | 0 | N/A | 2,808 | 1.39% | N/A | ||
| Highlands and Islands | 0 | N/A | 2,607 | 1.29% | N/A | ||
| Scottish Socialist Party | 0 | N/A | 1,770 | 0.88% | N/A | ||
| Robbie the Pict (Independent) | 0 | N/A | 1,151 | 0.57% | N/A | ||
| Independent | 0 | N/A | 712 | 0.35% | N/A | ||
| Natural Law | 0 | N/A | 536 | 0.27% | N/A | ||
| Independent | 0 | N/A | 354 | 0.18% | N/A | ||
Lothians[]
| Constituency | Elected member | Result | |
|---|---|---|---|
| Edinburgh Central | Sarah Boyack | {{{party}}} win (new seat) | |
| Edinburgh East and Musselburgh | Susan Deacon | {{{party}}} win (new seat) | |
| Edinburgh North and Leith | Malcolm Chisholm | {{{party}}} win (new seat) | |
| Edinburgh Pentlands | Iain Gray | {{{party}}} win (new seat) | |
| Edinburgh South | Angus Mackay | {{{party}}} win (new seat) | |
| Edinburgh West | Margaret Smith | {{{party}}} win (new seat) | |
| Linlithgow | Mary Mulligan | {{{party}}} win (new seat) | |
| Livingston | Bristow Muldoon | {{{party}}} win (new seat) | |
| Midlothian | Rhona Brankin | {{{party}}} win (new seat) | |
| Party | Elected candidates | Seats | +/− | Votes | % | +/−% | |
|---|---|---|---|---|---|---|---|
| Labour | 0 | N/A | 99,098 | 30.2% | N/A | ||
| SNP | Margo MacDonald Kenny MacAskill Fiona Hyslop |
3 | N/A | 85,085 | 25.7% | N/A | |
| Conservative | David McLetchie James Douglas-Hamilton |
2 | N/A | 52,067 | 15.7% | N/A | |
| Liberal Democrats | David Steel | 1 | N/A | 47,565 | 14.4% | N/A | |
| Green | Robin Harper | 1 | N/A | 22,848 | 6.9% | N/A | |
| Socialist Labour | 0 | N/A | 10,895 | 3.3% | N/A | ||
| Scottish Socialist | 0 | N/A | 5,237 | 1.6% | N/A | ||
| Liberal | 0 | N/A | 2,056 | 0.6% | N/A | ||
| Witchery Tour Party | 0 | N/A | 1,184 | 0.4% | N/A | ||
| ProLife Alliance | 0 | N/A | 898 | 0.3% | N/A | ||
| Civil Rights Movement | 0 | N/A | 806 | 0.2% | N/A | ||
| Natural Law | 0 | N/A | 564 | 0.2% | N/A | ||
| Independent | 0 | N/A | 557 | 0.2% | N/A | ||
| Socialist (GB) | 0 | N/A | 388 | 0.1% | N/A | ||
| Independent | 0 | N/A | 256 | 0.1% | N/A | ||
| Independent | 0 | N/A | 145 | 0.04% | N/A | ||
| Independent | 0 | N/A | 54 | 0.02% | N/A | ||
Mid Scotland and Fife[]
| Constituency | Elected member | Result | |
|---|---|---|---|
| Dunfermline East | Helen Eadie | {{{party}}} win (new seat) | |
| Dunfermline West | Scott Barrie | {{{party}}} win (new seat) | |
| Fife Central | Henry McLeish | {{{party}}} win (new seat) | |
| Fife North East | Iain Smith | {{{party}}} win (new seat) | |
| Kirkcaldy | Marilyn Livingstone | {{{party}}} win (new seat) | |
| North Tayside | John Swinney | {{{party}}} win (new seat) | |
| Ochil | Richard Simpson | {{{party}}} win (new seat) | |
| Perth | Roseanna Cunningham | {{{party}}} win (new seat) | |
| Stirling | Sylvia Jackson | {{{party}}} win (new seat) | |
| Party | Elected candidates | Seats | +/− | Votes | % | +/−% | |
|---|---|---|---|---|---|---|---|
| Labour | 0 | N/A | 101,964 | 33.3% | N/A | ||
| SNP | George Reid Bruce Crawford Tricia Marwick |
3 | N/A | 87,659 | 28.7% | N/A | |
| Conservative | Keith Harding Nick Johnston Brian Monteith |
3 | N/A | 56,719 | 18.6% | N/A | |
| Liberal Democrats | Keith Raffan | 1 | N/A | 38,896 | 12.7% | N/A | |
| Green | 0 | N/A | 11,821 | 3.9% | N/A | ||
| Socialist Labour | 0 | N/A | 4,266 | 1.4% | N/A | ||
| Scottish Socialist | 0 | N/A | 3,044 | 1.0% | N/A | ||
| ProLife Alliance | 0 | N/A | 735 | 0.2% | N/A | ||
| Natural Law | 0 | N/A | 558 | 0.2% | N/A | ||
North East Scotland[]
| Constituency | Elected member | Result | |
|---|---|---|---|
| Aberdeen Central | Lewis Macdonald | {{{party}}} win (new seat) | |
| Aberdeen North | Elaine Thomson | {{{party}}} win (new seat) | |
| Aberdeen South | Nicol Stephen | {{{party}}} win (new seat) | |
| Angus | Andrew Welsh | {{{party}}} win (new seat) | |
| Banff and Buchan | Alex Salmond | {{{party}}} win (new seat) | |
| Dundee East | John McAllion | {{{party}}} win (new seat) | |
| Dundee West | Kate Maclean | {{{party}}} win (new seat) | |
| Gordon | Nora Radcliffe | {{{party}}} win (new seat) | |
| West Aberdeenshire and Kincardine | Mike Rumbles | {{{party}}} win (new seat) | |
| Party | Elected candidates | Seats | +/− | Votes | % | +/−% | |
|---|---|---|---|---|---|---|---|
| SNP | Brian Adam Richard Lochhead Shona Robison Irene McGugan |
4 | N/A | 93,329 | 32.3% | N/A | |
| Labour | 0 | N/A | 72,666 | 25.5% | N/A | ||
| Conservative | David Davidson Ben Wallace Alex Johnstone |
3 | N/A | 52,149 | 18.3% | N/A | |
| Liberal Democrats | 0 | N/A | 49,843 | 17.5% | N/A | ||
| Green | 0 | N/A | 8,067 | 2.8% | N/A | ||
| Socialist Labour | 0 | N/A | 3,557 | 1.2% | N/A | ||
| Scottish Socialist | 0 | N/A | 3,016 | 1.1% | N/A | ||
| Independent | 0 | N/A | 2,303 | 0.8% | N/A | ||
| Independent | 0 | N/A | 770 | 0.3% | N/A | ||
| Natural Law | 0 | N/A | 746 | 0.3% | N/A | ||
South of Scotland[]
| Constituency | Elected member | Result | |
|---|---|---|---|
| Ayr | Ian Welsh | {{{party}}} win (new seat) | |
| Carrick, Cumnock and Doon Valley | Cathy Jamieson | {{{party}}} win (new seat) | |
| Clydesdale | Karen Turnbull | {{{party}}} win (new seat) | |
| Cunninghame South | Irene Oldfather | {{{party}}} win (new seat) | |
| Dumfries | Elaine Murray | {{{party}}} win (new seat) | |
| East Lothian | John Home Robertson | {{{party}}} win (new seat) | |
| Galloway and Upper Nithsdale | Alasdair Morgan | {{{party}}} win (new seat) | |
| Roxburgh and Berwickshire | Euan Robson | {{{party}}} win (new seat) | |
| Tweeddale, Ettrick and Lauderdale | Ian Jenkins | {{{party}}} win (new seat) | |
| Party | Elected candidates | Seats | +/− | Votes | % | +/−% | |
|---|---|---|---|---|---|---|---|
| Labour | 0 | N/A | 98,836 | 31.0% | N/A | ||
| SNP | Michael Russell Adam Ingram Christine Creech |
3 | N/A | 80,059 | 25.1% | N/A | |
| Conservative | Phil Gallie Alex Fergusson Murray Tosh David Mundell |
4 | N/A | 68,904 | 21.6% | N/A | |
| Liberal Democrats | 0 | N/A | 38,157 | 12.0% | N/A | ||
| Socialist Labour | 0 | N/A | 13,887 | 4.4% | N/A | ||
| Green | 0 | N/A | 9,467 | 3.0% | N/A | ||
| Liberal | 0 | N/A | 3,478 | 1.1% | N/A | ||
| Scottish Socialist | 0 | N/A | 3,304 | 1.0% | N/A | ||
| UKIP | 0 | N/A | 1,502 | 0.5% | N/A | ||
| Natural Law | 0 | N/A | 755 | 0.2% | N/A | ||
West of Scotland[]
| Constituency | Elected member | Result | |
|---|---|---|---|
| Clydebank and Milngavie | Des McNulty | {{{party}}} win (new seat) | |
| Cunninghame North | Allan Wilson | {{{party}}} win (new seat) | |
| Dumbarton | Jackie Baillie | {{{party}}} win (new seat) | |
| Eastwood | Kenneth Macintosh | {{{party}}} win (new seat) | |
| Greenock and Inverclyde | Duncan McNeil | {{{party}}} win (new seat) | |
| Paisley North | Wendy Alexander | {{{party}}} win (new seat) | |
| Paisley South | Hugh Henry | {{{party}}} win (new seat) | |
| Strathkelvin and Bearsden | Sam Galbraith | {{{party}}} win (new seat) | |
| West Renfrewshire | Patricia Godman | {{{party}}} win (new seat) | |
| Party | Elected candidates | Seats | +/− | Votes | % | +/−% | |
|---|---|---|---|---|---|---|---|
| Labour | 0 | N/A | 119,663 | 38.5% | N/A | ||
| SNP | Colin Campbell Kay Ullrich Lloyd Quinan Fiona McLeod |
4 | N/A | 80,417 | 25.9% | N/A | |
| Conservative | Annabel Goldie John Young |
2 | N/A | 48,666 | 15.7% | N/A | |
| Liberal Democrats | Ross Finnie | 1 | N/A | 34,095 | 11.0% | N/A | |
| Green | 0 | N/A | 8,174 | 2.6% | N/A | ||
| Scottish Socialist | 0 | N/A | 5,944 | 1.9% | N/A | ||
| Socialist Labour | 0 | N/A | 4,472 | 1.4% | N/A | ||
| ProLife Alliance | 0 | N/A | 3,227 | 1.0% | N/A | ||
| Independent | 0 | N/A | 2,761 | 0.9% | N/A | ||
| Scottish Unionist Party (modern) | 0 | N/A | 1,840 | 0.6% | N/A | ||
| Natural Law Party | 0 | N/A | 589 | 0.2% | N/A | ||
| Independent | 0 | N/A | 565 | 0.2% | N/A | ||
Party representation[]
- Labour – 56 Members of the Scottish Parliament (MSPs)
- SNP – 35 MSPs
- Conservative – 18 MSPs
- Liberal Democrats – 17 MSPs
- Green – 1 MSP
- SSP – 1 MSP
- Others (Dennis Canavan, Falkirk West) – 1 MSP
Party leaders in 1999[]
- Labour – Donald Dewar
- SNP – Alex Salmond
- Conservative – David McLetchie
- Liberal Democrat – Jim Wallace
- SSP – Tommy Sheridan
- Scottish Green Party – Robin Harper
See also[]
- Executive of the 1st Scottish Parliament
- Members elected to the 1st Scottish Parliament
Notes[]
- ^ The same constituency boundaries were used as in the 1997 United Kingdom general election with the exception of Orkney and Shetland, which were made into separate constituencies.
References[]
- ^ "Analysis of Results". www.parliament.scot. 10 July 2011. Archived from the original on 17 July 2020. Retrieved 16 April 2020.
External links[]
| Scottish Parliament | |
|---|---|
| Parliament of Scotland | |
| Convention of Estates | |
| UK Parliament | |
| Local elections | |
| Referendums | |
- General elections to the Scottish Parliament
- 1999 elections in the United Kingdom
- 1999 in Scotland
- 1990s elections in Scotland
- May 1999 events in the United Kingdom