2004 Harlow District Council election
| ||||||||||||||||||||||||||||||||||||||||||||||||||||||||||||||||||||
11 of the 33 seats to Harlow District Council 17 seats needed for a majority | ||||||||||||||||||||||||||||||||||||||||||||||||||||||||||||||||||||
|---|---|---|---|---|---|---|---|---|---|---|---|---|---|---|---|---|---|---|---|---|---|---|---|---|---|---|---|---|---|---|---|---|---|---|---|---|---|---|---|---|---|---|---|---|---|---|---|---|---|---|---|---|---|---|---|---|---|---|---|---|---|---|---|---|---|---|---|---|
| ||||||||||||||||||||||||||||||||||||||||||||||||||||||||||||||||||||
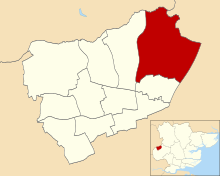
 Map showing the results of contested wards in the 2004 Harlow District Council elections. | ||||||||||||||||||||||||||||||||||||||||||||||||||||||||||||||||||||
| ||||||||||||||||||||||||||||||||||||||||||||||||||||||||||||||||||||
The 2004 Harlow District Council election took place on 10 June 2004 to elect members of Harlow District Council in Essex, England. One third of the council was up for election and the council stayed under no overall control.[1]
After the election, the composition of the council was
- Conservative 13
- Labour 11
- Liberal Democrats 9[2]
Background[]
After the last election in 2003 both the Conservatives and Liberal Democrats had 12 seats, while Labour had 9 councillors.[3] However, in July 2003 councillor Jane Steer defected from the Liberal Democrats to the Conservatives, making the Conservatives the largest group on the council for the first time in almost 50 years with 13 seats.[4] The joint administration between the Conservatives and Liberal Democrats continued to run the council.[4]
Meanwhile, in January 2004 the Liberal Democrat group on the council expelled Matthew Shepherd from the party's group on the council.[5]
Election result[]
Overall turnout at the election was 37%.[6]
| Party | Seats | Gains | Losses | Net gain/loss | Seats % | Votes % | Votes | +/− | |
|---|---|---|---|---|---|---|---|---|---|
| Labour | 5 | 2 | 0 | 45.5 | 33.1 | 6,812 | |||
| Conservative | 4 | 0 | 0 | 36.4 | 31.7 | 6,531 | |||
| Liberal Democrats | 2 | 0 | 1 | 18.2 | 21.8 | 4,494 | |||
| Independent | 0 | 0 | 1 | 0 | 11.6 | 2,399 | |||
| UKIP | 0 | 0 | 0 | 0 | 1.8 | 364 | |||
Ward results[]
Bush Fair[]

| Party | Candidate | Votes | % | ±% | |
|---|---|---|---|---|---|
| Labour | Robert Eschle | 751 | 34.9 | -8.8 | |
| Liberal Democrats | Christopher Robins | 690 | 32.1 | -14.4 | |
| Conservative | Guy Mitchinson | 383 | 17.8 | +8.0 | |
| Independent | William Henderson | 325 | 15.1 | +15.1 | |
| Majority | 61 | 2.8 | |||
| Turnout | 2,149 | 40.2 | +8.9 | ||
| Labour gain from Liberal Democrats | Swing | ||||
Church Langley[]

| Party | Candidate | Votes | % | ±% | |
|---|---|---|---|---|---|
| Conservative | Simon Carter | 1,073 | 61.6 | -6.6 | |
| Liberal Democrats | Linda Pailing | 400 | 22.9 | +5.6 | |
| Labour | Kenneth Lawrie | 270 | 15.5 | +1.0 | |
| Majority | 683 | 38.7 | -12.2 | ||
| Turnout | 1,743 | 30.5 | +8.0 | ||
| Conservative hold | Swing | ||||
Great Parndon[]

| Party | Candidate | Votes | % | ±% | |
|---|---|---|---|---|---|
| Conservative | Edward Johnson | 775 | 40.0 | -9.3 | |
| Labour | Suzanne Ennifer | 612 | 31.6 | -4.3 | |
| Independent | Raymond Statham | 332 | 17.1 | +17.1 | |
| Liberal Democrats | Ian Rideout | 220 | 11.3 | -3.4 | |
| Majority | 163 | 8.4 | -5.0 | ||
| Turnout | 1,939 | 38.9 | +8.0 | ||
| Conservative hold | Swing | ||||
Harlow Common[]

| Party | Candidate | Votes | % | ±% | |
|---|---|---|---|---|---|
| Labour | Gregory Peck | 785 | 39.1 | -15.4 | |
| Conservative | Pamela Norton | 654 | 32.6 | +2.2 | |
| Independent | Gary Roberts | 308 | 15.3 | +15.3 | |
| Liberal Democrats | Clive Enders | 262 | 13.0 | -2.1 | |
| Majority | 131 | 6.5 | -17.6 | ||
| Turnout | 2,009 | 38.1 | +9.0 | ||
| Labour hold | Swing | ||||
Little Parndon & Hare Street[]

| Party | Candidate | Votes | % | ±% | |
|---|---|---|---|---|---|
| Labour | John Jesse | 869 | 46.7 | -2.5 | |
| Conservative | Lee Dangerfield | 589 | 31.6 | +11.2 | |
| Liberal Democrats | John Steer | 404 | 21.7 | -4.2 | |
| Majority | 280 | 15.1 | -8.2 | ||
| Turnout | 1,862 | 37.2 | +6.2 | ||
| Labour hold | Swing | ||||
Mark Hall[]

| Party | Candidate | Votes | % | ±% | |
|---|---|---|---|---|---|
| Labour | Sean Folan | 800 | 38.9 | +0.7 | |
| Liberal Democrats | Nicholas Macy | 584 | 28.4 | -16.4 | |
| Conservative | Christopher Lane | 381 | 18.5 | +5.1 | |
| Independent | Katrina Ray | 290 | 14.1 | +14.1 | |
| Majority | 216 | 10.5 | |||
| Turnout | 2,055 | 42.9 | +9.3 | ||
| Labour gain from Independent | Swing | ||||
Netteswell[]

| Party | Candidate | Votes | % | ±% | |
|---|---|---|---|---|---|
| Liberal Democrats | Ian Jackson | 627 | 34.1 | -15.7 | |
| Labour | Feroz Khan | 448 | 24.3 | -8.2 | |
| UKIP | Anthony Bennett | 364 | 19.8 | +19.8 | |
| Conservative | Andrew Shannon | 260 | 14.1 | +1.8 | |
| Independent | Dean Weston | 141 | 7.7 | +7.7 | |
| Majority | 179 | 9.8 | -7.5 | ||
| Turnout | 1,840 | 36.4 | +7.2 | ||
| Liberal Democrats hold | Swing | ||||
Old Harlow[]
| Party | Candidate | Votes | % | ±% | |
|---|---|---|---|---|---|
| Conservative | Muriel Jolles | 748 | 37.7 | -18.6 | |
| Independent | Colleen Morrison | 534 | 26.9 | +26.9 | |
| Labour | Paul Sztumpf | 496 | 25.0 | -4.9 | |
| Liberal Democrats | Simon MacNeill | 208 | 10.5 | -3.3 | |
| Majority | 214 | 10.8 | -15.6 | ||
| Turnout | 1,986 | 42.4 | +7.9 | ||
| Conservative hold | Swing | ||||
Staple Tye[]

| Party | Candidate | Votes | % | ±% | |
|---|---|---|---|---|---|
| Liberal Democrats | Susan Lawton | 583 | 38.2 | -17.0 | |
| Labour | Caroline Carter | 402 | 26.3 | +0.1 | |
| Conservative | Peter Dobson | 361 | 23.7 | +5.1 | |
| Independent | David Lambert | 180 | 11.8 | +11.8 | |
| Majority | 181 | 11.9 | -17.1 | ||
| Turnout | 1,526 | 32.4 | +9.7 | ||
| Liberal Democrats hold | Swing | ||||
Sumners and Kingsmoor[]

| Party | Candidate | Votes | % | ±% | |
|---|---|---|---|---|---|
| Conservative | John Goddard | 783 | 46.0 | -2.2 | |
| Labour | Robert Long | 623 | 36.6 | -1.5 | |
| Liberal Democrats | Kuzna Jackson | 295 | 17.3 | +3.6 | |
| Majority | 160 | 9.4 | -0.7 | ||
| Turnout | 1,701 | 33.5 | +8.1 | ||
| Conservative hold | Swing | ||||
Toddbrook[]

| Party | Candidate | Votes | % | ±% | |
|---|---|---|---|---|---|
| Labour | Kevin Brooks | 756 | 42.2 | -6.6 | |
| Conservative | Paul Richardson | 524 | 29.3 | -7.3 | |
| Independent | Rex Amor | 289 | 16.1 | +16.1 | |
| Liberal Democrats | Paul Westlake | 221 | 12.3 | -2.3 | |
| Majority | 232 | 12.9 | +0.7 | ||
| Turnout | 1,790 | 35.4 | +5.8 | ||
| Labour hold | Swing | ||||
References[]
- ^ "Harlow council". BBC News Online. 11 June 2004. Retrieved 31 December 2014.
- ^ a b "How the southeast voted in the district council polls". London Evening Standard. NewsBank. 11 June 2004.
- ^ "Local elections". BBC News Online. Retrieved 1 January 2015.
- ^ a b Scotchbrook, Eleanor (30 July 2003). "Lib Dem defection rocks council". Harlow Citizen. NewsBank.
- ^ "News Release from the Liberal Democrats on Harlow District Council". Harlow Liberal Democrats. 12 January 2004. Retrieved 1 January 2015.
- ^ a b c d e f g h i j k l m "Election results". Harlow District Council. 11 June 2004. Archived from the original on 22 October 2004. Retrieved 31 December 2014.
| Essex County Council | |
|---|---|
| Basildon Borough Council | |
| Braintree District Council | |
| Brentwood Borough Council | |
| Castle Point Borough Council | |
| Chelmsford City Council | |
| Colchester Borough Council | |
| Epping Forest District Council | |
| Harlow District Council | |
| Maldon District Council |
|
| Rochford District Council | |
| Southend-on-Sea Borough Council | |
| Tendring District Council |
|
| Thurrock Council | |
| Uttlesford District Council |
|
| |
- Harlow District Council elections
- 2004 English local elections
- 2000s in Essex