2006 Cape Verdean parliamentary election
| |||||||||||||||||||||||||||||
| Registered | 322.725 | ||||||||||||||||||||||||||||
|---|---|---|---|---|---|---|---|---|---|---|---|---|---|---|---|---|---|---|---|---|---|---|---|---|---|---|---|---|---|
| Turnout | 54.18% | ||||||||||||||||||||||||||||
| |||||||||||||||||||||||||||||
 | |||||||||||||||||||||||||||||


 |
|---|
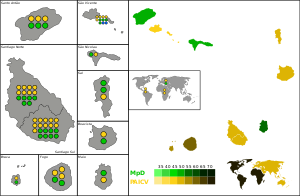
Parliamentary elections were held in Cape Verde on 22 January 2006. The result was a victory for the ruling African Party for the Independence of Cape Verde (PAICV) run by José Maria Neves, which won 41 of the 72 seats in the National Assembly.[1] Second was the Movement for Democracy (Mpd) and third was Democratic and Independent Cape Verdean Union (UCID) led by João Santos dos Luís.
Campaign[]
The PAICV and the MpD (led by Ulisses Correia e Silva) were the only parties to nominate a candidate in every constituency.
Results[]
 | |||||
| Party | Votes | % | Seats | +/– | |
|---|---|---|---|---|---|
| African Party for the Independence of Cape Verde | 88,965 | 52.28 | 41 | +1 | |
| Movement for Democracy | 74,909 | 44.02 | 29 | –1 | |
| Democratic and Independent Cape Verdean Union | 4,495 | 2.64 | 2 | – | |
| Democratic Renewal Party | 1,097 | 0.64 | 0 | 0 | |
| Social Democratic Party | 702 | 0.41 | 0 | 0 | |
| Total | 170,168 | 100.00 | 72 | 0 | |
| Valid votes | 170,168 | 97.32 | |||
| Invalid/blank votes | 4,690 | 2.68 | |||
| Total votes | 174,858 | 100.00 | |||
| Registered voters/turnout | 322,735 | 54.18 | |||
| Source: African Elections Database | |||||
References[]
- ^ Elections in Cape Verde African Elections Database
External links[]
- National Elections Commission (in Portuguese)
| Presidential elections | |
|---|---|
| Parliamentary elections | |
| Local elections | |
This Cape Verde-related article is a stub. You can help Wikipedia by . |
This African election-related article is a stub. You can help Wikipedia by . |
Categories:
- Elections in Cape Verde
- 2006 elections in Africa
- 2006 in Cape Verde
- January 2006 events in Africa
- Cape Verde stubs
- African election stubs