2012 United States presidential election in Illinois
| ||||||||||||||||||||||||||
| Turnout | 69.70% | |||||||||||||||||||||||||
|---|---|---|---|---|---|---|---|---|---|---|---|---|---|---|---|---|---|---|---|---|---|---|---|---|---|---|
| ||||||||||||||||||||||||||
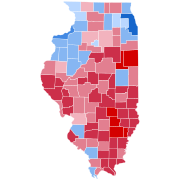 County Results
| ||||||||||||||||||||||||||
| ||||||||||||||||||||||||||


| Elections in Illinois |
|---|
 |
|
|
|
|
|
|
|
|
2012 U.S. presidential election | |
|---|---|
|
|
| Democratic Party | |
|
|
| Republican Party | |
|
|
| Related races | |
|
|
| |
The 2012 United States presidential election in Illinois took place on November 6, 2012, as part of the 2012 United States presidential election in which all 50 states plus the District of Columbia participated. Illinois voters chose 20 electors to represent them in the Electoral College via a popular vote pitting incumbent Democratic President Barack Obama and his running mate, Vice President Joe Biden, against Republican challenger and former Massachusetts Governor Mitt Romney and his running mate, Congressman Paul Ryan. The Obama/Biden ticket won Illinois with 57.60% of the popular vote to Romney/Ryan's 40.73%, thus winning the state's twenty electoral votes by a margin of 16.87%.[1]
Obama's victory continued a Democratic winning streak in the state — with the Democratic candidate having carried Illinois through the six consecutive elections. However, despite Obama's win in 2008 and popularity in the state due to being its former U.S. Senator, his performance significantly worsened, with his margin of victory decreasing from 25.14% to 16.87% and losing 23 counties to Romney that he had won four years prior. Obama further became the first Democrat since Woodrow Wilson in 1916 to win the White House without carrying Madison County, in the Metro East region.
Election information[]
The primaries and general elections coincided with those for congress and those for state offices.
Background[]
Illinois had voted Democratic in the previous five presidential elections. The last Republican ticket to win Illinois in a presidential election was that of George H. W. Bush and Dan Quayle in 1988.
Illinois was the home state of the incumbent president, Barack Obama, who was seeking reelection.
Turnout[]
For the state-run primaries (Democratic and Republican), turnout was 21.72%, with 1,586,171 votes cast.[2][3] For the general election, turnout was 69.70%, with 5,242,014 votes cast.[2][3]
Democratic primary[]
| |||||||||||||||||||
212 Democratic National Convention delegates (189 pledged, 26 unpledged) The number of pledged delegates won is determined by the popular vote | |||||||||||||||||||
|---|---|---|---|---|---|---|---|---|---|---|---|---|---|---|---|---|---|---|---|
| |||||||||||||||||||
 Barack Obama | |||||||||||||||||||
The 2012 Illinois Democratic presidential primary was held on March 20, 2012 in the U.S. state of Illinois as one of the Republican Party's state primaries ahead of the 2012 presidential election. Incumbent president Barack Obama won the primary. Obama was running for reelection without a major opponent.
Obama won all 189 of the state's bound delegates (the state also had 26 superdelegates).[4]
| 2012 Illinois Democratic presidential primary[4][3] | |||
| Candidate | Votes | Percentage | Delegates |
|---|---|---|---|
| Barack Obama (incumbent) | 652,583 | 99.98% | 189 |
| Randall Terry | 134 | 0.02% | 0 |
| Totals | 652,717 | 100.00% | 189 |
Republican primary[]
| |||||||||||||||||||||||||||||||||||||||||
| |||||||||||||||||||||||||||||||||||||||||
 Illinois results by county
Mitt Romney
Rick Santorum | |||||||||||||||||||||||||||||||||||||||||


The 2012 Illinois Republican presidential primary was held on March 20, 2012 in the U.S. state of Illinois as one of the Republican Party's state primaries ahead of the 2012 presidential election.[5][6]
| Candidate | Votes | Percentage | Projected delegate count | ||
|---|---|---|---|---|---|
| NYT | CNN [8] |
FOX | |||
| 435,859 | 46.69% | 42 | 41 | 42 | |
| Rick Santorum | 326,778 | 35.01% | 12 | 10 | 12 |
| Ron Paul | 87,044 | 9.32% | 0 | 0 | 0 |
| Newt Gingrich | 74,482 | 7.98% | 0 | 0 | 0 |
| Rick Perry (withdrawn) | 5,568 | 0.60% | 0 | 0 | 0 |
| Buddy Roemer (withdrawn) | 3,723 | 0.40% | 0 | 0 | 0 |
| Unprojected delegates: | 0 | 3 | 0 | ||
| Total: | 933,454 | 100.00% | 54 | 54 | 54 |
Green primary[]
| |||||||||||||||||||||||||||||
31 Green National Convention delegates | |||||||||||||||||||||||||||||
|---|---|---|---|---|---|---|---|---|---|---|---|---|---|---|---|---|---|---|---|---|---|---|---|---|---|---|---|---|---|
| |||||||||||||||||||||||||||||


The 2012 Illinois Green Party Convention was held on February 24, and saw a binding presidential preference vote cast, awarding delegates, as part of the Green Party's state primaries ahead of the 2012 presidential election.[9]
Unlike the primaries for the major parties, this primary was run by the Green Party of Illinois itself, rather than by the state.
| Candidate | Votes | Percentage | National delegates |
|---|---|---|---|
| Jill Stein | 109 | 71.24% | 22 |
| Roseanne Barr (write-in) | 27 | 17.65% | 5 |
| Kent Mesplay | 8 | 5.23% | 2 |
| Uncommitted | 8 | 5.23% | 2 |
| Others | 1 | 0.65% | 0 |
| Total | 153 | 100% | 31 |
General election[]
While Obama only won 23% of the counties in Illinois, most of the counties he won were heavily populated. His 17-point victory can be largely attributed to his performance in Cook County, which encompasses the Chicago Metropolitan Area. He also won the once Republican favored collar counties (DuPage, Will and Lake). He also performed well in the East St. Louis area.
Owing to Obama's strength as a hometown candidate, and due to the nationwide rural strength of successor Donald Trump during both his 2016 and 2020 runs, Obama remains the last Democrat as of 2020 to win Alexander County, Carroll County, Fulton County, Henderson County, Henry County, Jo Daviess County, Knox County, Mercer County, Putnam County, Warren County, and Whiteside County.
| 2012 United States presidential election in Illinois | ||||||
|---|---|---|---|---|---|---|
| Party | Candidate | Running mate | Votes | Percentage | Electoral votes | |
| Democratic | Barack Hussein Obama (Incumbent) | Joseph Robinette Biden Jr. (Incumbent) | 3,019,512 | 57.60% | 20 | |
| Republican | Willard Mitt Romney | Paul Davis Ryan | 2,135,216 | 40.73% | 0 | |
| Libertarian | Gary Earl Johnson | Jim Gray | 56,229 | 1.07% | 0 | |
| Green | Jill Stein | Cheri Honkala | 30,222 | 0.58% | 0 | |
| Write-ins | Write-ins | 835 | 0.02% | 0 | ||
| Totals | 5,242,014 | 100.00% | 20 | |||
Results by county[]
| County | Barack Hussein Obama Democratic |
Willard Mitt Romney Republican |
Various candidates Other parties |
Margin | Total votes cast | ||||
|---|---|---|---|---|---|---|---|---|---|
| # | % | # | % | # | % | # | % | ||
| Adams | 9,648 | 31.52% | 20,416 | 66.70% | 543 | 1.77% | -10,768 | -35.18% | 30,607 |
| Alexander | 1,965 | 56.13% | 1,487 | 42.47% | 49 | 1.40% | 478 | 13.65% | 3,501 |
| Bond | 3,020 | 40.95% | 4,095 | 55.53% | 260 | 3.53% | -1,075 | -14.58% | 7,375 |
| Boone | 9,883 | 46.09% | 11,096 | 51.75% | 462 | 2.15% | -1,213 | -5.66% | 21,441 |
| Brown | 787 | 33.29% | 1,513 | 64.00% | 64 | 2.71% | -726 | -30.71% | 2,364 |
| Bureau | 8,134 | 48.75% | 8,164 | 48.93% | 388 | 2.33% | -30 | -0.18% | 16,686 |
| Calhoun | 1,080 | 41.93% | 1,440 | 55.90% | 56 | 2.17% | -360 | -13.98% | 2,576 |
| Carroll | 3,665 | 49.49% | 3,555 | 48.00% | 186 | 2.51% | 110 | 1.49% | 7,406 |
| Cass | 2,053 | 42.09% | 2,707 | 55.49% | 118 | 2.42% | -654 | -13.41% | 4,878 |
| Champaign | 40,831 | 51.94% | 35,312 | 44.92% | 2,466 | 3.14% | 5,519 | 7.02% | 78,609 |
| Christian | 5,494 | 37.31% | 8,885 | 60.33% | 348 | 2.36% | -3,391 | -23.03% | 14,727 |
| Clark | 2,591 | 32.86% | 5,144 | 65.23% | 151 | 1.91% | -2,553 | -32.37% | 7,886 |
| Clay | 1,584 | 26.81% | 4,190 | 70.92% | 134 | 2.27% | -2,606 | -44.11% | 5,908 |
| Clinton | 5,596 | 33.95% | 10,524 | 63.86% | 361 | 2.19% | -4,928 | -29.90% | 16,481 |
| Coles | 9,262 | 43.21% | 11,631 | 54.26% | 544 | 2.54% | -2,369 | -11.05% | 21,437 |
| Cook | 1,488,537 | 74.00% | 495,542 | 24.63% | 27,519 | 1.37% | 992,995 | 49.36% | 2,011,598 |
| Crawford | 2,858 | 33.11% | 5,585 | 64.69% | 190 | 2.20% | -2,727 | -31.59% | 8,633 |
| Cumberland | 1,641 | 30.99% | 3,509 | 66.27% | 145 | 2.74% | -1,868 | -35.28% | 5,295 |
| DeKalb | 21,207 | 51.61% | 18,934 | 46.08% | 951 | 2.31% | 2,273 | 5.53% | 41,092 |
| DeWitt | 2,601 | 35.30% | 4,579 | 62.15% | 188 | 2.55% | -1,978 | -26.85% | 7,368 |
| Douglas | 2,430 | 30.77% | 5,334 | 67.54% | 133 | 1.68% | -2,904 | -36.77% | 7,897 |
| DuPage | 199,460 | 49.73% | 195,046 | 48.63% | 6,575 | 1.64% | 4,414 | 1.10% | 401,081 |
| Edgar | 2,565 | 32.74% | 5,132 | 65.50% | 138 | 1.76% | -2,567 | -32.76% | 7,835 |
| Edwards | 754 | 23.36% | 2,405 | 74.50% | 69 | 2.14% | -1,651 | -51.15% | 3,228 |
| Effingham | 3,861 | 23.24% | 12,501 | 75.25% | 251 | 1.51% | -8,640 | -52.01% | 16,613 |
| Fayette | 2,853 | 31.66% | 5,951 | 66.03% | 208 | 2.31% | -3,098 | -34.38% | 9,012 |
| Ford | 1,656 | 27.49% | 4,229 | 70.20% | 139 | 2.31% | -2,573 | -42.71% | 6,024 |
| Franklin | 7,254 | 40.49% | 10,267 | 57.31% | 393 | 2.19% | -3,013 | -16.82% | 17,914 |
| Fulton | 8,328 | 54.04% | 6,632 | 43.03% | 451 | 2.93% | 1,696 | 11.01% | 15,411 |
| Gallatin | 1,029 | 39.99% | 1,492 | 57.99% | 52 | 2.02% | -463 | -17.99% | 2,573 |
| Greene | 2,023 | 35.89% | 3,451 | 61.22% | 163 | 2.89% | -1,428 | -25.33% | 5,637 |
| Grundy | 9,451 | 44.34% | 11,343 | 53.22% | 519 | 2.44% | -1,892 | -8.88% | 21,313 |
| Hamilton | 1,269 | 32.20% | 2,566 | 65.11% | 106 | 2.69% | -1,297 | -32.91% | 3,941 |
| Hancock | 3,650 | 40.06% | 5,271 | 57.85% | 190 | 2.09% | -1,621 | -17.79% | 9,111 |
| Hardin | 742 | 31.85% | 1,535 | 65.88% | 53 | 2.27% | -793 | -34.03% | 2,330 |
| Henderson | 1,978 | 55.44% | 1,541 | 43.19% | 49 | 1.37% | 437 | 12.25% | 3,568 |
| Henry | 12,332 | 50.53% | 11,583 | 47.46% | 490 | 2.01% | 749 | 3.07% | 24,405 |
| Iroquois | 3,413 | 26.70% | 9,120 | 71.34% | 251 | 1.96% | -5,707 | -44.64% | 12,784 |
| Jackson | 13,319 | 55.26% | 9,864 | 40.92% | 921 | 3.82% | 3,455 | 14.33% | 24,104 |
| Jasper | 1,436 | 28.48% | 3,514 | 69.68% | 93 | 1.84% | -2,078 | -41.21% | 5,043 |
| Jefferson | 6,089 | 37.31% | 9,811 | 60.12% | 420 | 2.57% | -3,722 | -22.81% | 16,320 |
| Jersey | 3,667 | 36.82% | 6,039 | 60.64% | 253 | 2.54% | -2,372 | -23.82% | 9,959 |
| Jo Daviess | 5,667 | 49.58% | 5,534 | 48.42% | 228 | 1.99% | 133 | 1.16% | 11,429 |
| Johnson | 1,572 | 27.72% | 3,963 | 69.87% | 137 | 2.42% | -2,391 | -42.15% | 5,672 |
| Kane | 90,332 | 49.73% | 88,335 | 48.63% | 2,981 | 1.64% | 1,997 | 1.10% | 181,648 |
| Kankakee | 21,595 | 47.30% | 23,136 | 50.68% | 923 | 2.02% | -1,541 | -3.38% | 45,654 |
| Kendall | 22,471 | 47.40% | 24,047 | 50.72% | 892 | 1.88% | -1,576 | -3.32% | 47,410 |
| Knox | 13,451 | 57.59% | 9,408 | 40.28% | 497 | 2.13% | 4,043 | 17.31% | 23,356 |
| Lake | 153,757 | 53.48% | 129,764 | 45.14% | 3,972 | 1.38% | 23,993 | 8.35% | 287,493 |
| LaSalle | 23,073 | 48.82% | 23,256 | 49.21% | 930 | 1.97% | -183 | -0.39% | 47,259 |
| Lawrence | 2,011 | 33.58% | 3,857 | 64.40% | 121 | 2.02% | -1,846 | -30.82% | 5,989 |
| Lee | 6,937 | 45.20% | 8,059 | 52.51% | 352 | 2.29% | -1,122 | -7.31% | 15,348 |
| Livingston | 5,020 | 33.30% | 9,753 | 64.69% | 304 | 2.02% | -4,733 | -31.39% | 15,077 |
| Logan | 3,978 | 33.00% | 7,844 | 65.08% | 231 | 1.92% | -3,866 | -32.08% | 12,053 |
| Macon | 22,780 | 46.46% | 25,309 | 51.62% | 941 | 1.92% | -2,529 | -5.16% | 49,030 |
| Macoupin | 9,464 | 44.89% | 10,946 | 51.92% | 673 | 3.19% | -1,482 | -7.03% | 21,083 |
| Madison | 58,922 | 48.11% | 60,608 | 49.49% | 2,943 | 2.40% | -1,686 | -1.38% | 122,473 |
| Marion | 6,225 | 39.35% | 9,248 | 58.46% | 347 | 2.19% | -3,023 | -19.11% | 15,820 |
| Marshall | 2,455 | 41.83% | 3,290 | 56.06% | 124 | 2.11% | -835 | -14.23% | 5,869 |
| Mason | 2,867 | 45.54% | 3,265 | 51.86% | 164 | 2.60% | -398 | -6.32% | 6,296 |
| Massac | 2,092 | 32.21% | 4,278 | 65.87% | 125 | 1.92% | -2,186 | -33.66% | 6,495 |
| McDonough | 5,967 | 47.91% | 6,147 | 49.36% | 340 | 2.73% | -180 | -1.45% | 12,454 |
| McHenry | 59,797 | 44.55% | 71,598 | 53.34% | 2,842 | 2.12% | -11,801 | -8.79% | 134,237 |
| McLean | 31,883 | 43.40% | 39,947 | 54.37% | 1,639 | 2.23% | -8,064 | -10.98% | 73,469 |
| Menard | 2,100 | 34.14% | 3,948 | 64.18% | 103 | 1.67% | -1,848 | -30.04% | 6,151 |
| Mercer | 4,507 | 52.60% | 3,876 | 45.24% | 185 | 2.16% | 631 | 7.36% | 8,568 |
| Monroe | 6,215 | 35.53% | 10,888 | 62.25% | 387 | 2.21% | -4,673 | -26.72% | 17,490 |
| Montgomery | 5,058 | 41.50% | 6,776 | 55.60% | 354 | 2.90% | -1,718 | -14.10% | 12,188 |
| Morgan | 5,806 | 41.06% | 7,972 | 56.37% | 364 | 2.57% | -2,166 | -15.32% | 14,142 |
| Moultrie | 2,144 | 35.29% | 3,784 | 62.29% | 147 | 2.42% | -1,640 | -27.00% | 6,075 |
| Ogle | 9,514 | 40.72% | 13,422 | 57.44% | 431 | 1.84% | -3,908 | -16.72% | 23,367 |
| Peoria | 40,209 | 51.28% | 36,774 | 46.90% | 1,428 | 1.82% | 3,435 | 4.38% | 78,411 |
| Perry | 3,819 | 39.85% | 5,507 | 57.46% | 258 | 2.69% | -1,688 | -17.61% | 9,584 |
| Piatt | 3,090 | 35.49% | 5,413 | 62.17% | 204 | 2.34% | -2,323 | -26.68% | 8,707 |
| Pike | 2,278 | 31.20% | 4,860 | 66.56% | 164 | 2.25% | -2,582 | -35.36% | 7,302 |
| Pope | 650 | 29.25% | 1,512 | 68.05% | 60 | 2.70% | -862 | -38.79% | 2,222 |
| Pulaski | 1,389 | 46.12% | 1,564 | 51.93% | 59 | 1.96% | -175 | -5.81% | 3,012 |
| Putnam | 1,559 | 49.60% | 1,502 | 47.79% | 82 | 2.61% | 57 | 1.81% | 3,143 |
| Randolph | 5,759 | 39.89% | 8,290 | 57.42% | 389 | 2.69% | -2,531 | -17.53% | 14,438 |
| Richland | 2,362 | 32.44% | 4,756 | 65.31% | 164 | 2.25% | -2,394 | -32.88% | 7,282 |
| Rock Island | 39,157 | 60.04% | 24,934 | 38.23% | 1,126 | 1.73% | 14,223 | 21.81% | 65,217 |
| Saline | 3,701 | 34.52% | 6,806 | 63.49% | 213 | 1.99% | -3,105 | -28.96% | 10,720 |
| Sangamon | 42,107 | 44.65% | 50,225 | 53.26% | 1,965 | 2.08% | -8,118 | -8.61% | 94,297 |
| Schuyler | 1,727 | 44.26% | 2,069 | 53.02% | 106 | 2.72% | -342 | -8.76% | 3,902 |
| Scott | 910 | 35.44% | 1,587 | 61.80% | 71 | 2.76% | -677 | -26.36% | 2,568 |
| Shelby | 3,342 | 32.01% | 6,843 | 65.55% | 254 | 2.43% | -3,501 | -33.54% | 10,439 |
| St. Clair | 67,285 | 56.15% | 50,125 | 41.83% | 2,417 | 2.02% | 17,160 | 14.32% | 119,827 |
| Stark | 1,095 | 41.13% | 1,528 | 57.40% | 39 | 1.47% | -433 | -16.27% | 2,662 |
| Stephenson | 10,165 | 48.11% | 10,512 | 49.75% | 451 | 2.13% | -347 | -1.64% | 21,128 |
| Tazewell | 24,438 | 39.88% | 35,335 | 57.66% | 1,509 | 2.46% | -10,897 | -17.78% | 61,282 |
| Union | 3,137 | 37.71% | 4,957 | 59.59% | 224 | 2.69% | -1,820 | -21.88% | 8,318 |
| Vermilion | 12,878 | 42.36% | 16,892 | 55.57% | 630 | 2.07% | -4,014 | -13.20% | 30,400 |
| Wabash | 1,590 | 30.97% | 3,478 | 67.74% | 66 | 1.29% | -1,888 | -36.77% | 5,134 |
| Warren | 4,044 | 51.73% | 3,618 | 46.28% | 156 | 2.00% | 426 | 5.45% | 7,818 |
| Washington | 2,450 | 32.95% | 4,792 | 64.45% | 193 | 2.60% | -2,342 | -31.50% | 7,435 |
| Wayne | 1,514 | 19.67% | 5,988 | 77.80% | 195 | 2.53% | -4,474 | -58.13% | 7,697 |
| White | 2,188 | 30.90% | 4,731 | 66.80% | 163 | 2.30% | -2,543 | -35.91% | 7,082 |
| Whiteside | 14,833 | 57.43% | 10,448 | 40.45% | 547 | 2.12% | 4,385 | 16.98% | 25,828 |
| Will | 144,229 | 51.85% | 128,969 | 46.36% | 4,964 | 1.78% | 15,260 | 5.49% | 278,162 |
| Williamson | 10,647 | 36.40% | 17,909 | 61.22% | 698 | 2.39% | -7,262 | -24.82% | 29,254 |
| Winnebago | 61,732 | 51.70% | 55,138 | 46.18% | 2,527 | 2.12% | 6,594 | 5.52% | 119,397 |
| Woodford | 5,572 | 29.42% | 12,961 | 68.44% | 405 | 2.14% | -7,389 | -39.02% | 18,938 |
| Totals | 3,013,423 | 57.61% | 2,125,405 | 40.63% | 92,444 | 1.76% | 888,018 | 16.98% | 5,230,852 |
Counties that flipped from Democratic to Republican[]
- Boone (largest city: Belvidere)
- Bureau (largest city: Princeton)
- Calhoun (largest village: Hardin)
- Cass (largest city: Beardstown)
- Coles (largest city: Charleston)
- Gallatin (largest city: Shawneetown)
- Grundy (largest city: Morris)
- Kankakee (largest city: Kankakee)
- Kendall (largest village: Oswego)
- LaSalle (largest city: Ottawa)
- Macon (largest city: Decatur)
- Mason (largest city: Havana)
- Macoupin (largest city: Carlinville)
- Madison (largest city: Granite City)
- McDonough (largest city: Macomb)
- McHenry (largest city: Crystal Lake)
- McLean (largest city: Bloomington)
- Montgomery (largest city: Litchfield)
- Pulaski (largest city: Mounds)
- Sangamon (largest city: Springfield)
- Schuyler (largest city: Rushville)
- Stephenson (largest city: Freeport)
- Vermilion (largest city: Danville)
See also[]
- United States presidential elections in Illinois
- Illinois Republican Party
- 2012 Republican Party presidential debates and forums
- 2012 Republican Party presidential primaries
- Results of the 2012 Republican Party presidential primaries
References[]
- ^ "Illinois Board of Elections". Retrieved January 2, 2013.
- ^ a b "Voter Turnout". www.elections.il.gov. Illinois State Board of Elections. Retrieved 24 March 2020.[permanent dead link]
- ^ a b c "Election Results". www.elections.il.gov. Illinois State Board of Elections. Archived from the original on 22 February 2020. Retrieved 23 March 2020.
- ^ a b "Illinois Democratic Delegation 2012". www.thegreenpapers.com. The Green Papers. Retrieved 24 March 2020.
- ^ "Primary and Caucus Printable Calendar". CNN. Retrieved January 11, 2012.
- ^ "Presidential Primary Dates" (PDF). Federal Election Commission. Retrieved January 23, 2012.
- ^ http://www.elections.il.gov/ElectionInformation/VoteTotalsList.aspx?ElectionType=GP&ElectionID=32&SearchType=OfficeSearch&OfficeID=5881&QueryType=Office&
- ^ Illinois - CNN
- ^ a b "2012 Illinois Green Primary". 24 February 2012. Retrieved 6 August 2020.
- ^ "2012 Illinois Green Primary results". Archived from the original on 2012-11-16.
{{cite web}}: CS1 maint: bot: original URL status unknown (link) - ^ http://www.uselectionatlas.org/RESULTS/datagraph.php?fips=17&year=2012&off=0&elect=0&f=0
External links[]
- The Green Papers: for Illinois
- The Green Papers: Major state elections in chronological order
| By year | |
|---|---|
| Presidential |
|
| U.S. Senate | |
| U.S. House |
|
| Special | |
| Gubernatorial | |
| Lieutenant gubernatorial | |
| Other state executive offices | |
| State Senate |
|
| State House | |
| State judicial |
|
| Ballot measures and referendums |
|
| Chicago mayoral |
|
| Chicago City Council |
|
| Other municipal |
|
| Cook County |
|
State and district results of the 2012 United States presidential election | ||
|---|---|---|
| 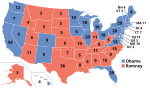 | |
- 2012 Illinois elections
- 2012 United States presidential election by state
- United States presidential elections in Illinois