2014–15 South Pacific cyclone season
| 2014–15 South Pacific cyclone season | |
|---|---|
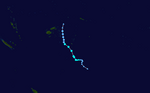
 Season summary map | |
| Seasonal boundaries | |
| First system formed | November 21, 2014 |
| Last system dissipated | July 4, 2015 |
| Strongest storm | |
| Name | Pam (Third-most intense tropical cyclone in the South Pacific) |
| • Maximum winds | 250 km/h (155 mph) (10-minute sustained) |
| • Lowest pressure | 896 hPa (mbar) |
| Seasonal statistics | |
| Total disturbances | 16, 1 unofficial |
| Total depressions | 12, 1 unofficial |
| Tropical cyclones | 6, 1 unofficial |
| Severe tropical cyclones | 2 |
| Total fatalities | 16 total |
| Total damage | $692 million (2014 USD) |
| Related articles | |
The 2014–15 South Pacific cyclone season was a slightly-below average tropical cyclone season, with five tropical cyclones occurring within the basin between 160°E and 120°W. The season officially ran from November 1, 2014, to April 30, 2015. During the season, tropical cyclones were officially monitored by the Regional Specialized Meteorological Center (RSMC) in Nadi, Fiji and the Tropical Cyclone Warning Centers in Brisbane, Australia and Wellington, New Zealand. The United States Armed Forces through the Joint Typhoon Warning Center (JTWC) also monitored the basin and issued unofficial warnings for American interests. RSMC Nadi attaches a number and an F suffix to tropical disturbances that form in or move into the basin while the JTWC designates significant tropical cyclones with a number and a P suffix. RSMC Nadi, TCWC Wellington and TCWC Brisbane all use the Australian Tropical Cyclone Intensity Scale and estimate windspeeds over a period of ten minutes, while the JTWC estimated sustained winds over a 1-minute period, which are subsequently compared to the Saffir–Simpson hurricane wind scale (SSHWS).
Seasonal forecasts[]
| Source/Record | Tropical Cyclone |
Severe Tropical Cyclone |
Ref |
|---|---|---|---|
| Record high: | 1997–98: 16 | 1982–83:10 | [1] |
| Record low: | 2011–12: 3 | 2008–09: 0 | [1] |
| Average (1969–70 – 2013–14): | 8.5 | — | [2] |
| NIWA October | 8-12 | >4 | [3] |
| Fiji Meteorological Service | 6-10 | 2-4 | [2] |
| NIWA February | 8-10 | >4 | [4] |
| Region | Chance of above average |
Average number |
Actual activity |
| Southern Pacific | 48% | 15 | 1 |
| Western South Pacific | 56% | 8 | 0 |
| Eastern South Pacific | 47% | 11 | 1 |
| Source:BOM's Seasonal Outlooks for Tropical Cyclones.[5] | |||
Ahead of the cyclone season, the Fiji Meteorological Service (FMS), Australian Bureau of Meteorology (BoM), New Zealand's MetService and National Institute of Water and Atmospheric Research (NIWA) and various other Pacific Meteorological services, all contributed towards the Island Climate Update tropical cyclone outlook that was released during October 2014.[3] The outlook took into account the ENSO-neutral conditions that had been observed across the Pacific and analogue seasons that had ENSO-neutral and weak El Niño conditions occurring during the season.[3] The outlook called for a near average number of tropical cyclones for the 2014–15 season, with eight to twelve named tropical cyclones, to occur between 135°E and 120°W compared to an average of 10.[3] At least four of the tropical cyclones were expected to become category 3 severe tropical cyclones, while three could become category 4 severe tropical cyclones, they also noted that a Category 5 severe tropical cyclone was unlikely to occur.[3] In addition to contributing towards the Island Climate Update outlook, RSMC Nadi and the BoM issued their own seasonal forecasts for the South Pacific region.[2][5]
The BoM issued 3 seasonal forecasts for the Southern Pacific between 142.5°E and 120°W, one for the Western Southern Pacific region between 142.5°E and 165°E and one for the Eastern Southern Pacific region between 165°E and 120°W.[5] They predicted that the region as a whole, would experience near average tropical cyclone activity during the coming season with a 55% chance of it being above average.[5] The Western region was predicted to have 39% chance of being above average while the Eastern region had a 55% chance of being above average.[5] Within their outlook the FMS predicted that between six and ten tropical cyclones, would occur within the basin compared to an average of around 8.5 cyclones.[2] At least two of the tropical cyclones were expected to become category 3 severe tropical cyclones, while 1-2 might intensify into a category 4 or 5 severe tropical cyclones.[2] They also reported that the tropical cyclone genesis trough was expected to be located near to and to the east of the International Date Line.[2] This was based on the expected and predicted ENSO conditions, and the existence of the Pacific warm pool of sub-surface temperature anomalies in this region.[2] An updated Island Climate Update tropical cyclone outlook was issued during February 2015, which suggested that near normal activity was still possible.[4] The outlook took into account Tropical Cyclones Niko and Ola as well as the weak El Niño conditions, that were predicted to persist over the region.[4] As a result, the update predicted that an additional six to eight named tropical cyclones would develop over the basin, which would bring the overall total to between eight and ten tropical cyclones.[4] The update also predicted that at least four tropical cyclones would intensify into category three severe tropical cyclones, of which three could intensify and become either a category four or five severe tropical cyclone.[4]
Both the Island Climate Update and the FMS tropical cyclone outlooks assessed the risk of a tropical cyclone affecting a certain island or territory.[2][3] As the tropical cyclone genesis trough of low pressure was expected to be located near to and to the east of the International Date Line, normal or slightly above normal activity was expected for areas near the dateline.[2][3] The Island Climate Update Outlook predicted that Vanuatu and New Caledonia had a reduced chance of being affected by multiple tropical cyclones.[3] The Northern Cook Islands, Fiji, Papua New Guinea, Tonga, Wallis and Futuna, the Solomon Islands, Northern New Zealand and French Polynesia's Austral and Society Islands were all predicted to have a normal chance of being affected by a tropical cyclone or ex tropical cyclone.[3] They also predicted that Niue, Samoa, Tokelau, Tuvalu and the Southern Cook Islands had an elevated chance while French Polynesia's Tuamotu Archipelago and Marquesas Islands, Kiribati and the Pitcairn Islands, had an unlikely chance of being affected by a tropical cyclone.[3] The FMS's outlook predicted that Wallis and Futuna, Tuvalu, Samoa, Niue, Tonga, Vanuatu, the Southern Cook Islands and the Solomon Islands had a high chance of being affected by a tropical cyclone.[2] Fiji, French Polynesia, New Caledonia and the Northern Cook Islands and had a moderate chance of being affected by a tropical cyclone while Kiribati had a low chance.[2] Because of its proximity to the warm pool and genesis area, the FMS noted that Tokelau had a low to moderate risk of being affected by a tropical cyclone.[2] RSMC Nadi also predicted that there was an increased risk of severe tropical cyclones, affecting the region this year when compared to the previous season.[6] There was a high chance of Tuvalu, Samoa, Niue, Tonga, the Southern Cook Islands, Vanuatu and the Solomon Islands being affected by a severe tropical cyclone.[6] The chances of Fiji, New Caledonia, the Northern Cook Islands and French Polynesia being affected by a severe tropical cyclone were moderate while Kiribati, Tokelau and Wallis and Futuna had a low risk.[6] The updated Island Climate Update tropical cyclone outlook reported that there was still a chance that two or more systems could interact with New Caledonia, Vanuatu, Fiji, and Tonga.[4] However, it was noted that activity might be slightly reduced to the north of Vanuatu and that an elevated amount of activity might occur in the Coral Sea, to the east of Queensland.[4]
Seasonal summary[]

Systems[]
Tropical Depression 01F[]
| Tropical depression (Australian scale) | |
  | |
| Duration | November 21 – November 26 |
|---|---|
| Peak intensity | Winds not specified 1003 hPa (mbar) |
During November 21, RSMC Nadi reported that a tropical disturbance had developed about 375 km (235 mi) to the north-west of Mata-Utu, on the French territory of Wallis and Futuna.[7] Over the next couple of days atmospheric convection surrounding the system gradually became better organised as it moved south-westwards before it was classified as a tropical depression during November 23.[citation needed]
Tropical Depression 03F[]
| Tropical depression (Australian scale) | |
  | |
| Duration | December 20 – December 26 |
|---|---|
| Peak intensity | 55 km/h (35 mph) (10-min) 998 hPa (mbar) |
Late on December 20, RSMC Nadi reported that Tropical Disturbance 03F, had developed within an area of low vertical windshear to the north-northeast of Pago Pago, American Samoa.[8]
Tropical Depression 04F[]
| Tropical depression (Australian scale) | |
  | |
| Duration | December 21 – December 24 |
|---|---|
| Peak intensity | Winds not specified 1000 hPa (mbar) |
During December 21, RSMC Nadi reported that a tropical disturbance had developed about 275 km (170 mi) northeast of Aitutaki in the Cook Islands. It moved globally Southeast as a tropical depression. It triggered heavy rain in French Polynesia's Society Islands and in the Northern Cook Islands.[citation needed]
The system was last noted by the FMS during December 24, while it was located to the southeast of Tahiti, French Polynesia.[citation needed]
Tropical Depression 05F[]
| Tropical depression (Australian scale) | |
  | |
| Duration | December 23 – December 29 |
|---|---|
| Peak intensity | Winds not specified 1000 hPa (mbar) |
Tropical Disturbance 05F was first noted on December 23, while it was located about 75 km (45 mi) to the north of Mata-Utu in the island nation of Wallis and Futuna.[9] The system was located within a marginal environment for further development, which contained low to moderate vertical wind shear and had a good outflow.[9][10]
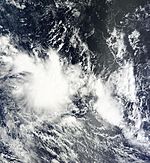
Tropical Cyclone Niko[]
| Category 2 tropical cyclone (Australian scale) | |
| Tropical storm (SSHWS) | |
  | |
| Duration | January 19 – January 25 |
|---|---|
| Peak intensity | 100 km/h (65 mph) (10-min) 982 hPa (mbar) |
During January 19, RSMC Nadi reported that Tropical Disturbance 06F had developed, to the northeast of Papeete on the French Polynesian island of Tahiti.[11] The system lay under an upper-level ridge of high pressure in an environment, which was favorable for further development with low to moderate vertical windshear.[11][12] As a result, the organisation of the atmospheric convection surrounding the system significantly improved, while the systems low level circulation centre rapidly consolidated over the next day. As a result, late on January 20, the JTWC initiated advisories on the system an assigned it the designation 07P. RSMC Nadi subsequently reported that the system had developed into a category 1 tropical cyclone and named it Niko. Over the next two days the system gradually intensified further and became a category 2 tropical cyclone early on January 22. On January 25, Niko completed its extratropical transition.[citation needed]
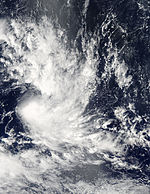
Severe Tropical Cyclone Ola[]
| Category 3 severe tropical cyclone (Australian scale) | |
| Category 2 tropical cyclone (SSHWS) | |
  | |
| Duration | January 29 – February 3 |
|---|---|
| Peak intensity | 150 km/h (90 mph) (10-min) 955 hPa (mbar) |
During January 29, RSMC Nadi reported that Tropical Depression 09F had moved into the basin, from the Australian region to the northwest of New Caledonia.[13] The system was moving towards the east-northeast and lay within an area of low vertical wind shear underneath an upper-level ridge of high pressure.[13] During January 30 the JTWC initiated advisories on the system and assigned it the designation Tropical Cyclone 10P. RSMC Nadi subsequently reported that the system had become a category 1 tropical cyclone and named it Ola. Over the next two days the system gradually intensified further and became a category 3 severe tropical cyclone early on February 1.[citation needed]
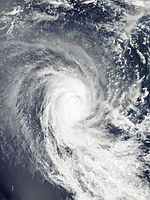
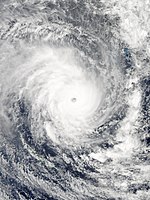
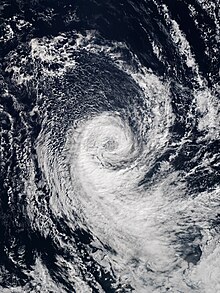
Severe Tropical Cyclone Pam[]
| Category 5 severe tropical cyclone (Australian scale) | |
| Category 5 tropical cyclone (SSHWS) | |
  | |
| Duration | March 6 – March 15 |
|---|---|
| Peak intensity | 250 km/h (155 mph) (10-min) 896 hPa (mbar) |
During March 6, RSMC Nadi reported that Tropical Disturbance 11F had developed about 1,140 km (710 mi) to the northwest of Nadi, Fiji.[14] The disturbance continued on its southwestward track until two days later, when the RSMC had upgraded it to a tropical depression.[15] The JTWC issued a Tropical Cyclone Formation Alert (TCFA).[16] Cyclone Pam developed out of this system on March 9, when RSMC Nadi started tracking it as a Category 1 tropical cyclone. Located in an area of favourable conditions, Pam gradually intensified into a powerful Category 5 severe tropical cyclone by March 12. Pam's ten-minute maximum sustained winds peaked at 250 km/h (155 mph), along with a minimum pressure of 896 hPa, making Pam the most intense tropical cyclone of the basin since Zoe in 2002.[17] Several hours later, the cyclone began to curve towards the south-southeast, allowing Pam to pass just east of Efate,[18] becoming the single worst natural disaster in the history of Vanuatu.[19] The cyclone crippled Vanuatu's infrastructure: an estimated 90 percent of the nation's buildings were impacted by the storm's effects, telecommunications were paralyzed, and water shortages took place.[citation needed]
The FMS estimated Pam as having record-breaking 250 km/h (155 mph) ten-minute sustained winds.[20] The storm's winds gradually slowed afterwards as Pam tracked west of Tafea. However, the FMS indicated that the cyclone's pressure dropped further to a minimum of 896 mbar (hPa; 26.46 inHg) on March 14.[21] Pam left the FMS area of responsibility as it progressed along its path, the storm's eye faded away and Pam's low level circulation became displaced from its associated thunderstorms, signalling a rapid weakening phase.[22] Later on March 15, both agencies discontinued issuing advisories as Pam entered a phase of extratropical transition while affecting northeastern New Zealand.[citation needed]
Tropical Cyclone Reuben[]
| Category 1 tropical cyclone (Australian scale) | |
| Tropical storm (SSHWS) | |
  | |
| Duration | March 19 – March 23 |
|---|---|
| Peak intensity | 75 km/h (45 mph) (10-min) 990 hPa (mbar) |
On March 19, RSMC Nadi had reported that Tropical Disturbance 12F had developed about 375 km (235 mi) to the southwest of Apia on the Samoan island of Upolu.[23] The system moved southwards as it was classified as a tropical depression. On March 21, the JTWC classified 12F as a tropical storm, giving the designation 20P. Early on March 22, RSMC Nadi reported that the system had developed into a category 1 tropical cyclone and named it Reuben, while it was located about 220 km (135 mi) to the south of [Nukuʻalofa]], Tonga.[24] Early on March 23, both agencies discontinued issuing advisories as Reuben entered a phase of extratropical transition.[citation needed]
Between March 20–22, Reuben's precursor tropical depression produced heavy rain and strong winds over Fiji's Lau Islands.[25]
Tropical Depression 14F[]
| Tropical depression (Australian scale) | |
| Subtropical cyclone | |
  | |
| Duration | March 28 – March 31 |
|---|---|
| Peak intensity | 55 km/h (35 mph) (10-min) 998 hPa (mbar) |
The depression was last noted by the FMS during March 31, while it was located about 600 km (375 mi) to the southeast of Rarotonga in the Cook Islands.[26]
Tropical Cyclone Solo[]
| Category 2 tropical cyclone (Australian scale) | |
| Tropical storm (SSHWS) | |
  | |
| Duration | April 9 – April 12 |
|---|---|
| Peak intensity | 100 km/h (65 mph) (10-min) 985 hPa (mbar) |
Tropical Depression 15F developed within the monsoon trough during April 9, about 465 km (290 mi) to the south of Honiara in the Solomon Islands.[27][28] The system was located under an upper-level ridge of high pressure and in a region favouring further development, including low vertical wind shear and sea surface temperatures of above 30 °C (86 °F).[27][29][30] As a result, the system rapidly developed during that day as it moved southwards, with atmospheric convection wrapping into the systems low level circulation centre.[29][30] During the next day the JTWC initiated advisories on the system and classified it as Tropical Cyclone 23P, while the FMS reported that the system had developed into a Category 1 tropical cyclone and named it Solo.[30][31] The system continued to intensify during that day, before both the JTWC and the FMS reported that Solo had peaked with winds of 100 km/h (60 mph) during April 11, which made it a category 2 tropical cyclone on the Australian scale.[32][33]
Turning to the south-southeast, Solo entered an area of strong vertical wind shear and subsequently weakened.[28][33] During April 12, Solo passed about 50 km (30 mi) to the northeast of the Belep Islands, as it moved between New Caledonia's mainland and the Loyalty Islands.[28][31] Solo was subsequently declassified as a tropical cyclone later that day, after it had lost the characteristics of a tropical cyclone.[31] Within the Solomon Islands, the Makira – Ereteria river was flooded during April 7, while flash flooding destroyed food gardens, bananas and cocoa beans.[34] As it impacted New Caledonia, Solo caused wind gusts of up to 100 km/h (62 mph), while rainfall totals of up to 222 mm (8.7 in) were recorded in New Caledonia.[28] As an indirect effect of Solo significant damage was recorded in New Caledonia, with road impassable in places and the drinking water deteriorated in the municipality of Pouébo.[28]
Tropical Cyclone Raquel[]
| Category 1 tropical cyclone (Australian scale) | |
| Tropical storm (SSHWS) | |
  | |
| Duration | June 28 – July 4 |
|---|---|
| Peak intensity | 65 km/h (40 mph) (10-min) 998 hPa (mbar) |
Tropical Disturbance 17F developed about 718 km (445 mi) to the northeast of Honiara in the Solomon Islands on June 28.[35][36] Over the next couple of days the system moved westwards into the Australian region, where it developed into a Category 1 tropical cyclone and was named Raquel by the BoM during June 30.[37][38] Raquel subsequently started to move eastwards and moved back into the South Pacific basin, where it weakened into a tropical depression.[39] The system subsequently moved south-westwards and out of the basin during July 4, as it impacted the Solomon Islands, with high wind gusts and heavy rain.[39][40] During post analysis, it was determined that Raquel had developed into a Category 1 tropical cyclone during June 30, while it was located within the South Pacific basin.[35]
Other systems[]
Tropical Disturbance 02F developed during December 16, about 360 km (225 mi) northeast of Niue; however, the system was last noted during the next day, as it was suspected to have become an extratropical cyclone.[41][42]
Late on January 27, RSMC Nadi reported that Tropical Disturbance 08F had developed about 275 km (170 mi) to the southeast of Apia, Samoa.[43]
On February 2, RSMC Nadi reported that Tropical Disturbance 10F had developed about 680 km (425 mi) to the northeast of Suva, Fiji.[44] Over the next day the system moved south-eastwards in an area of low to moderate vertical windshear, before it was last noted during February 4, after the low level circulation centre had become exposed.[45] Tropical Disturbance 13F developed within an area of low vertical windshear, to the north of the island of Papeete on the French Polynesian island of Tahiti during March 19.[23] Over the next few days the system the system moved westwards and remained poorly organised, with atmospheric convection persistent over the systems supposed low level circulation centre.[23][46] The system was subsequently last noted during March 21, while it was located to the north of Rarotonga in the Southern Cook Islands.[46] During April 15, RSMC Nadi reported that Tropical Depression 16F, had developed about 450 km (280 mi) to the northwest of Port Vila, Vanuatu.[47] During that day the system moved westwards and was last noted as it moved into the Australian region during April 16.[48] During May 12, the BoM started to monitor a westward-moving tropical low that had developed near the Solomon Islands, before it moved out of the basin during the next day.[49][50]
After the season had ended, researchers identified that a possible subtropical or tropical cyclone, had existed to the northeast of Easter Island between April 29 – May 4 and unofficially named it Katie.[51] The system originated within a frontal zone during the later part of April, before it developed into a nonfrontal system during April 29.[51] At this time the majority of atmospheric convection associated with the system was located to the southeast of its low level circulation centre.[51] Over the next couple of days, the system moved south-eastwards and gradually developed further, before it developed into a subtropical storm during May 1.[51] The system subsequently moved north-westwards and degenerated into a remnant low on May 4, before it dissipated during May 6.[51]
Season effects[]
This table lists all the storms that developed in the South Pacific to the east of longitude 160°E during the 2014–15 season. It includes their intensity on the Australian tropical cyclone intensity scale, duration, name, landfalls, deaths, and damages. All data is taken from RSMC Nadi and/or TCWC Wellington, and all of the damage figures are in 2014 USD.
| Name | Dates active | Peak classification | Sustained wind speeds |
Pressure | Areas affected | Damage (USD) |
Deaths | Refs |
|---|---|---|---|---|---|---|---|---|
| 01F | November 21–26 | Tropical depression | Not specified | 1,003 hPa (29.62 inHg) | Tokelau, Tuvalu, Wallis and Futuna, Samoan Islands |
Minimal | None | |
| 02F | December 16–17 | Tropical disturbance | Not specified | 1,007 hPa (29.74 inHg) | None | None | None | |
| 03F | December 20–26 | Tropical depression | 55 km/h (35 mph) | 998 hPa (29.47 inHg) | Cook Islands | None | None | |
| 04F | December 21–24 | Tropical depression | Not specified | 1,000 hPa (29.53 inHg) | French Polynesia | None | None | |
| 05F | December 23–29 | Tropical depression | Not specified | 1,000 hPa (29.53 inHg) | Samoan Islands | None | None | |
| Niko | January 19–25 | Category 2 tropical cyclone | 100 km/h (60 mph) | 982 hPa (29.00 inHg) | French Polynesia | Minimal | None | |
| 08F | January 27–30 | Tropical disturbance | Not specified | 1,000 hPa (29.53 inHg) | Wallis and Futuna, Samoan Islands | None | None | |
| Ola | January 29 – February 3 | Category 3 severe tropical cyclone | 150 km/h (95 mph) | 955 hPa (28.20 inHg) | New Caledonia, Lord Howe Island | None | None | |
| 10F | February 2–4 | Tropical disturbance | Not specified | 1,001 hPa (29.56 inHg) | Tuvalu | None | None | |
| Pam | March 6–15 | Category 5 severe tropical cyclone | 250 km/h (155 mph) | 896 hPa (26.46 inHg) | Fiji, Kiribati, Solomon Islands, Tuvalu Vanuatu, New Caledonia, New Zealand |
$692 million | 15 | |
| Reuben | March 19–23 | Category 1 tropical cyclone | 75 km/h (45 mph) | 990 hPa (29.23 inHg) | Fiji, Tonga | None | None | [25] |
| 13F | March 19–21 | Tropical disturbance | Not specified | 1,004 hPa (29.65 inHg) | French Polynesia | None | None | |
| 14F | March 28–31 | Tropical depression | 55 km/h (35 mph) | 998 hPa (29.47 inHg) | Southern Cook Islands | None | None | |
| Solo | April 9–12 | Category 2 tropical cyclone | 100 km/h (60 mph) | 985 hPa (29.09 inHg) | Solomon Islands, New Caledonia | Unknown | None | [28] |
| 16F | April 15–16 | Tropical depression | Not specified | 1,008 hPa (29.77 inHg) | None | None | None | |
| Raquel | June 28 – July 4 | Category 1 tropical cyclone | 75 km/h (45 mph) | 998 hPa (29.47 inHg) | Solomon Islands | Minimal | 1 | |
| Season aggregates | ||||||||
| 17 systems | November 21 – July 4 | 250 km/h (155 mph) | 896 hPa (26.46 inHg) | $692 million | 16 | |||
See also[]
- Tropical cyclones in 2014 and 2015
- List of South Pacific cyclone seasons
- Atlantic hurricane seasons: 2014, 2015
- Pacific hurricane seasons: 2014, 2015
- Pacific typhoon seasons: 2014, 2015
- North Indian Ocean cyclone seasons: 2014, 2015
- 2014–15 South-West Indian Ocean cyclone season
- 2014–15 Australian region cyclone season
- 2017–18 South Pacific cyclone season
- South Atlantic tropical cyclone
- Subtropical Cyclone Katie
References[]
- ^ Jump up to: a b Climate Services Division; RSMC Nadi — Tropical Cyclone Centre (October 26, 2010). Tropical Cyclone Guidance for Season 2010/11 for the Fiji and the Southwest Pacific (PDF) (Report). Fiji Meteorological Service. Archived from the original (PDF) on February 27, 2012. Retrieved July 10, 2012.
- ^ Jump up to: a b c d e f g h i j k l RSMC Nadi – Tropical Cyclone Centre (October 15, 2014). "2014/15 Tropical Cyclone Season Outlook in the Regional Specialised Meteorological Centre Nadi – Tropical Cyclone Centre Area of Responsibility" (PDF). Fiji Meteorological Service. p. 2. Archived (PDF) from the original on October 27, 2014. Retrieved October 27, 2014.
- ^ Jump up to: a b c d e f g h i j "Southwest Pacific Tropical Cyclone Outlook: Near average tropical cyclone numbers for the region is likely, with increased activity from February onward". National Institute of Water and Atmospheric Research. October 15, 2014. Retrieved October 22, 2014.
- ^ Jump up to: a b c d e f g "Southwest Pacific Tropical Cyclone Outlook Update". National Institute of Water and Atmospheric Research. February 9, 2015. Archived from the original on March 18, 2015. Retrieved March 18, 2015.
- ^ Jump up to: a b c d e National Climate Centre (October 15, 2014). "2014–2015 South Pacific Tropical Cyclone Season Outlook". Australian Bureau of Meteorology. Archived from the original on October 16, 2013. Retrieved October 15, 2014.
- ^ Jump up to: a b c Kean, Francis (October 24, 2014). "Moderate Chances For Tropical Cyclones This Season In Fiji" (PDF) (Press release). Fiji Meteorological Service. Archived (PDF) from the original on October 27, 2014. Retrieved October 27, 2014.
- ^ RSMC Nadi — Tropical Cyclone Centre (November 21, 2014). "Tropical Disturbance Summary November 21, 2014 06z". Fiji Meteorological Service. Archived from the original on November 21, 2014. Retrieved November 21, 2014.
- ^ RSMC Nadi — Tropical Cyclone Centre (December 20, 2014). "Tropical Disturbance Summary December 20, 2014 21z". Fiji Meteorological Service. Archived from the original on December 25, 2014. Retrieved December 25, 2014.
- ^ Jump up to: a b RSMC Nadi — Tropical Cyclone Centre (December 23, 2014). "Tropical Disturbance Summary December 23, 2014 23z". Fiji Meteorological Service. Archived from the original on December 24, 2014. Retrieved February 10, 2017.
- ^ https://www.webcitation.org/6V51FdjDG?url=http://gwydir.demon.co.uk/advisories/ABPW10-PGTW_201412232000.htm
- ^ Jump up to: a b RSMC Nadi — Tropical Cyclone Centre (January 19, 2015). "Tropical Disturbance Summary January 19, 2015 23z". Fiji Meteorological Service. Archived from the original on December 25, 2014. Retrieved January 21, 2015.
- ^ Joint Typhoon Warning Center (January 20, 2015). "Significant Tropical Weather Outlook for the Western and South Pacific Ocean January 20, 2015 12z". United States Navy, United States Airforce. Archived from the original on January 21, 2015. Retrieved January 21, 2015.
- ^ Jump up to: a b RSMC Nadi — Tropical Cyclone Centre (January 29, 2015). "Tropical Disturbance Advisory January 29, 2015 12z". Fiji Meteorological Service. Archived from the original on January 31, 2015. Retrieved January 29, 2015.
- ^ RSMC Nadi — Tropical Cyclone Centre (March 6, 2015). "Tropical Disturbance Summary March 6, 2015 09z". Fiji Meteorological Service. Archived from the original on March 7, 2015. Retrieved March 13, 2015.
- ^ "Tropical Depression 11F from RSMC". RSMC Nadi. Archived from the original on 8 March 2015. Retrieved 16 March 2015.
- ^ "TCFA from WTPS21". Joint Typhoon Warning Center. Retrieved 16 March 2015.
- ^ "Cyclone Pam hits New Zealand". Al Jazeera. Retrieved 16 March 2015.
- ^ Joint Typhoon Warning Center (March 13, 2015). "Tropical Cyclone 17P (Pam) Warning NR 016". Pearl Harbor, Hawaii: United States Naval Meteorology and Oceanography Command. Archived from the original on March 15, 2015. Retrieved March 15, 2015.
- ^ Joshua Robertson (March 15, 2015). "Cyclone Pam: Vanuatu awaits first wave of relief and news from worst-hit islands". The Guardian. Retrieved March 15, 2015.
- ^ Nadi Regional Specialized Meteorological Center (March 13, 2015). "Tropical Disturbance Advisory Number A25". Nadi, Fiji: Fiji Meteorological Service. Archived from the original on March 15, 2015. Retrieved March 15, 2015.
- ^ Nadi Regional Specialized Meteorological Center (March 14, 2015). "Tropical Disturbance Advisory Number A27". Nadi, Fiji: Fiji Meteorological Service. Archived from the original on March 15, 2015. Retrieved March 15, 2015.
- ^ Joint Typhoon Warning Center (March 15, 2015). "Tropical Cyclone 17P (Pam) Warning NR 021". Pearl Harbor, Hawaii: United States Naval Meteorology and Oceanography Command. Archived from the original on March 15, 2015. Retrieved March 15, 2015.
- ^ Jump up to: a b c RSMC Nadi — Tropical Cyclone Centre (March 19, 2015). "Tropical Disturbance Summary March 19, 2015 09z". Fiji Meteorological Service. Archived from the original on March 20, 2015. Retrieved March 22, 2015.
- ^ Noble, Chris (March 19, 2015). "Tropical Cyclone Reuben". Meteorological Service of New Zealand. Archived from the original on 2015-03-22. Retrieved March 22, 2015.
- ^ Jump up to: a b Climate Services Division (April 15, 2015). Fiji Climate Summary: March 2015 Volume 36: Issue 3 (PDF) (Report). Fiji Meteorological Service. Archived from the original (PDF) on April 15, 2015. Retrieved April 15, 2015.
- ^ RSMC Nadi — Tropical Cyclone Centre (March 31, 2015). "Gale Warning 052: March 31, 2015 00z". Fiji Meteorological Service. Archived from the original on March 31, 2015. Retrieved September 15, 2015.
- ^ Jump up to: a b RSMC Nadi — Tropical Cyclone Centre (April 9, 2015). "Tropical Disturbance Summary April 9, 2015 18z". Fiji Meteorological Service. Archived from the original on April 10, 2015. Retrieved April 19, 2015.
- ^ Jump up to: a b c d e f "SOLO: bilan provisoire" (in French). Météo-France: Nouvelle-Calédonie. April 2015. Archived from the original on September 15, 2015. Retrieved September 15, 2015.
- ^ Jump up to: a b "Tropical Cyclone Formation Alert Disturbance Summary April 9, 2015 18z". United States Joint Typhoon Warning Center. April 9, 2015. Archived from the original on April 10, 2015. Retrieved September 15, 2015.
- ^ Jump up to: a b c "Tropical Cyclone 23P Warning 1 April 10, 2015 03z". United States Joint Typhoon Warning Center. April 10, 2015. Archived from the original on April 10, 2015. Retrieved September 15, 2015.
- ^ Jump up to: a b c Climate Services Division (September 30, 2015). Fiji Annual Climate Summary: 2015 (PDF) (Report). Fiji Meteorological Service. Archived from the original (PDF) on October 21, 2016. Retrieved October 21, 2016.
- ^ RSMC Nadi — Tropical Cyclone Centre (April 11, 2015). "Tropical Disturbance Advisory April 11, 2015 00z". Fiji Meteorological Service. Archived from the original on April 11, 2015. Retrieved April 19, 2015.
- ^ Jump up to: a b "Tropical Cyclone 23P Warning 3 April 11, 2015 03z". United States Joint Typhoon Warning Center. April 11, 2015. Archived from the original on April 11, 2015. Retrieved September 15, 2015.
- ^ Solomon Islands Country Report (PDF). RA V Tropical Cyclone Committee – 16th Session. Archived (PDF) from the original on October 21, 2016.
- ^ Jump up to: a b "The Australian Tropical Cyclone Database" (CSV). Australian Bureau of Meteorology. A guide on how to read the database is available here.
- ^ RSMC Nadi — Tropical Cyclone Centre (June 28, 2015). "Tropical Disturbance Summary June 28, 2015 03z". Fiji Meteorological Service. Archived from the original on June 28, 2015. Retrieved July 25, 2015.
- ^ Young, Steve (July 27, 2015). "Monthly Global Tropical Cyclone Tracks: June 2015". Australian Severe Weather. Archived from the original on August 1, 2015. Retrieved August 2, 2015.
- ^ "Tropical Cyclone Technical Bulletin: Australia: Eastern Region: June 30, 2015 18z". Australian Bureau of Meteorology. June 30, 2015. Archived from the original on July 2, 2015. Retrieved July 25, 2015.
- ^ Jump up to: a b Queensland Regional Office (2015). Tropical Cyclone Raquel (Report). Australian Bureau of Meteorology. Archived from the original on September 10, 2015. Retrieved September 11, 2015.
- ^ Young, Steve (July 27, 2015). "Monthly Global Tropical Cyclone Tracks: June 2015". Australian Severe Weather. Archived from the original on August 1, 2015. Retrieved August 2, 2015.
- ^ RSMC Nadi — Tropical Cyclone Centre (December 16, 2014). "Tropical Disturbance Summary December 16, 2014 21z". Fiji Meteorological Service. Archived from the original on December 25, 2014. Retrieved October 10, 2015.
- ^ RSMC Nadi — Tropical Cyclone Centre (December 17, 2014). "Tropical Disturbance Summary December 17, 2014 06z". Fiji Meteorological Service. Archived from the original on December 25, 2014. Retrieved December 17, 2014.
- ^ RSMC Nadi — Tropical Cyclone Centre (January 27, 2015). "Tropical Disturbance Summary January 27, 2015 23z". Fiji Meteorological Service. Archived from the original on January 28, 2015. Retrieved January 30, 2015.
- ^ RSMC Nadi — Tropical Cyclone Centre (February 2, 2015). "Tropical Disturbance Summary February 2, 2015 06z". Fiji Meteorological Service. Archived from the original on February 3, 2015. Retrieved February 12, 2015.
- ^ RSMC Nadi — Tropical Cyclone Centre (February 4, 2015). "Tropical Disturbance Summary February 4, 2015 00z". Fiji Meteorological Service. Archived from the original on February 4, 2015. Retrieved February 12, 2015.
- ^ Jump up to: a b RSMC Nadi — Tropical Cyclone Centre (March 21, 2015). "Tropical Disturbance Summary March 21, 2015 22z". Fiji Meteorological Service. Archived from the original on March 21, 2015. Retrieved March 22, 2015.
- ^ RSMC Nadi — Tropical Cyclone Centre (April 15, 2015). "Tropical Disturbance Summary April 15, 2015 09z". Fiji Meteorological Service. Archived from the original on April 16, 2015. Retrieved April 16, 2015.
- ^ RSMC Nadi — Tropical Cyclone Centre (April 16, 2015). "Tropical Weather Outlook April 16, 2015 03z" (PDF). Fiji Meteorological Service. Archived from the original (PDF) on April 16, 2015. Retrieved April 16, 2015.
- ^ "Tropical Cyclone Outlook for the Coral Sea, May 12, 2015". Australian Bureau of Meteorology. May 12, 2015. Archived from the original on May 14, 2015. Retrieved May 14, 2015.
- ^ "Tropical Cyclone Outlook for the Coral Sea, May 13, 2015". Australian Bureau of Meteorology. May 13, 2015. Archived from the original on May 14, 2015. Retrieved November 18, 2015.
- ^ Jump up to: a b c d e Young, Steven H (August 2016). Blunden, J; D. S. Arndt (eds.). "State of the Climate in 2015". Bulletin of the American Meteorological Society. 97 (8): 149–150. Bibcode:2016BAMS...97.....B. doi:10.1175/2016BAMSStateoftheClimate.1.
External links[]
| Wikimedia Commons has media related to 2014-15 South Pacific cyclone season. |
- World Meteorological Organization
- Australian Bureau of Meteorology
- Fiji Meteorological Service
- New Zealand MetService
- Joint Typhoon Warning Center
| show Tropical cyclones of the 2014–15 South Pacific cyclone season |
|---|

- 2014–15 South Pacific cyclone season
- South Pacific cyclone seasons
- Tropical cyclones in 2014
- Tropical cyclones in 2015