2015 Cheshire West and Chester Council election
| |||||||||||||||||||||||||||||||||||||||||||||||||||||||||||||||||||||||
All 75 seats to Cheshire West and Chester Council 38 seats needed for a majority | |||||||||||||||||||||||||||||||||||||||||||||||||||||||||||||||||||||||
|---|---|---|---|---|---|---|---|---|---|---|---|---|---|---|---|---|---|---|---|---|---|---|---|---|---|---|---|---|---|---|---|---|---|---|---|---|---|---|---|---|---|---|---|---|---|---|---|---|---|---|---|---|---|---|---|---|---|---|---|---|---|---|---|---|---|---|---|---|---|---|---|
| Turnout | 68.2% ( | ||||||||||||||||||||||||||||||||||||||||||||||||||||||||||||||||||||||
| |||||||||||||||||||||||||||||||||||||||||||||||||||||||||||||||||||||||
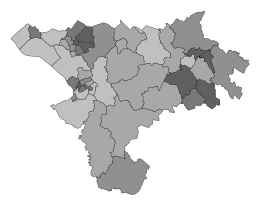
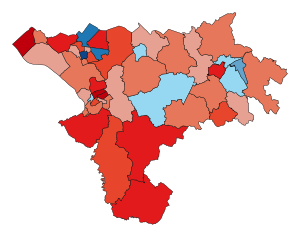
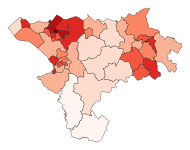
 Colours denote winning party. Striped wards have mixed representation. | |||||||||||||||||||||||||||||||||||||||||||||||||||||||||||||||||||||||
| |||||||||||||||||||||||||||||||||||||||||||||||||||||||||||||||||||||||
The 2015 Cheshire West and Chester Council election took place on 7 May 2015, electing members of Cheshire West and Chester Council in England.[1] This was on the same day as other local elections across the country as well as the general election.
All 75 seats were contested. Labour won a small majority with a total of 38 seats on a 3.2% swing from the Conservatives,[2] meaning that the council moved from Conservative control to Labour control.
Cheshire West and Chester was the only council to change hands in this way in the 2015 elections,[3] and this unique result has been variously attributed to public dissatisfaction with fracking in the area,[4][5][6] local planning issues,[4] the organisation and leadership of the local parties,[2][7][8][9] and to a generally difficult climate for Conservatives in the area.[8] In addition, the only Liberal Democrat (Lib Dem) seat on the council was lost, while an independent was elected to the Parkgate ward. No other minor party won a seat, but both the Green Party and United Kingdom Independence Party (UKIP) fielded large numbers of candidates and saw significant positive swings. Labour's Samantha Dixon became the first woman to lead the council, while the previous leader Mike Jones survived a Conservative leadership challenge and became Leader of the Opposition.
Background[]
Cheshire West and Chester (CWaC) had been governed since its formation in 2009 by the Conservative Party.[10] However, the Conservatives lost seats in CWaC against the national trend at the 2011 local election,[11] and the Chester area was identified by The Economist before the election as a challenging area for the party.[12] The election also took place at an especially bad period nationally for the Liberal Democrats, who lost 310 councillors in England at the previous local elections,[13][14] and at a period of growth for other minor parties – especially UKIP, who won the CWaC council area in the 2014 European Parliament elections and were identified by the BBC as potential spoiler candidates.[10] Although there were several by-elections in the 2011-2015 term,[15][16] the number of councillors representing each party did not change over the course of the Council.
In total, there were 75 Conservative candidates, 75 Labour candidates, 45 Green candidates, 43 Liberal Democrat candidates, 33 UKIP candidates, 4 TUSC candidates, 1 Socialist Labour candidate and 9 candidates running as independents.[17] Of the incumbents, 14 did not seek re-election, including several parliamentary candidates:[5] Bob Thompson, formerly the only Lib Dem on the council, stood for Parliament in City of Chester;[18] the former Labour councillor Julia Tickridge stood in Weaver Vale;[19] and Justin Madders, previous leader of the Labour group, stood in and was elected to Ellesmere Port and Neston.[20]
Election proceedings[]
The Statement of Persons Nominated was published on Friday 10 April 2015.[21] The election took place on 7 May 2015, on the same day as the general election, various parish council elections, town council elections in Frodsham, Neston, Northwich and Winsford, and a referendum on town planning in Malpas.[22] As is standard for council elections in England, first-past-the-post voting was used in single seat wards, and block voting was used in multi-seat wards. All 75 seats on the CWaC council were up for election. Of around 34,000 postal ballots issued, about 1,300 papers for Frodsham and the Garden Quarter district of Chester were voided and re-issued due to a printing error that removed the party emblems of some candidates,[23] and 284 were not delivered in time for the election.[24] An attack leaflet targeted at Labour leader Samantha Dixon was distributed to Chester city centre residents on the day of the election which lacked printing details and may have contained "incorrect information", in violation of the Representation of the People Act 1983.[25] Cheshire Police confirmed that they were investigating the leaflet.[25]
The count for the parliamentary election to City of Chester took priority, and so the count for CWaC began on at 2 PM, 8 May.[22][26] The count took place at , and ended up running through the whole of the allotted 9-hour day without a decisive result.[5] The count was suspended on a "cliffhanger", with Labour and the Conservatives tied at 36 seats each after a recount was called on the two decisive two-seat ward of the Newton.[5] The count resumed on 9 May, and after a quick "bundle recount" suggested a Labour lead, the Conservative Party asked for a full recount, lasting another three and a half hours.[27] The second recount revealed that Labour's Gill Watson led by 34 votes over the incumbent Adrian Walmsley in the final seat.[5][27] The final result was delivered at 5.30 PM on 9 May 2015 after 14 hours of counting.[28]
Vote share
Seats
The final results saw the Conservatives retain the largest share of the popular vote, but with a smaller proportion than at the previous election. Labour gained 6 seats (5 from Conservative, 1 from Lib Dem), the Conservatives lost 6 seats (5 to Labour, 1 to independent) and the Lib Dems lost their only seat in Hoole to Labour.[6] Labour therefore won an absolute majority, with 38 seats to the Conservatives 36 on the 75 seat council.[3] This made CWaC the only council in the entire country to transfer from Conservative to Labour control at the 2015 elections,[a] a result that was described by ConservativeHome as a "catastrophic loss"[9] and by the Chester Chronicle as "deeply embarrassing" for the local Conservative party.[3][6][36]
No minor parties won any seats, but UKIP and the Greens saw large positive swings both across the borough and in individual wards, including a 9% swing to UKIP in Blacon[37] and a 17.5% swing to the Greens in Garden Quarter where they finished second.[26]
| Political party | Group leader | Candidates | Total votes |
Total seats |
Seats gained |
Seats lost |
Seats, net change |
Seats, of total (%) |
Votes, of total (%) |
Total votes, change (%) | |
|---|---|---|---|---|---|---|---|---|---|---|---|
| Conservative | Mike Jones | 75 | 68,580 | 36 | 0 | 6 | 48.0 | 36.7 | |||
| Labour | Samantha Dixon | 75 | 64,996 | 38 | 6 | 0 | 50.7 | 34.7 | |||
| Liberal Democrats | Bob Thompson (outgoing)[i] | 43 | 18,273 | 0 | 0 | 1 | 0.0 | 9.8 | |||
| UKIP | N/A | 33 | 17,240 | 0 | 0 | 0 | 0.0 | 9.2 | |||
| Green | N/A | 45 | 11,867 | 0 | 0 | 0 | 0.0 | 6.3 | |||
| Independent | N/A[ii] | 9 | 5,627 | 1 | 1 | 0 | 1.3 | 3.0 | |||
| Socialist Labour | N/A | 1 | 286 | 0 | 0 | 0 | 0.0 | 0.2 | |||
| TUSC | N/A | 4 | 184 | 0 | 0 | 0 | 0.0 | 0.1 | New | ||
| Total | 285 | 187,053 | 75 | - | - | - | Turnout | 68.2 | - | ||
Seat composition before (top) and after (bottom):
| 42 | 32 | 1 |
| Conservative | Labour | LD |
| 38 | 36 | 1 |
| Labour | Conservative | I |
In all, there were 22 new councillors to CWaC council – 12 from Labour, 9 from the Conservatives and one independent.[27] Local Labour leader Samantha Dixon became the council leader, making her the first woman to hold the role,[7] while former council leader Mike Jones remained leader of the Conservative group despite a leadership challenge.[36]
Following the election, the first council meeting under Labour control took place on 21 May 2015.[39] The new administration significantly restructured the council: the existing scrutiny committees were merged while new local committees were established for Chester, Ellesmere Port, Northwich and Winslow, and rural Cheshire, and the roles of Lord Mayor of Chester and Chair of the Council were separated.[39] This meant that the casting vote remained with former Lord Mayor, Bob Rudd (Labour), instead of the new Lord Mayor, Hugo Deynem (Conservative), which Conservatives criticized for politicizing the role.[39] The new overview and scrutiny committee was arranged on a nonpartisan basis, with equal numbers of Labour and Conservative members and the casting vote given to the independent Martin Barker.[39]
Reactions and analysis[]

As leader of the only Labour group to take control of a former Conservative council at the elections, Samantha Dixon described her local party as "a little ray of hope in the North West" but warned that it would be difficult to operate Labour policies under a national Conservative majority government, and proposed a more consensual cross-party approach to running the council.[6][7] The outgoing Conservative leader, Mike Jones, suggested that a Labour majority of just one would decrease private sector confidence in the council.[7][36]
Fracking was noted by both the Chester Chronicle and BBC News as a politically hot topic in Cheshire, particularly around Upton where one gas company had planning permission for a drilling site,[40][41] and the Conservative loss was partly attributed to community fears about the practice.[4][6] Matt Bryan, an anti-fracking Labour candidate in Upton unseated the sitting Conservative councillor in what the Chester Chronicle described as arguably "the biggest poll shock".[5] The Labour MP for City of Chester, Chris Matheson, who had similarly defeated the incumbent Stephen Mosley against the national trend, described unhappiness with fracking planning permission procedures and planning more generally as key issues that had helped Labour locally.[4]
The loss of the safe Conservative seat of Parkgate to the independent Martin Barker was also described as a "surprise" by .[42] Barker stood on a platform of localism for Parkgate and his victory was attributed by the site to dissatisfaction with the choice of Conservative candidate, who lived outside Parkgate in Mickle Trafford.[42][43]
On taking office, Dixon credited the result to a "positive campaign" by the Labour Party rather than any mistakes by the Conservative Party.[7] However, Private Eye's "Rotten Boroughs" column blamed "own goals" by Jones – such as removing the planning committee chairperson[44] and withdrawing the party whip from councillors who voted against developments that Jones supported,[45] insulting members of the public,[46] and removing a respect clause from the council constitution[47] – for having "handed victory to Labour".[2][8] There was similar criticism from ConservativeHome, whose correspondent accused Jones of behaving "in a way which allowed our opponents to paint us as dodgy, or even corrupt",[9] and from councillor Mark Stocks, who launched an unsuccessful leadership challenge against Jones, saying:
"As the only council in the entire country to make the transition from Conservative to Labour, someone has to take the responsibility for what must be considered a monumental defeat. This responsibility has to start at the top. For me, it is an unavoidable belief that with proper leadership, Cheshire West and Chester would have followed the national trend and remained under Conservative control."[8]
Jones, supported by other Conservative councillors, rejected this suggestion, noting the fact that the local Conservative Party had taken the largest share of the popular vote at the council election and retained the parliamentary seat of Weaver Vale against opinion poll predictions. When looked at this way, Jones said, the result "does not seem like a catastrophe".[8]
Results[]
Councillor changes[]
|
Seat changes[]
|
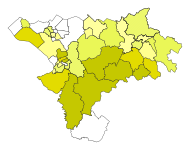
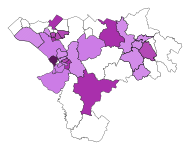
Results by ward[]
- Vote share by ward
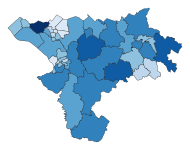
Conservative vote share by ward
Labour vote share by ward
Lib Dem vote share by ward

Green vote share by ward
UKIP vote share by ward

Independent and other vote share by ward


| Ward | Turnout (%) |
|---|---|
| Blacon | 61.2 |
| Boughton | 63.0 |
| Chester City | 63.5 |
| Chester Villages | 78.0 |
| Davenham and Moulton | 70.4 |
| Dodleston and Huntington | 77.3 |
| Ellesmere Port Town | 55.7 |
| Elton | 66.2 |
| Farndon | 74.5 |
| Frodsham | 71.4 |
| Garden Quarter | 58.6 |
| Gowy | 74.3 |
| Grange | 57.0 |
| Great Boughton | 76.1 |
| Handbridge Park | 76.0 |
| Hartford and Greenbank | 75.1 |
| Helsby | 73.5 |
| Hoole | 71.9 |
| Kingsley | 76.7 |
| Lache | 65.3 |
| Ledsham and Manor | 73.4 |
| Little Neston and Burton | 76.1 |
| Malpas | 70.0 |
| Marbury | 68.9 |
| Neston | 63.7 |
| Netherpool | 61.9 |
| Newton | 69.2 |
| Parkgate | 77.1 |
| Rossmore | 59.3 |
| Saughall and Mollington | 75.3 |
| Shakerley | 65.4 |
| St Paul's | 65.7 |
| Strawberry | 73.6 |
| Sutton | 67.2 |
| Tarporley | 75.0 |
| Tarvin and Kelsall | 73.7 |
| Tattenhall | 74.3 |
| Upton | 71.5 |
| Weaver and Cuddington | 71.3 |
Blacon[]
| Party | Candidate | Votes | % | ||
|---|---|---|---|---|---|
| Labour | Jones, Reginald Francis | 3,579 | 21.07 | ||
| Labour | Nelson, Marie | 3,349 | 19.72 | ||
| Labour | Gahan, Carol Margaret | 3,119 | 18.36 | ||
| Conservative | Dunn, Christian Philip | 1,109 | 6.53 | ||
| UKIP | Ingram, Steve | 1,054 | 6.21 | ||
| UKIP | Erskine, Chris | 1,037 | 6.11 | ||
| Conservative | Roberts, Alexander Edward | 979 | 5.76 | ||
| Conservative | Jackson, Jack Alex | 941 | 5.54 | ||
| UKIP | Hutchison, Liz | 805 | 4.74 | ||
| Green | Watson, Christine | 482 | 2.84 | ||
| Green | Gorzelak, Zoe Marie | 303 | 1.78 | ||
| Green | Watson, Colin Drysdale | 227 | 1.34 | ||
| Turnout | 6,295 | 61.2[48] | |||
| Labour hold | |||||
| Labour hold | |||||
| Labour hold | |||||
Boughton[]
| Party | Candidate | Votes | % | ||
|---|---|---|---|---|---|
| Labour | Delaney, Martyn | 1,308 | 46.53 | ||
| Conservative | Vaughan, Kate Elizabeth | 933 | 33.19 | ||
| Green | Parkes, Allison Clare | 308 | 10.96 | ||
| UKIP | Nichols, Stephen Carter | 262 | 9.32 | ||
| Turnout | 2,827 | 63.0 | |||
| Labour hold | |||||
Chester City[]
| Party | Candidate | Votes | % | ||
|---|---|---|---|---|---|
| Labour | Dixon, Samantha Kate | 909 | 47.52 | ||
| Conservative | Dunn, Carlotta Eva | 607 | 31.73 | ||
| Green | Davidson, Andy | 178 | 9.30 | ||
| UKIP | Erskine, Katie | 125 | 6.53 | ||
| Liberal Democrats | McGlinchey, Noel | 94 | 4.91 | ||
| Turnout | 1,928 | 63.5 | |||
| Labour hold | |||||
Chester Villages[]
| Party | Candidate | Votes | % | ||
|---|---|---|---|---|---|
| Conservative | Parker, Margaret Phyllis | 2,744 | 28.04 | ||
| Conservative | Parker, Stuart | 2,734 | 27.94 | ||
| Labour | Davies, Steve | 1,241 | 12.68 | ||
| Labour | Rudd, Sandra | 1,019 | 10.41 | ||
| Liberal Democrats | Hopkinson, Ian | 587 | 6.00 | ||
| UKIP | Rees, Paul | 585 | 5.98 | ||
| Green | D'Arcy, Paula Irene | 536 | 5.48 | ||
| Green | Burling, Darren James | 341 | 3.48 | ||
| Turnout | 5,430 | 78.0 | |||
| Conservative hold | |||||
| Conservative hold | |||||
Davenham and Moulton[]
| Party | Candidate | Votes | % | ||
|---|---|---|---|---|---|
| Conservative | Weltman, Helen Catherine | 3,283 | 17.52 | ||
| Conservative | Pearson, James | 3,262 | 17.41 | ||
| Conservative | Sinar, Gaynor Jean | 2,971 | 15.86 | ||
| Labour | Cooper, Rebecca | 2,417 | 12.90 | ||
| Labour | Cooper, Andrew Graham | 2,316 | 12.36 | ||
| Labour | McGregor, Kyle | 1,796 | 9.59 | ||
| UKIP | McDonald, Simon Gerald | 1,040 | 5.55 | ||
| UKIP | Roberts, Glyn | 854 | 4.56 | ||
| Liberal Democrats | Gaskill, Pamela Joyce | 798 | 4.26 | ||
| Turnout | 7,421 | 70.4 | |||
| Conservative hold | |||||
| Conservative hold | |||||
| Conservative hold | |||||
Dodleston and Huntington[]
| Party | Candidate | Votes | % | ||
|---|---|---|---|---|---|
| Conservative | Williams, Mark Graham | 1,439 | 52.65 | ||
| Labour | Creswick, Jacky | 717 | 26.23 | ||
| Liberal Democrats | Ward, Christopher John | 321 | 11.75 | ||
| UKIP | Evans, David S | 256 | 9.37 | ||
| Turnout | 2,748 | 77.3 | |||
| Conservative hold | |||||
Ellesmere Port Town[]
| Party | Candidate | Votes | % | ||
|---|---|---|---|---|---|
| Labour | Clare, Lynn | 2,386 | 36.03 | ||
| Labour | Crook, Jess | 2,134 | 32.23 | ||
| UKIP | Starkey, Jeanette | 802 | 12.11 | ||
| Conservative | Meldrum, Gordon Douglas | 403 | 6.09 | ||
| Conservative | Pritchard, Graham | 395 | 5.96 | ||
| Green | Boyle, Stefanie Anne | 307 | 4.64 | ||
| Green | Benzie, James Douglas | 195 | 2.94 | ||
| Turnout | 3,759 | 55.7 | |||
| Labour hold | |||||
| Labour hold | |||||
Elton[]
| Party | Candidate | Votes | % | ||
|---|---|---|---|---|---|
| Labour | Smith, Stephen Robert | 1,224 | 53.13 | ||
| Conservative | Heatley, Graham | 1,080 | 46.88 | ||
| Turnout | 2,335 | 66.2 | |||
| Labour gain from Conservative | |||||
Farndon[]
| Party | Candidate | Votes | % | ||
|---|---|---|---|---|---|
| Conservative | Greenwood, Howard | 1,138 | 45.59 | ||
| Liberal Democrats | Roberts, Paul David | 990 | 39.66 | ||
| Labour | Cornwell, Paul Alfred | 244 | 9.78 | ||
| Green | Clement, Alexander James | 124 | 4.97 | ||
| Turnout | 2,504 | 74.5 | |||
| Conservative hold | |||||
Frodsham[]
| Party | Candidate | Votes | % | ||
|---|---|---|---|---|---|
| Conservative | Dawson, Andrew William | 2,456 | 26.08 | ||
| Conservative | Riley, Lynn | 2,178 | 23.13 | ||
| Labour | Garvey, Michael | 1,435 | 15.24 | ||
| Labour | Fletcher, Deborah | 1,305 | 13.86 | ||
| Pusey, Michael John | 493 | 5.24 | |||
| Independent | Reynolds, Tom | 477 | 5.07 | ||
| Green | Pendlebury, Jonny | 421 | 4.47 | ||
| Green | Beesley, Sue | 409 | 4.34 | ||
| Liberal Democrats | Roberts, Vera Sandra | 242 | 2.57 | ||
| Turnout | 5,321 | 71.4 | |||
| Conservative hold | |||||
| Conservative hold | |||||
Garden Quarter[]
| Party | Candidate | Votes | % | |
|---|---|---|---|---|
| Labour | Bob Rudd | 953 | 40.9 | |
| Green | Catherine Green | 802 | 34.5 | |
| Conservative | Ed Longe | 491 | 21.1 | |
| Liberal Democrats | Chris Senior | 82 | 3.5 | |
| Majority | 151 | 6.4 | ||
| Turnout | 2,328 | 58.6 | ||
| Labour hold | ||||
Gowy[]
| Party | Candidate | Votes | % | ||
|---|---|---|---|---|---|
| Conservative | Johnson, Eleanor | 1,367 | 60.97 | ||
| Labour | Dixon, Nick | 367 | 16.37 | ||
| UKIP | Davies, Mandie | 211 | 9.41 | ||
| Green | Mitchell, Steven | 151 | 6.74 | ||
| Liberal Democrats | Jones, Trevor Glyn | 146 | 6.51 | ||
| Turnout | 2,446 | 74.3 | |||
| Conservative hold | |||||
Grange[]
| Party | Candidate | Votes | % | ||
|---|---|---|---|---|---|
| Labour | Sherlock, Tony | 1,545 | 79.43 | ||
| Conservative | Eardley, Simon James Vernon | 269 | 13.83 | ||
| Green | Isaac, Ged | 131 | 6.74 | ||
| Turnout | 1,962 | 57.0 | |||
| Labour hold | |||||
Great Boughton[]
| Party | Candidate | Votes | % | ||
|---|---|---|---|---|---|
| Conservative | Board, Keith William Edward | 2,191 | 21.62 | ||
| Conservative | Hall, Pamela Theresa | 2,153 | 21.24 | ||
| Labour | Creswick, John | 1,464 | 14.44 | ||
| Labour | Bradshaw, Lee | 1,373 | 13.55 | ||
| Liberal Democrats | Price, Rose | 909 | 8.97 | ||
| UKIP | Cowley, Harry | 652 | 6.43 | ||
| UKIP | Lowe, Peter James | 597 | 5.89 | ||
| Green | Hannay, Philip | 407 | 4.02 | ||
| Green | Weaver, Graham John | 390 | 3.85 | ||
| Turnout | 5,581 | 76.1 | |||
| Conservative hold | |||||
| Conservative hold | |||||
Handbridge Park[]
| Party | Candidate | Votes | % | ||
|---|---|---|---|---|---|
| Conservative | Daniels, Razia | 2,852 | 26.88 | ||
| Conservative | Sullivan, Neil Anthony | 2,558 | 24.11 | ||
| Labour | Freeman, Jim | 1,438 | 13.55 | ||
| Labour | McGuirk, Pat | 1,400 | 13.20 | ||
| Green | Davies, Alexandra Valerie | 679 | 6.40 | ||
| Liberal Democrats | Speirs, Peter James | 546 | 5.15 | ||
| UKIP | Smillie, Fraser | 453 | 4.27 | ||
| UKIP | Weddell, Allan Andrew James | 349 | 3.29 | ||
| Green | Leeson, Dominic | 335 | 3.16 | ||
| Turnout | 5,684 | 76.0 | |||
| Conservative hold | |||||
| Conservative hold | |||||
Hartford and Greenbank[]
| Party | Candidate | Votes | % | ||
|---|---|---|---|---|---|
| Conservative | Kaur, Susan | 2,496 | 28.09 | ||
| Conservative | Parkes, Patricia Mary | 2,027 | 22.81 | ||
| Labour | Bowden, Derek | 1,288 | 14.49 | ||
| Labour | Naylor, Peter | 1,230 | 13.84 | ||
| UKIP | Loftus, Martin David | 854 | 9.61 | ||
| Liberal Democrats | Jones, Wendy | 519 | 5.84 | ||
| Green | Hardiker, Owen Robert | 472 | 5.31 | ||
| Turnout | 4,958 | 75.1 | |||
| Conservative hold | |||||
| Conservative hold | |||||
Helsby[]
| Party | Candidate | Votes | % | ||
|---|---|---|---|---|---|
| Conservative | McKie, Alan Leonard | 1,511 | 52.10 | ||
| Labour | Long, Una | 1,064 | 36.69 | ||
| Green | Hampton, David | 191 | 6.59 | ||
| Liberal Democrats | Melnyczuk, Valerie A | 134 | 4.62 | ||
| Turnout | 2,934 | 73.5 | |||
| Conservative hold | |||||
Hoole[]
| Party | Candidate | Votes | % | ||
|---|---|---|---|---|---|
| Labour | Black, Alex | 2,215 | 21.45 | ||
| Labour | Chidley, Angie | 1,829 | 17.72 | ||
| Conservative | George, Lesley Elizabeth | 1,190 | 11.53 | ||
| Liberal Democrats | Williams, Mark Andrew | 1,170 | 11.33 | ||
| UKIP | Rogers, Rosemary | 1,149 | 11.13 | ||
| Conservative | Lucas, Aden | 1,051 | 10.18 | ||
| Liberal Democrats | Rollo, Alan | 769 | 7.45 | ||
| Green | Wilderspin-Jones, Diana Mary | 540 | 5.23 | ||
| Green | Jones, Steven Richard | 411 | 3.98 | ||
| Turnout | 5,178 | 71.9 | |||
| Labour gain from Liberal Democrats | |||||
| Labour hold | |||||
Kingsley[]
| Party | Candidate | Votes | % | ||
|---|---|---|---|---|---|
| Conservative | Oultram, Ralph Edward | 1,520 | 55.37 | ||
| Labour | Peacock, Jill | 500 | 18.21 | ||
| UKIP | Proudfoot, Chris | 292 | 10.64 | ||
| Green | Dedman, Alex | 220 | 8.01 | ||
| Liberal Democrats | England, George Martin | 213 | 7.76 | ||
| Turnout | 2,720 | 76.7 | |||
| Conservative hold | |||||
Lache[]
| Party | Candidate | Votes | % | ||
|---|---|---|---|---|---|
| Labour | Mercer, Jane | 1,341 | 52.12 | ||
| Conservative | Tomlinson, Michael | 784 | 30.47 | ||
| UKIP | Stroud, John | 240 | 9.33 | ||
| Green | Smart, Kevin | 119 | 4.62 | ||
| Liberal Democrats | Hassan, Aminul | 89 | 3.46 | ||
| Turnout | 2,586 | 65.3 | |||
| Labour hold | |||||
Ledsham and Manor[]
| Party | Candidate | Votes | % | ||
|---|---|---|---|---|---|
| Labour | Rooney, Peter | 2,004 | 24.07 | ||
| Conservative | Anderson, Gareth | 1,803 | 21.66 | ||
| Conservative | Griffiths, Rob | 1,585 | 19.04 | ||
| Labour | Zaman, Brenda Margaret | 1,581 | 18.99 | ||
| UKIP | Starkey, Jonathan Charles | 659 | 7.92 | ||
| Liberal Democrats | Taylor, Robert Michael | 493 | 5.92 | ||
| Independent | McQuade, Ann | 200 | 2.40 | ||
| Turnout | 4,738 | 73.4 | |||
| Labour hold | |||||
| Conservative hold | |||||
Little Neston and Burton[]
| Party | Candidate | Votes | % | ||
|---|---|---|---|---|---|
| Conservative | Jones, Nige | 2,174 | 21.84 | ||
| Labour | Gittins, Louise Clare | 2,108 | 21.18 | ||
| Conservative | Loch, Kay | 1,961 | 19.70 | ||
| Labour | McHale, Ray | 1,473 | 14.80 | ||
| Liberal Democrats | Cummins, Tony | 853 | 8.57 | ||
| UKIP | Kettle, Sue | 736 | 7.39 | ||
| Liberal Democrats | Farrance, Richard Adam | 544 | 5.46 | ||
| TUSC | Rimmington, Joe | 106 | 1.06 | ||
| Turnout | 5,370 | 76.1 | |||
| Conservative hold | |||||
| Labour hold | |||||
Malpas[]
| Party | Candidate | Votes | % | ||
|---|---|---|---|---|---|
| Conservative | Whitehurst, Chris | 1,241 | 52.01 | ||
| Independent | Lowick Higgie, Charles | 777 | 32.56 | ||
| Labour | Black, Janet | 206 | 8.63 | ||
| Green | Boxall, Michael John | 162 | 6.79 | ||
| Turnout | 2,419 | 70.0 | |||
| Conservative hold | |||||
Marbury[]
| Party | Candidate | Votes | % | ||
|---|---|---|---|---|---|
| Conservative | Gibbon, Lynn Joyce | 3,253 | 20.10 | ||
| Conservative | Wright, Norman Geoffrey | 2,952 | 18.24 | ||
| Conservative | Hammond, Don | 2,898 | 17.90 | ||
| Labour | Dalby, Debbie | 1,886 | 11.65 | ||
| Labour | Morlidge, Jo | 1,698 | 10.49 | ||
| Labour | Falzon, Michael | 1,481 | 9.15 | ||
| Liberal Democrats | Makepeace, Annie | 1,193 | 7.37 | ||
| Green | Ismail, Sez | 826 | 5.10 | ||
| Turnout | 6,580 | 68.9 | |||
| Conservative hold | |||||
| Conservative hold | |||||
| Conservative hold | |||||
Neston[]
| Party | Candidate | Votes | % | ||
|---|---|---|---|---|---|
| Labour | Williams, Andrew | 1,058 | 50.69 | ||
| Conservative | Lloyd, Paul | 693 | 33.21 | ||
| Green | Nicholls, Geoffrey Lane | 161 | 7.71 | ||
| Liberal Democrats | Gaskell, Derek | 140 | 6.71 | ||
| TUSC | Khan, Declan Wells | 35 | 1.68 | ||
| Turnout | 2,097 | 63.7 | |||
| Labour hold | |||||
Netherpool[]
| Party | Candidate | Votes | % | ||
|---|---|---|---|---|---|
| Labour | Roberts, Diane Elizabeth | 1,127 | 66.06 | ||
| Conservative | Harris, Jack | 302 | 17.70 | ||
| UKIP | Kirk, Alistair | 207 | 12.13 | ||
| Green | Sinclair, Kier Aaron | 70 | 4.10 | ||
| Turnout | 1,714 | 61.9 | |||
| Labour hold | |||||
Newton[]
| Party | Candidate | Votes | % | ||
|---|---|---|---|---|---|
| Labour | Beacham, Richard Mark | 2,101 | 19.96 | ||
| Labour | Watson, Gill | 1,672 | 15.88 | ||
| Conservative | Walmsley, Adrian Peter | 1,638 | 15.56 | ||
| Conservative | Brown, Pauline Frances | 1,554 | 14.76 | ||
| Liberal Democrats | Gant, Mark Edward | 827 | 7.86 | ||
| UKIP | Samuel, Frank | 626 | 5.95 | ||
| Green | Brown, Simon Ward | 581 | 5.52 | ||
| Independent | Ebo, John Brian | 505 | 4.80 | ||
| Liberal Democrats | Mead, Annie | 501 | 4.76 | ||
| Green | Horbury, Mary Elizabeth | 477 | 4.53 | ||
| TUSC | Cunningham, Kenny | 46 | 0.44 | ||
| Turnout | 5,460 | 69.2 | |||
| Labour gain from Conservative | |||||
| Labour gain from Conservative | |||||
Parkgate[]
| Party | Candidate | Votes | % | ||
|---|---|---|---|---|---|
| Independent | Barker, Martin | 931 | 39.22 | ||
| Conservative | Merrill, Andrew | 878 | 36.98 | ||
| Labour | Jilani, Abdul Kadir | 314 | 13.23 | ||
| Green | Peers, Oliver James | 251 | 10.57 | ||
| Turnout | 2,411 | 77.1 | |||
| Independent gain from Conservative | |||||
Rossmore[]
| Party | Candidate | Votes | % | ||
|---|---|---|---|---|---|
| Labour | Merrick, Pat | 1,074 | 59.17 | ||
| Conservative | Jones, Linda Ellen | 328 | 18.07 | ||
| Socialist Labour | Spain, Kenny | 286 | 15.76 | ||
| Green | Evans-Stone, Joanne Frances | 127 | 7.00 | ||
| Turnout | 1,831 | 59.3 | |||
| Labour hold | |||||
Saughall and Mollington[]
| Party | Candidate | Votes | % | ||
|---|---|---|---|---|---|
| Conservative | Crowe, Brian | 1,280 | 44.93 | ||
| Independent | Jones, Carl Denis | 737 | 25.87 | ||
| Labour | Atkin, Sally Clare | 572 | 20.08 | ||
| UKIP | Walton, John | 172 | 6.04 | ||
| Liberal Democrats | Senior, Sally Louise | 88 | 3.09 | ||
| Turnout | 2,872 | 75.3 | |||
| Conservative hold | |||||
Shakerley[]
| Party | Candidate | Votes | % | ||
|---|---|---|---|---|---|
| Conservative | Stocks, Mark Lister | 1,414 | 63.95 | ||
| Labour | Jamieson, Philippa | 597 | 27.00 | ||
| Liberal Democrats | Thompson, Mary Elizabeth | 200 | 9.05 | ||
| Turnout | 2,237 | 65.4 | |||
| Conservative hold | |||||
St Paul's[]
| Party | Candidate | Votes | % | ||
|---|---|---|---|---|---|
| Labour | Claydon, Angela Janette | 2,789 | 36.83 | ||
| Labour | Bisset, Robert Ian | 2,286 | 30.19 | ||
| Conservative | Kwateng, Francis | 1,216 | 16.06 | ||
| Conservative | Loch, Steve | 830 | 10.96 | ||
| Liberal Democrats | Handley, Graham | 452 | 5.97 | ||
| Turnout | 4,436 | 65.7 | |||
| Labour hold | |||||
| Labour hold | |||||
Strawberry[]
| Party | Candidate | Votes | % | ||
|---|---|---|---|---|---|
| Labour | Henesy, Mark Anthony | 1,493 | 48.66 | ||
| Conservative | Hebson, Nicholas | 1,155 | 37.65 | ||
| UKIP | Mugridge, Sarah Jane | 377 | 12.29 | ||
| TUSC | Lee, Dan | 43 | 1.40 | ||
| Turnout | 3,082 | 73.6 | |||
| Labour hold | |||||
Sutton[]
| Party | Candidate | Votes | % | ||
|---|---|---|---|---|---|
| Labour | Donovan, Paul Francis | 2,649 | 30.99 | ||
| Labour | Meardon, Nicole | 2,241 | 26.22 | ||
| Conservative | Evans, Sandra | 1,053 | 12.32 | ||
| Conservative | Evans, Lee David | 1,042 | 12.19 | ||
| UKIP | Moore, Alan | 923 | 10.80 | ||
| Green | Joinson, Chloe | 360 | 4.21 | ||
| Liberal Democrats | Handley, Rosemarie | 280 | 3.28 | ||
| Turnout | 4,784 | 67.2 | |||
| Labour hold | |||||
| Labour hold | |||||
Tarporley[]
| Party | Candidate | Votes | % | ||
|---|---|---|---|---|---|
| Conservative | Moore Dutton, Eveleigh | 1,938 | 67.36 | ||
| Liberal Democrats | Priestner, Ian Douglas | 510 | 17.73 | ||
| Labour | Wilson, Carol | 429 | 14.91 | ||
| Turnout | 2,906 | 75.0 | |||
| Conservative hold | |||||
Tarvin and Kelsall[]
| Party | Candidate | Votes | % | ||
|---|---|---|---|---|---|
| Conservative | Leather, John | 2,588 | 29.37 | ||
| Conservative | Deynem, Hugo William Edward | 2,414 | 27.39 | ||
| Liberal Democrats | Lush, Ted | 1,066 | 12.10 | ||
| Liberal Democrats | Hyde, Andrew Paul | 957 | 10.86 | ||
| Labour | Edwards, David | 686 | 7.78 | ||
| Labour | Lewis, Gina | 611 | 6.93 | ||
| Green | McEvoy, Louis | 491 | 5.57 | ||
| Turnout | 5,082 | 73.7 | |||
| Conservative hold | |||||
| Conservative hold | |||||
Tattenhall[]
| Party | Candidate | Votes | % | ||
|---|---|---|---|---|---|
| Conservative | Jones, Mike | 1,414 | 52.23 | ||
| Liberal Democrats | Walley, Edward | 448 | 16.55 | ||
| Labour | Vernon, John Robert | 439 | 16.22 | ||
| UKIP | Hill, Ray | 406 | 15.00 | ||
| Turnout | 2,723 | 74.3 | |||
| Conservative hold | |||||
Upton[]
| Party | Candidate | Votes | % | ||
|---|---|---|---|---|---|
| Conservative | Houlbrook, Jill | 1,956 | 21.24 | ||
| Labour | Bryan, Matt | 1,723 | 18.71 | ||
| Conservative | McNae, Hilarie June | 1,657 | 17.99 | ||
| Labour | Ford, David Vincent | 1,429 | 15.51 | ||
| Liberal Democrats | Evans, Jean Elizabeth | 814 | 8.84 | ||
| Liberal Democrats | Cameron, James Alexander | 591 | 6.42 | ||
| UKIP | Evans, Jules | 545 | 5.92 | ||
| Green | Howells, Aled Rhys | 496 | 5.38 | ||
| Turnout | 5,045 | 71.5 | |||
| Conservative hold | |||||
| Labour gain from Conservative | |||||
Weaver and Cuddington[]
| Party | Candidate | Votes | % | ||
|---|---|---|---|---|---|
| Conservative | Fifield, Charles | 3,194 | 16.86 | ||
| Conservative | Williams, Paul | 3,180 | 16.79 | ||
| Conservative | Tonge, Harry | 2,580 | 13.62 | ||
| Labour | Cernik, Robert | 1,772 | 9.35 | ||
| Independent | Edwards, Gillian | 1,764 | 9.31 | ||
| Labour | Bryce, Callum | 1,745 | 9.21 | ||
| Labour | Stott, Andy | 1,603 | 8.46 | ||
| UKIP | Watkin, Chris | 1,357 | 7.16 | ||
| Liberal Democrats | Donhue, Stephen M | 928 | 4.90 | ||
| Green | Robinson, Andy | 820 | 4.33 | ||
| Turnout | 7,380 | 71.3 | |||
| Conservative hold | |||||
| Conservative hold | |||||
| Conservative hold | |||||
Whitby[]
| Party | Candidate | Votes | % | ||
|---|---|---|---|---|---|
| Labour | Jones, Brian | 2,104 | 25.82 | ||
| Labour | Shore, Karen Louise | 1,828 | 22.43 | ||
| Conservative | Anderson, Brian | 1,368 | 16.79 | ||
| Conservative | Crompton, Robert Redford | 1,248 | 15.31 | ||
| UKIP | Lomax, Glen | 905 | 11.10 | ||
| Green | Bowers, Sarah Ann | 267 | 3.28 | ||
| Liberal Democrats | Marlow, Tom | 223 | 2.74 | ||
| Green | Griffiths, Tony | 207 | 2.54 | ||
| Turnout | 3,983 | 60.9 | |||
| Labour hold | |||||
| Labour gain from Conservative | |||||
Willaston and Thornton[]
| Party | Candidate | Votes | % | ||
|---|---|---|---|---|---|
| Conservative | Hogg, Myles | 1,912 | 75.39 | ||
| Labour | Evans, James Robert | 624 | 24.61 | ||
| Turnout | 2,569 | 76.8 | |||
| Conservative hold | |||||
Winnington and Castle[]
| Party | Candidate | Votes | % | ||
|---|---|---|---|---|---|
| Labour | Naylor, Sam | 1,719 | 23.75 | ||
| Labour | Dolan, Paul | 1,675 | 23.14 | ||
| Conservative | Sinar, Jim | 1,193 | 16.48 | ||
| Conservative | Ford, Kathy | 1,147 | 15.85 | ||
| UKIP | Wright, Amos Daniel | 588 | 8.12 | ||
| Green | Bower, Darrelle Ann | 391 | 5.40 | ||
| Liberal Democrats | Chapman, Alice Philippa | 305 | 4.21 | ||
| Northwich Independent | Bower, Phillip Michael Dawson | 220 | 3.04 | ||
| Turnout | 4,284 | 59.6 | |||
| Labour hold | |||||
| Labour hold | |||||
Winsford Over and Verdin[]
| Party | Candidate | Votes | % | ||
|---|---|---|---|---|---|
| Labour | Blackmore, Tom | 2,279 | 15.59 | ||
| Labour | Beckett, Don | 2,154 | 14.74 | ||
| Conservative | Baynham, Michael | 1,717 | 11.75 | ||
| Labour | Neil, Arthur Leslie | 1,684 | 11.52 | ||
| Conservative | Jones, Lynda | 1,589 | 10.87 | ||
| Conservative | Dolphin, Margaret | 1,440 | 9.85 | ||
| UKIP | Fawley-Hopkins, Kerrie Jane | 1,059 | 7.24 | ||
| Liberal Democrats | Barton, Bob | 796 | 5.45 | ||
| Liberal Democrats | Parkinson, Charlie | 659 | 4.51 | ||
| Liberal Democrats | Parkey, Brandon | 545 | 3.73 | ||
| Green | Quormby, Sue | 350 | 2.39 | ||
| Green | Brown, Alice Rebecca | 346 | 2.37 | ||
| Turnout | 5,847 | 59.3 | |||
| Labour hold | |||||
| Labour hold | |||||
| Conservative hold | |||||
Winsford Swanlow and Dene[]
| Party | Candidate | Votes | % | ||
|---|---|---|---|---|---|
| Labour | Burns, Stephen | 1,677 | 23.20 | ||
| Labour | Armstrong, David | 1,306 | 18.07 | ||
| Liberal Democrats | Gaskill, Malcolm Ian | 945 | 13.07 | ||
| Conservative | Rimmer, Phil | 861 | 11.91 | ||
| Liberal Democrats | Theron, Bev | 767 | 10.61 | ||
| Conservative | Greenwood, Lesley | 744 | 10.29 | ||
| UKIP | Kendrick, David Michael | 705 | 9.75 | ||
| Green | Hatton, Marc William Vincent | 224 | 3.10 | ||
| Turnout | 4,120 | 60.4 | |||
| Labour hold | |||||
| Labour hold | |||||
Winsford Wharton[]
| Party | Candidate | Votes | % | ||
|---|---|---|---|---|---|
| Labour | Clarke, Brian Michael | 1,920 | 28.08 | ||
| Labour | Booher, Pamela | 1,785 | 26.10 | ||
| Conservative | Hardy, Charles | 926 | 13.54 | ||
| Conservative | Jones, Peter | 903 | 13.21 | ||
| Liberal Democrats | Bore, Chris | 437 | 6.39 | ||
| Liberal Democrats | Fitzmaurice, Janet | 351 | 5.13 | ||
| Green | Barwell, Lyndsay | 288 | 4.21 | ||
| Green | Molton, Ian | 228 | 3.33 | ||
| Turnout | 4,181 | 58.1 | |||
| Labour hold | |||||
| Labour hold | |||||
Witton[]
| Party | Candidate | Votes | % | ||
|---|---|---|---|---|---|
| Labour | Lawrenson, Tony | 2,011 | 34.22 | ||
| Labour | Armstrong, Val | 1,355 | 23.06 | ||
| Conservative | McDowell, George | 1,222 | 20.79 | ||
| Conservative | Nelson, Linda | 924 | 15.72 | ||
| Liberal Democrats | Hinde, Keith | 365 | 6.21 | ||
| Turnout | 3,665 | 57.2 | |||
| Labour hold | |||||
| Labour hold | |||||
Changes between 2015 and 2019[]
Ellesmere Port Town by-election 2018[]
Labour councillor Lynn Clare (Ellesmere Port Town) died in February 2018.[50] The by-election was held on 3 May.[51] This was on the same day as other local elections.
| Party | Candidate | Votes | % | ±% | |
|---|---|---|---|---|---|
| Labour | Mike Edwardson | 1,447 | 82.9 | ||
| Conservative | Robert Griffiths | 239 | 13.7 | ||
| Green | Mathew Roberts | 60 | 3.4 | ||
| Majority | 1,208 | 69.2 | |||
| Turnout | 1,748 | 24.5 | |||
| Rejected ballots | 2 | 0.1 | |||
| Labour hold | Swing | ||||
Footnotes[]
- ^ Although CWaC elects all members at once every four years, many councils elect members in thirds and have more frequent elections. This means that although CWaC was the only council to transfer directly from Labour to Conservative control at the 2015 elections, it was not the only one to change hands this way between 2011 and 2015. Labour also gained two councils – Stockton-on-Tees Borough Council and West Lancashire Borough Council – from no overall control at the 2015 elections.[29] West Lancashire was also held by the Conservatives at the 2011 election, but elects its representatives in thirds.[30] This means there were other elections intervening, and West Lancashire went into no overall control at the 2014 local election.[31] In addition, Crawley, Derbyshire,[32] Dudley, Harlow, Nottinghamshire,[33] Redditch and Southampton were gained by Labour from Conservative control at some point between the 2011 and 2014 local elections and held at the 2015 elections.[29][14][34][35]
References[]
- ^ "Upcoming elections & referendums". The Electoral Commission. Archived from the original on 15 March 2015. Retrieved 28 March 2015.
- ^ a b c Rotten Boroughs (26 May 2015). "Dickhead Alert". Private Eye. No. 1393.
- ^ a b c "Labour take control of Cheshire West and Chester Council". Northwich Guardian. 9 May 2015. Retrieved 13 May 2015.
- ^ a b c d David Holmes (20 May 2015). "Chester Labour MP Chris Matheson back from his first week at Parliament". Chester Chronicle. Retrieved 27 May 2015.
- ^ a b c d e f Michael Green (8 May 2015). "Election 2015: Cheshire West and Chester Council on a knife-edge as count is suspended overnight". Chester Chronicle. Retrieved 22 May 2015.
- ^ a b c d e David Holmes (9 May 2015). "WATCH Election 2015: Labour take control of Cheshire West and Chester Council". Chester Chronicle. Retrieved 22 May 2015.
- ^ a b c d e Carmella de Lucia, David Holmes and Frances Barrett (9 May 2015). "Election 2015: Cheshire West and Chester Council set for first woman leader". Chester Chronicle. Retrieved 22 May 2015.
- ^ a b c d e David Holmes (27 May 2015). "Chester Tory leadership challenger launches damaging attack on Conservative CWaC chief Mike Jones". Chester Chronicle. Retrieved 27 May 2015.
- ^ a b c "A Conservative councillor: Why was Cheshire West and Chester a Labour gain?". ConservativeHome. 26 May 2015. Retrieved 26 May 2015.
- ^ a b Phil McCann (6 May 2015). "Election 2015: Cheshire's long-awaited council votes". BBC News. Retrieved 2 June 2015.
- ^ "ELECTION: Cheshire West and Chester remains Tory controlled". Chester Chronicle. 6 May 2011. Retrieved 22 May 2015.
- ^ "The Boomtown Reds". The Economist. 28 March 2015. Retrieved 22 May 2015.
- ^ Patrick Wintour and Nicholas Watt (23 May 2014). "Lib Dem local election results suggest party could lose 20 parliamentary seats". The Guardian. Retrieved 22 May 2015.
- ^ a b "England council results". BBC News. 22 May 2014. Retrieved 22 May 2015.
- ^ "Labour returned in Ellesmere Port's Town Ward". Talking West Cheshire. 21 October 2011. Archived from the original on 17 June 2015. Retrieved 2 June 2015.
- ^ Frances Barrett (11 July 2014). "Labour celebrate victory in both council by-elections". Chester Chronicle. Retrieved 2 June 2015.
- ^ Frances Barrett (10 April 2015). "Election 2015: Cheshire West and Chester Council candidates revealed". Chester Chronicle. Retrieved 22 May 2015.
- ^ David Holmes (16 April 2015). "General Election 2015: City of Chester Parliamentary candidates". Chester Chronicle. Retrieved 2 June 2015.
- ^ "Weaver Vale Labour Party choose Julia Tickridge to fight general election". Chester Chronicle. 4 July 2013. Retrieved 2 June 2015.
- ^ Michael Green (8 May 2015). "Election 2015: Ellesmere Port and Neston won by Labour". Chester Chronicle. Retrieved 2 June 2015.
- ^ "Statements of Persons Nominated - Local elections". Cheshire West and Chester Council. Archived from the original on 30 May 2015. Retrieved 30 April 2015.
- ^ a b "Town and Parish". West Cheshire Elections 2015. Chester West and Chester Council. Archived from the original on 26 May 2015. Retrieved 26 May 2015.
- ^ Frances Barrett (23 April 2015). "Cheshire West and Chester ballot papers re-issued due to printing error". Chester Chronicle. Retrieved 22 May 2015.
- ^ David Holmes (6 May 2015). "Election 2015: Postal votes in Cheshire West still not arrived". Chester Chronicle. Retrieved 24 May 2015.
- ^ a b David Holmes (8 May 2015). "Election 2015: Chester police investigate leaflet attacking Labour leader". Chester Chronicle. Retrieved 22 May 2015.
- ^ a b Michael Green (8 May 2015). "Election 2015 Live: Cheshire West and Chester Council election results". Chester Chronicle. Retrieved 26 May 2015.
- ^ a b c "Double delight for Labour as party controls Cheshire West and Chester Council". Chester Standard. 11 May 2015. Archived from the original on 26 May 2015. Retrieved 26 May 2015.
- ^ Michael Green (9 May 2015). "Local elections live: Cheshire West and Chester Council election count resumes". Chester Chronicle. Retrieved 27 May 2015.
- ^ a b "Local Election Results 2015". BBC News. Retrieved 5 June 2015.
- ^ "Election 2011 - England council elections - West Lancashire". BBC News. 10 May 2011. Retrieved 5 June 2015.
- ^ "Vote 2014 - West Lancashire Borough Council". BBC News. Retrieved 5 June 2015.
- ^ "Derbyshire election 2013: Labour wins back control". BBC News. 3 May 2013. Retrieved 5 June 2015.
- ^ "Nottinghamshire election 2013: Narrow win for Labour". BBC News. 3 May 2013. Retrieved 5 June 2015.
- ^ "Vote 2012 - English Council Results". BBC News. 4 May 2012. Retrieved 5 June 2015.
- ^ "Election 2011 - English council elections". BBC News. Retrieved 5 June 2015.
- ^ a b c David Holmes (20 May 2015). "Chester Tory chief Mike Jones survives leadership challenge after election defeat". Chester Chronicle. Retrieved 22 May 2015.
- ^ David Holmes (4 May 2015). "Election 2015: Chester UKIP candidate for parliament and council 'proud' to have stood for party". Chester Chronicle. Retrieved 26 May 2015.
- ^ "Local Election Results 2015 Cheshire West and Chester". Local Elections Archive Project.
- ^ a b c d David Holmes (26 May 2015). "Cheshire West and Chester Council have bad-tempered first meeting under Labour control". Chester Chronicle. Retrieved 10 June 2015.
- ^ Phil McCann (6 May 2015). "Will fracking decide Chester?". BBC News. Retrieved 29 May 2015.
- ^ "Anti-frackers build for demonstration outside HQ after Tory majority rejects debate". Chester Chronicle. 22 March 2015. Retrieved 22 May 2015.
- ^ a b "Parkgate Electorate Vote Local in Historic Victory for an Independent". AboutMyArea. 9 May 2015. Retrieved 25 May 2015.
- ^ "Candidate Statements - CWAC Elections 2015 : Parkgate Ward". AboutMyArea. 21 April 2015. Archived from the original on 27 May 2015. Retrieved 25 May 2015.
- ^ David Holmes (23 May 2013). "Was I sacked over student village vote?' asks ex-chairman of Cheshire West and Chester Council's key planning committee". Chester Chronicle. Retrieved 27 May 2015.
- ^ Jim Green (23 September 2013). "Come clean call in row on Chester village vote". Chester Standard. Archived from the original on 27 May 2015. Retrieved 27 May 2015.
- ^ "Probe over d***head comment by council leader". Chester Standard. 23 August 2012. Archived from the original on 10 June 2015. Retrieved 3 June 2015.
- ^ David Holmes (3 March 2015). "Cheshire West and Chester Council loses respect (clause)". Chester Chronicle. Retrieved 27 May 2015.
- ^ "Official turnout for borough wards". Cheshire West and Chester Council. Archived from the original on 23 September 2015. Retrieved 13 May 2015.
- ^ "Elections 2015 - Results for Tattenhall Ward". Retrieved 8 May 2015.
- ^ Holmes, David (12 February 2018). "Tributes paid to 'passionate' Ellesmere Port councillor". chesterchronicle. Retrieved 8 April 2018.
- ^ "Page Moss: CTRL – DEL | LocalCouncils.co.uk". localcouncils.co.uk. Retrieved 8 April 2018.
- ^ "Election results for Claughton". Wirral Metropolitan Borough Council.
External links[]
- Borough election details, Cheshire West Elections 2015
- Election 2015, Cheshire West and Chester Council
(2014 ←) | |
|---|---|
| Metropolitan boroughs |
|
| Unitary authorities (England) |
|
| District councils (England) |
|
| Mayoral elections |
|
| |
| Cheshire East Council |
|
|---|---|
| Cheshire West and Chester Council | |
| Halton Borough Council | |
| Warrington Borough Council | |
| Cheshire County Council |
|
| Chester City Council |
|
| Congleton Borough Council |
|
| Crewe and Nantwich Borough Council |
|
| Ellesmere Port and Neston Borough Council | |
| Macclesfield Borough Council | |
| Vale Royal Borough Council |
|
| |
- 2015 English local elections
- May 2015 events in the United Kingdom
- Cheshire West and Chester Council elections
- 2010s in Cheshire
- Anti-fracking movement