2019 Pacific hurricane season
| 2019 Pacific hurricane season | |
|---|---|
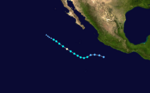
 Season summary map | |
| Seasonal boundaries | |
| First system formed | June 25, 2019 (record latest in the East Pacific) |
| Last system dissipated | November 18, 2019 |
| Strongest storm | |
| Name | Barbara |
| • Maximum winds | 155 mph (250 km/h) (1-minute sustained) |
| • Lowest pressure | 930 mbar (hPa; 27.46 inHg) |
| Seasonal statistics | |
| Total depressions | 21 |
| Total storms | 19 |
| Hurricanes | 7 |
| Major hurricanes (Cat. 3+) | 4 |
| Total fatalities | 7 total |
| Total damage | $66.1 million (2019 USD) |
| Related articles | |
The 2019 Pacific hurricane season was a near average season which produced nineteen named storms, though most were rather weak and short-lived. Only seven hurricanes formed, the fewest since 2010. The season officially began on May 15 in the East Pacific Ocean, and on June 1 in the Central Pacific; they ended on November 30. These dates conventionally delimit the period of each year when most tropical cyclones form in the Pacific basin. However, the formation of tropical cyclones is possible at any time of the year.
The season had a rather slow start, with no tropical cyclones forming in the basin during the month of May for the first time since 2016, and the first time that no storms formed before the month of June since 2011. The season became the latest-starting Pacific hurricane season on record since reliable records began in 1971 with the first tropical depression, which eventually became Hurricane Alvin, forming on June 25.[1] The strongest hurricane of the season, Barbara, formed on June 30 and peaked as a high-end Category 4 hurricane on July 3. August was extremely quiet with no hurricanes forming during the month, a first for a season since 1973. September was much more active with six systems developing, of which three became hurricanes. Activity decreased appreciably in October and November as most of the storms remained weak and short-lived.
Land impact was relatively minimal. The remnants of Barbara caused power outages in Hawaii in early July. Hurricanes Erick and Flossie both threatened Hawaii, but the systems weakened significantly before reaching the islands, both causing minimal effects. Tropical Storm Ivo and Hurricane Juliette both brought strong winds to Clarion Island. In late September, Hurricane Lorena made landfall in southwestern Mexico and Baja California Sur, and its remnant moisture entered the southwestern United States. Lorena was responsible for one death and damages worth $910,000. Tropical Storm Narda took a nearly identical track a week later, killing six and causing $15.2 million in damage. Overall, this season was drastically less active and destructive than the previous year, causing about $16.1 million in damages and seven fatalities.
Seasonal forecasts[]
| Record | Named storms |
Hurricanes | Major hurricanes |
Ref | |
|---|---|---|---|---|---|
| Average (1981–2010): | 15.4 | 7.6 | 3.2 | [2] | |
| Record high activity: | 1992: 27 | 2015: 16 | 2015: 11 | [3] | |
| Record low activity: | 2010: 8 | 2010: 3 | 2003: 0 | [3] | |
| Date | Source | Named storms |
Hurricanes | Major hurricanes |
Ref |
| May 15, 2019 | SMN | 19 | 11 | 6 | [4] |
| May 23, 2019 | NOAA | 15–22 | 8–13 | 4–8 | [5] |
| Area | Named storms |
Hurricanes | Major hurricanes |
Ref | |
| Actual activity: | EPAC | 17 | 7 | 4 | |
| Actual activity: | CPAC | 2 | 0 | 0 | |
| Actual activity: | 19 | 7 | 4 | ||
On May 15, 2019, the Servicio Meteorológico Nacional (SMN) issued its first forecast for the season, predicting a total of 19 named storms, 11 hurricanes, and six major hurricanes to develop.[4] On May 23, the National Oceanic and Atmospheric Administration released its annual forecast, predicting a 70% chance of a near- to above-average season in both the Eastern and Central Pacific basins, with a total of 15–22 named storms, 8–13 hurricanes, and 4–8 major hurricanes.[5] The reason for their outlook was the forecast of an El Niño to continue through the season, which reduces vertical wind shear across the basin and increases sea surface temperatures, favoring increased tropical cyclone activity. In addition, many global computer models expected a positive Pacific decadal oscillation (PDO), a phase of a multi-decade cycle that favored much warmer than average sea surface temperatures that had been ongoing since 2014 to continue, in contrast to the 1995–2013 period, which generally featured below-normal activity.[6]
Seasonal summary[]


The season officially began on May 15 in Eastern Pacific and on June 1 in Central Pacific; both ended on November 30.[7] Initial activity was slow, with the first tropical depression forming on June 25. The strongest storm of the season, hurricane Barbara, reached peak intensity on July 2 as a high-end category 4 hurricane. The season became more active in July, with five tropical cyclones forming, including two storms that intensified into hurricanes. Among them was Hurricane Erick, which reached Category 4 status on July 31.[8] This level of activity came to a halt in August, with only three named storms forming, none of which reached hurricane strength.
On the first day of September, Hurricane Juliette formed, becoming the third major hurricane of the season.[9] Moreover, tropical activity also began in the Central Pacific with the formation of Tropical Storm Akoni on September 3, which dissipated two days later. There were no tropical cyclones for five days until the formation of Hurricane Kiko on September 12 and the formation of Tropical Storm Mario and Hurricane Lorena five days later. In late September, Tropical Storm Narda became the sixth named storm to form during the month, tying the record for the most active September with the seasons of 1966, 1992, 1994, 1997, 2001 and 2005.
Three tropical storms formed in the month of October, the first one was Tropical Storm Ema which formed on October 12 in the Central Pacific, becoming the first such occurrence since 2016 in which more than one tropical cyclone was named in the basin. The second named storm of the month, Octave, formed on October 17 and dissipated two days later without threatening land. Priscilla formed on October 20 and later dissipated the next day while it brushed Western Mexico. In mid-November, Tropical Storm Raymond formed on November 15, just fifteen days before the season officially ended.
The accumulated cyclone energy (ACE) index for the 2019 Pacific hurricane season was 83.56 units in the Eastern Pacific and 14.4275 units in the Central Pacific. The total ACE in the basin is 97.9875 units.[nb 1]
Systems[]
Hurricane Alvin[]
| Category 1 hurricane (SSHWS) | |
  | |
| Duration | June 25 – June 29 |
|---|---|
| Peak intensity | 75 mph (120 km/h) (1-min) 992 mbar (hPa) |
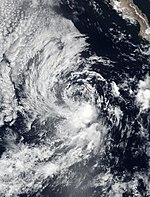
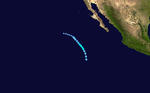
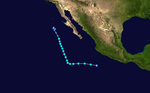
A tropical wave moved off Africa's western coast on June 12, reaching the Caribbean Sea a week later and continuing across Central America. The wave spawned an area of low pressure on June 24, and this feature organized into the season's first tropical depression by 12:00 UTC on June 25 while located a few hundred miles south of Mexico. The depression initially struggled to organize, but it eventually intensified into Tropical Storm Alvin around 12:00 UTC on June 26. As a mid-level ridge steered the storm west, it began to organize in a more favorable environment. After very deep convection fired over its center, Alvin became a minimal Category 1 hurricane by 00:00 UTC on June 28 as it developed a 10 mi (16 km) diameter eye. After attaining peak intensity, the system encountered cooler waters and increasing wind shear, causing it to weaken. Alvin became devoid of deep convection by 06:00 UTC on June 29, degenerating to a remnant low to the west-southwest of Baja California Sur at that time. The remnant low drifted west and dissipated around a day later.[10]
Hurricane Barbara[]
| Category 4 hurricane (SSHWS) | |
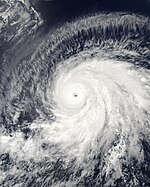  | |
| Duration | June 30 – July 5 |
|---|---|
| Peak intensity | 155 mph (250 km/h) (1-min) 930 mbar (hPa) |
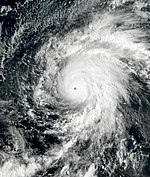
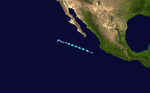
Less than a week after a tropical wave spawned Alvin, a new tropical wave moved off Africa on June 18. It remained disorganized while crossing the Atlantic, and it progressed into the eastern Pacific on June 26. The disturbance organized over the coming days and developed into Tropical Storm Barbara by 06:00 UTC on June 30, having already possessed gale-force winds at the time of formation. It moved quickly westward while struggling to intensify in an environment of wind shear and dry air. By July 1, however, more favorable environmental conditions allowed the storm to intensify. Barbara became a hurricane by 18:00 UTC on July 1 and began to rapidly intensify, ultimately reaching its peak at Category 4 intensity with winds of 155 mph (250 km/h) at 00:00 UTC on July 3. The storm maintained a 15 mi (24 km) diameter eye surrounded by an intense central dense overcast and numerous rainbands at that time. A turn toward the northwest brought the storm into cooler waters and drier air, with an increasingly rapid rate of weakening through July 5. Barbara degenerated to a remnant low by 00:00 UTC on July 6 after losing its deep convection. The low turned west and dissipated into a trough on July 8 to the east-southeast of Hawaii.[11]
Barbara's remnants passed 120 mi (190 km) south of Hawai'i on July 8, producing showers over the windward regions of the island and nearby Maui.[12] The storms generated by Barbara's remnants were cited by Hawaiian Electric Industries as the likely cause of power outages affecting 45,000 electricity customers.[13]
Tropical Storm Cosme[]
| Tropical storm (SSHWS) | |
  | |
| Duration | July 6 – July 7 |
|---|---|
| Peak intensity | 50 mph (85 km/h) (1-min) 1001 mbar (hPa) |
Another tropical wave moved off Africa on June 23 and crossed into the East Pacific on July 2. The favorable influence of a kelvin wave and the Madden–Julian oscillation allowed the disturbance to organize, and it developed into Tropical Storm Cosme by 12:00 UTC on July 6. Anomalously strong high pressure aided in accelerating the storm's winds, and it attained a peak intensity of 50 mph (80 km/h) upon formation. Thereafter, cooler waters, dry air, and wind shear arrested Cosme's development, and the cyclone began to weaken while turning northwest. By 00:00 UTC on July 8, Cosme degenerated to a remnant low. The low later turned west before dissipating into a trough early on July 11.[14]
Tropical Depression Four-E[]
| Tropical depression (SSHWS) | |
  | |
| Duration | July 12 – July 13 |
|---|---|
| Peak intensity | 35 mph (55 km/h) (1-min) 1006 mbar (hPa) |
The tropical wave that spawned Cosme was succeeded a week later by another. It entered the East Pacific on July 8 but remained disorganized for several days while tracking west. The wave gave way to an area of low pressure on July 12, which then organized into a tropical depression only six hours later. The depression was located over very warm sea surface temperatures but under the influence of moderate wind shear, preventing organization. By July 12, persistent upper-level winds began to shear away the cyclone's convection. It degenerated to a remnant low at 00:00 UTC on July 14 while located south-southwest of Baja California Sur. The low produced intermittent bursts of convection as it moved west-northwest but ultimately dissipated early on July 15.[15]
Tropical Storm Dalila[]
| Tropical storm (SSHWS) | |
  | |
| Duration | July 22 – July 25 |
|---|---|
| Peak intensity | 45 mph (75 km/h) (1-min) 1004 mbar (hPa) |
A tropical wave moved off Africa on July 8, showing some signs of organization until it reached the western Caribbean. It continued into the East Pacific and formed a tropical depression around 06:00 UTC on July 22. The cyclone remained disorganized for much of its duration, plagued by northerly wind shear and cooler waters. However, the formation of spiral rai bands allowed it to become Tropical Storm Dalila by 06:00 UTC on July 23; the storm attained peak winds of 45 mph (70 km/h) six hours later. It progressed over even cooler waters, causing Dalila to become a remnant low by 12:00 UTC on July 25. The low drifted west and dissipated the following day.[16]
Hurricane Erick[]
| Category 4 hurricane (SSHWS) | |
  | |
| Duration | July 27 – August 4 |
|---|---|
| Peak intensity | 130 mph (215 km/h) (1-min) 952 mbar (hPa) |
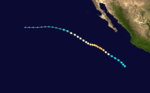
Erick originated as a tropical wave that emerged off the coastline of Africa on July 12. It entered the eastern Pacific in late July, where convection blossomed in the presence of a very strong kelvin wave. Moderately wind shear slowed the formation process, but a tropical depression finally developed around 12:00 UTC on July 27 and organized into a tropical storm six hours later. Dry air and the elongation of its center likewise slowed organization shortly after development, but a center relocation placed the storm in a favorable environment. Erick intensified into a hurricane at 18:00 UTC on July 29 and began a period of rapid intensification, intensifying to 60 mph (95 km/h) in just 24 hours as it crossed into the central Pacific basin. This bout of strengthening brought Erick to its peak as a Category 4 hurricane with winds of 130 mph (210 km/h) around 18:00 UTC on July 30. The cyclone subsequently weakened while passing south of Hawaii as wind shear increased over the system. Bursts of convection allowed Erick to persist as a tropical cyclone from August 3 to 4. However, the system eventually degenerated to a remnant low by 00:00 UTC on August 5. The remnants of Erick continued moving west and reached the International Date Line on August 8.[17]
Hurricane Flossie[]
| Category 1 hurricane (SSHWS) | |
  | |
| Duration | July 28 – August 5 |
|---|---|
| Peak intensity | 80 mph (130 km/h) (1-min) 987 mbar (hPa) |
A tropical wave moved off Africa on July 16 and crossed into the East Pacific eight days later. The disturbance coalesced while positioned south of Mexico, organizing into a tropical depression by 12:00 UTC on July 28. It slowly intensified while moving rapidly west-northwest, becoming Tropical Storm Flossie early on July 29 and a hurricane later the next day. After attaining peak winds of 80 mph (130 km/h), the storm weakened amid increasing westerly wind shear. These unfavorable upper-level winds abated on August 1, causing Flossie to fluctuate in intensity for the next day. By August 3, however, the storm embarked on a gradual weakening trend. It degenerated to a remnant low to the north of Hawaii at 00:00 UTC on August 6. The low turned north-northwest and dissipated the next morning.[18]
Tropical Storm Gil[]
| Tropical storm (SSHWS) | |
  | |
| Duration | August 3 – August 4 |
|---|---|
| Peak intensity | 40 mph (65 km/h) (1-min) 1006 mbar (hPa) |
On July 28, an area of disturbed weather that could not reliably be traced over the Atlantic was noted over Central America. A broad area of low pressure formed on the final day of July and moved west-northwest, gaining enough organization to be declared a tropical depression around 06:00 UTC on August 3. The depression turned northwest after formation tracked through an unfavorable wind shear environment. Despite this, it intensified into Tropical Storm Gil around 18:00 UTC on August 3, with the center located on the western edge of associated thunderstorm activity. Gil failed to intensify beyond minimal tropical storm intensity, losing its bursting convection as the storm encountered dry air. Gil degenerated to a remnant low around 00:00 UTC on August 5 well to the west-southwest of Baja California Sur. It dissipated the next morning.[19]
Tropical Storm Henriette[]
| Tropical storm (SSHWS) | |
  | |
| Duration | August 12 – August 13 |
|---|---|
| Peak intensity | 45 mph (75 km/h) (1-min) 1003 mbar (hPa) |
A vigorous tropical wave crossed the coastline of Africa on July 28 and moved west across the Atlantic. The wave nearly organized into a tropical depression over the eastern Caribbean Sea but soon lost organization. After it crossed into the East Pacific on August 9, subsequent interaction with a monsoon trough led to the formation of an area of low pressure, which continued on to become a tropical depression around 00:00 UTC on August 12 to the south of Baja California Sur. Increasing thunderstorm activity led to the designation of Tropical Storm Henriette six hours later. Henriette attained peak winds of 45 mph (70 km/h) before the combination of cooler waters and dry air caused weakening, degenerating into a remnant low around 12:00 UTC on August 13 and dissipated two days later.[20]
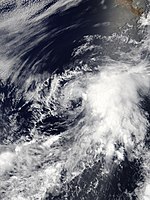
Tropical Storm Ivo[]
| Tropical storm (SSHWS) | |
  | |
| Duration | August 21 – August 25 |
|---|---|
| Peak intensity | 70 mph (110 km/h) (1-min) 990 mbar (hPa) |
Two tropical waves crossed the Atlantic in quick succession. The leading tropical wave spawned an area of low pressure over the eastern Pacific on August 6, while the second wave enhanced the low's convection. The disturbance gradually developed into a tropical depression by 06:00 UTC on August 21; it intensified into Tropical Storm Ivo six hours later. Favorable atmospheric conditions allowed Ivo to intensify over subsequent days, and it reached a peak intensity of 70 mph (115 km/h) early on August 22 as a mid-level eye became evident on microwave imagery. Although increasing wind shear caused it to slowly weaken, Ivo passed close to Clarion Island early on August 23, producing sustained winds of 61 mph (98 km/h) and gusts to 76 mph (122 km/h). The storm continued to weaken as it entered cooler waters. It degenerated to a remnant low around 06:00 UTC on August 25. The low meandered for a while before dissipating early on August 27 to the west of Baja California Sur.[21]
Hurricane Juliette[]
| Category 3 hurricane (SSHWS) | |
  | |
| Duration | September 1 – September 7 |
|---|---|
| Peak intensity | 125 mph (205 km/h) (1-min) 953 mbar (hPa) |
On August 18, a tropical wave moved off Africa. It inconspicuously crossed the Atlantic and emerged into the East Pacific on August 27. A broad area of low pressure formed in association with increased convective activity, leading to the formation of Tropical Storm Juliette by 00:00 UTC on September 1. The newly formed storm quickly organized amid favorable conditions, becoming a hurricane by 12:00 UTC on September 2 and entering a period of rapid intensification. Within a day, Juliette attained its peak at Category 3 intensity with winds of 125 mph (200 km/h). Beyond that time, the cyclone's eyewall collapsed and caused a persistent weakening trend. Juliette degenerated to a remnant low 06:00 UTC on September 7 to the west of Baja California Sur. The low drifted west and dissipated early on September 9.[22]
Tropical Storm Akoni[]
| Tropical storm (SSHWS) | |
  | |
| Duration | September 4 – September 6 |
|---|---|
| Peak intensity | 40 mph (65 km/h) (1-min) 1004 mbar (hPa) |
Early on September 4, the NHC began to track a quickly-developing area of low pressure about 1,100 mi (1,770 km) east-southeast of the Big Island of Hawaii.[23] Just a few hours later, following a sudden increase in convection, the system organized into Tropical Depression Twelve-E and moved into the Central Pacific basin.[24] It slowly intensified and eventually reached tropical storm status, whereupon it was named Akoni.[25] The system struggled to organize because of high wind shear and quickly degenerated into a remnant low on September 6.[26]
Akoni is one of only seven tropical cyclones to form as a depression in the Eastern Pacific and be given a name in the Central Pacific, with the others being Lala in 1984, Iniki in 1992, Li in 1994, Lana in 2009, Ela in 2015 and Ulika in 2016.
Hurricane Kiko[]
| Category 4 hurricane (SSHWS) | |
  | |
| Duration | September 12 – September 24 |
|---|---|
| Peak intensity | 130 mph (215 km/h) (1-min) 950 mbar (hPa) |
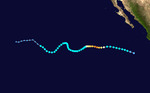
The final major hurricane of the season originated as a tropical wave that moved off Africa on August 27. It crossed into the East Pacific on September 7, where it spawned a tropical depression by 06:00 UTC on September 12. The depression intensified into Tropical Storm Kiko twelve hours later but struggled to organize further as it underwent multiple center reformations. Beginning at 00:00 UTC on September 14, however, Kiko entered a period of rapid intensification that brought the storm to its peak as a Category 4 hurricane with winds of 130 mph (210 km/h) a little over a day later. It displayed a prominent spiral band wrapping into a symmetric central dense overcast and large eye at that time. After reaching peak intensity, Kiko fluctuated in intensity due to varying atmospheric conditions while tracing a sinusoidal path across the Pacific. The storm finally lost its deep convection on September 24 and degenerated to a remnant low by 18:00 UTC as a result. The low turned west and dissipated on September 27.[27]
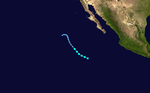
Hurricane Lorena[]
| Category 1 hurricane (SSHWS) | |
  | |
| Duration | September 17 – September 22 |
|---|---|
| Peak intensity | 85 mph (140 km/h) (1-min) 985 mbar (hPa) |
A large tropical wave departed Africa on September 4 and entered the East Pacific by September 16. The disturbance quickly organized upon emerging over water, and it became Tropical Storm Lorena at 06:00 UTC on September 17 while moving northwest. Lorena became a hurricane on September 19 while passing very close to the coastline of Jalisco and made landfall near Chatmela-Cuixmala with winds of 75 mph (120 km/h) six hours later. Lorena weakened as it emerged back offshore, but it became a hurricane a second time and reached peak winds of 85 mph (135 km/h) late on September 20 as an eye appeared on satellite. The storm struck Baja California Sur near La Ventana at a slightly reduced strength at 03:00 UTC on September 21. Lorena weakened thereafter as it curved north, degenerating to a remnant low as it reached the coastline of mainland Mexico around 12:00 UTC on September 22 and dissipating six hours later.[28]
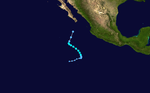
Tropical Storm Mario[]
| Tropical storm (SSHWS) | |
  | |
| Duration | September 17 – September 22 |
|---|---|
| Peak intensity | 70 mph (110 km/h) (1-min) 991 mbar (hPa) |
A tropical wave, the same that spawned Tropical Storm Gabrielle in the Atlantic, left Africa on August 30 and progressed into the eastern Pacific on September 13. The wave led to the formation of a tropical depression around 12:00 UTC on September 17 and Tropical Storm Mario twelve hours later. Although Mario was located in close proximity to strengthening Tropical Storm Lorena and experienced shear from that storm's outflow, it still intensified to a peak of 70 mph (115 km/h) late on September 18 while weaving its way north across the Pacific. Shortly thereafter, upper-level winds increased further and caused a weakening trend that caused the system to degenerate to a remnant low by 00:00 UTC on September 23. The low moved parallel to the Baja California Sur before turning east and dissipating just west of the landmass late on September 24.[29]
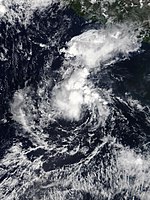
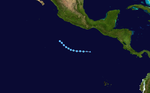
Tropical Storm Narda[]
| Tropical storm (SSHWS) | |
  | |
| Duration | September 29 – October 1 |
|---|---|
| Peak intensity | 50 mph (85 km/h) (1-min) 997 mbar (hPa) |
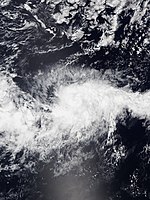
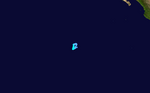
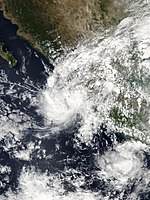
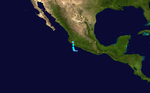
The deadliest tropical cyclone of the season originated as a tropical wave that left Africa on September 15. The wave entered the eastern Pacific on September 26, where it became embedded within the Intertropical Convergence Zone and organized. Tropical Storm Narda developed around 00:00 UTC on September 29 as a result. The nascent cyclone moved quickly northwest and made landfall northeast of Lázaro Cárdenas, Michoacán, at 14:00 UTC on September 29 harboring winds of 45 mph (70 km/h). Mountainous terrain slightly weakened Narda as it crossed over land, but its large circulation and outside orographic effects aided in the maintenance of tropical storm-force winds. The storm immediately re-intensified once over water and attained peak winds of 50 mph (80 km/h) while developing a mid-level eye feature. Narda made a second landfall near Las Glorias around 00:00 UTC on October 1 at peak strength. It rapidly weakened after moving inland and dissipated six hours later over southern Sonora.[30]
Narda brought heavy rains and flooding in southwestern Mexico. Two people were killed in Oaxaca, one in Colima, and one in Guerrero.[31][32]
Tropical Storm Ema[]
| Tropical storm (SSHWS) | |
  | |
| Duration | October 12 – October 14 |
|---|---|
| Peak intensity | 50 mph (85 km/h) (1-min) 1003 mbar (hPa) |
An area of low pressure developed a few hundred miles to the west of Hawaii on October 12. The system was assessed as having a low chance of development by the Central Pacific Hurricane Center; however, the system quickly organized later the same day. Gale-force winds soon developed, and consequently the CPHC upgraded the system to a tropical storm at 15:00 UTC, naming it Ema.[33] Ema's existence was short-lived, however, as the storm weakened due to strong wind shear and degenerated to a remnant low on October 14.[34]
Tropical Storm Octave[]
| Tropical storm (SSHWS) | |
  | |
| Duration | October 17 – October 19 |
|---|---|
| Peak intensity | 45 mph (75 km/h) (1-min) 1006 mbar (hPa) |
An area of low pressure materialized within the monsoon trough across the eastern Pacific on October 15. The low drifted west-southwest and organized into a tropical depression around 12:00 UTC on October 17 before further intensifying into Tropical Storm Octave twelve hours later. The small storm attained peak winds of 45 mph (70 km/h) within a small central dense overcast before it drifted northward into an environment of dry air that prompted weakening. Octave degenerated to a remnant low around 18:00 UTC on October 19 as it curved east-northeast and later south-southwest. The remnant low dissipated two days later in the vicinity of where it first developed.[35]
Tropical Storm Priscilla[]
| Tropical storm (SSHWS) | |
  | |
| Duration | October 20 – October 21 |
|---|---|
| Peak intensity | 45 mph (75 km/h) (1-min) 1003 mbar (hPa) |
Another tropical wave moved off Africa on October 3 and fractured over the Caribbean Sea, with the northern portion spawning Tropical Storm Nestor in the Atlantic. The southern portion continued into the eastern Pacific, leading to the formation of a tropical depression around 00:00 UTC on October 20. It intensified into Tropical Storm Priscilla six hours later while turning north. Having spent little time over water, and affected by moderate easterly wind shear, Priscilla quickly moved into the coastline near Cuyutlán, Colima, at 19:30 UTC on October 20 as a minimal tropical storm. The cyclone weakened quickly once inland and dissipated by 06:00 UTC on October 21 over the rugged terrain of southwestern Mexico.[36]
Priscilla and its precursor disturbance over Mexico caused heavy flooding and mudslides in and around areas Manzanillo.[37]
Tropical Storm Raymond[]
| Tropical storm (SSHWS) | |
  | |
| Duration | November 14 – November 17 |
|---|---|
| Peak intensity | 50 mph (85 km/h) (1-min) 1001 mbar (hPa) |
Yet another tropical wave left Africa on October 27. This feature entered the East Pacific on November 6, where it was enhanced by an ongoing Gulf of Tehuantepec gap wind event and an eastward-moving kelvin wave. The wave spawned a tropical depression by 12:00 UTC on November 14. It moved north and north-northwest while remaining largely disorganized in the presence of moderate northwesterly wind shear. By 06:00 UTC on November 15, the depression intensified into Tropical Storm Raymond. It attained peak winds of 50 mph (80 km/h) later that day before encountering increased wind shear from the southwest. Raymond slowly decayed and dissipated after 00:00 UTC on November 18 to the south of Baja California Sur.[38]
The remnants of the storm brought heavy rain to Southern California and Arizona, leaving over 13 million people under flash flood watch and alleviating unusually dry conditions, bringing the first significant rainfall to Southern California since May.[39] The system also brought heavy snow to higher elevation areas.[40]
Tropical Depression Twenty-One-E[]
| Tropical depression (SSHWS) | |
  | |
| Duration | November 16 – November 18 |
|---|---|
| Peak intensity | 35 mph (55 km/h) (1-min) 1006 mbar (hPa) |
On November 2, a late-season tropical wave moved off the west coast of Africa. The wave entered the eastern Pacific on November 12 and spawned an area of low pressure the next day. A strong gap wind event kept the system disorganized as it passed south of the Gulf of Tehuantepec. Afterwards, deep convection began to develop closer to the center of the low, and the low's circulation became more apparent. This resulted in the formation of the season's final tropical depression around 00:00 UTC on November 16. Multiple center reformations and intrusions of dry air arrested development despite another favorable environment. This resulted in weakening, and the depression dissipated after 12:00 UTC on November 18.[41]
Other systems[]

A tropical wave entered the eastern Pacific by October 14, where it spawned a broad area of low pressure. The disturbance became better defined over the coming days, prompting the NHC to initiate advisories on Potential Tropical Cyclone Seventeen-E at 03:00 UTC on October 16 and facilitate tropical storm watches along the coastline of Mexico. The disturbance soon became poorly organized, as its convection dwindled and its center became less defined. The system moved inland between Bahias de Huatulco and Salina Cruz in the Mexican state of Oaxaca without ever having formed into a tropical cyclone.[42] Gusty winds and heavy rain affected parts of El Salvador, causing significant damage. Four people died in storm-related incidents: three from flooding and one from a fallen tree.[citation needed] Eighty families required evacuation in Cangrejera.[43]
Storm names[]
The following names were used for named storms that form in the northeastern Pacific Ocean during 2019. This was the same list used in the 2013 season, with the exception of the name Mario, which replaced Manuel. The name Mario was used for the first time this year.[44] No names were retired from this list, so all will be used again in the 2025 season.
|
|
For storms that form in the Central Pacific Hurricane Center's area of responsibility, encompassing the area between 140 degrees west and the International Date Line, all names are used in a series of four rotating lists.[45] The next four names that were slated for use in 2019 are shown below, though only two of them were used during the season.
|
|
|
|
Season effects[]
This is a table of all the storms that have formed in the 2019 Pacific hurricane season. It includes their duration, names, affected areas, damages, and death totals. Deaths in parentheses are additional and indirect (an example of an indirect death would be a traffic accident), but were still related to that storm. Damage and deaths include totals while the storm was extratropical, a tropical wave, or a low, and all the damage figures are in USD. Potential tropical cyclones are not included in this table.
| Saffir–Simpson scale | ||||||
| TD | TS | C1 | C2 | C3 | C4 | C5 |
| Storm name |
Dates active | Storm category
at peak intensity |
Max 1-min wind mph (km/h) |
Min. press. (mbar) |
Areas affected | Damage (USD) |
Deaths | Refs
| ||
|---|---|---|---|---|---|---|---|---|---|---|
| Alvin | June 25–29 | Category 1 hurricane | 75 (120) | 992 | Western Mexico | None | None | |||
| Barbara | June 30 – July 5 | Category 4 hurricane | 155 (250) | 930 | Clipperton Island, Hawaii, Johnston Atoll | Minimal | None | |||
| Cosme | July 6–7 | Tropical storm | 50 (85) | 1001 | None | None | None | |||
| Four-E | July 12–13 | Tropical depression | 35 (55) | 1006 | None | None | None | |||
| Dalila | July 22–25 | Tropical storm | 45 (75) | 1004 | None | None | None | |||
| Erick | July 27 – August 4 | Category 4 hurricane | 130 (215) | 952 | Hawaii | None | None | |||
| Flossie | July 28 – August 5 | Category 1 hurricane | 80 (130) | 987 | Hawaii | None | None | |||
| Gil | August 3–4 | Tropical storm | 40 (65) | 1006 | None | None | None | |||
| Henriette | August 12–13 | Tropical storm | 45 (75) | 1003 | None | None | None | |||
| Ivo | August 21–25 | Tropical storm | 70 (110) | 990 | Clarion Island | None | None | |||
| Juliette | September 1–7 | Category 3 hurricane | 125 (205) | 953 | Southwest Mexico, Revillagigedo Islands, Baja California Peninsula | None | None | |||
| Akoni | September 4–6 | Tropical storm | 40 (65) | 1004 | None | None | None | |||
| Kiko | September 12–24 | Category 4 hurricane | 130 (215) | 950 | None | None | None | |||
| Lorena | September 17–22 | Category 1 hurricane | 85 (140) | 985 | Sonora, Sinaloa, Jalisco, Colima, Michoacán, Baja California Peninsula | >$50 million | 1 | [46][47] | ||
| Mario | September 17–22 | Tropical storm | 70 (110) | 991 | Revillagigedo Islands, Baja California Peninsula | None | None | |||
| Narda | September 29 – October 1 | Tropical storm | 50 (85) | 997 | Western Mexico, Baja California Peninsula | $15.2 million | 6 | [31][48][49] | ||
| Ema | October 12–14 | Tropical storm | 50 (85) | 1003 | Hawaiian Islands, Papahānaumokuākea Marine National Monument | None | None | |||
| Octave | October 17–19 | Tropical storm | 45 (75) | 1006 | None | None | None | |||
| Priscilla | October 20–21 | Tropical storm | 45 (75) | 1003 | Western Mexico | Minimal | None | |||
| Raymond | November 14–17 | Tropical storm | 50 (85) | 1001 | Revillagigedo Islands, Baja California Peninsula | Minimal | None | |||
| Twenty-One-E | November 16–18 | Tropical depression | 35 (55) | 1006 | Southwest Mexico | None | None | |||
| Season aggregates | ||||||||||
| 21 systems | June 25 – November 18 | 155 (250) | 930 | $66.1 million | 7 | |||||
See also[]
- List of Pacific hurricanes
- Pacific hurricane season
- Tropical cyclones in 2019
- 2019 Atlantic hurricane season
- 2019 Pacific typhoon season
- 2019 North Indian Ocean cyclone season
- South-West Indian Ocean cyclone seasons: 2018–19, 2019–20
- Australian region cyclone seasons: 2018–19, 2019–20
- South Pacific cyclone seasons: 2018–19, 2019–20
Notes[]
- ^ The totals represent the sum of the squares for every tropical storm's intensity of over 33 knots (38 mph, 61 km/h), divided by 10,000. Calculations are provided at Talk:2019 Pacific hurricane season/ACE calcs.
References[]
- ^ "Eastern Pacific's First Storm of Hurricane Season May Develop This Week at an Unusually Late Date". The Weather Channel. Retrieved 6 August 2019.
- ^ "Background Information: East Pacific Hurricane Season". Climate Prediction Center. College Park, Maryland: National Oceanic and Atmospheric Administration. May 22, 2014. Retrieved May 29, 2014.
- ^ Jump up to: a b National Hurricane Center; Hurricane Research Division; Central Pacific Hurricane Center. "The Northeast and North Central Pacific hurricane database 1949–2019". United States National Oceanic and Atmospheric Administration's National Weather Service. Retrieved 1 October 2020. A guide on how to read the database is available here.
- ^ Jump up to: a b "Temporada de Ciclones 2019". smn.cna.gob.mx. Archived from the original on 2019-07-01. Retrieved 2019-05-22.
- ^ Jump up to: a b "NOAA predicts above-normal 2019 hurricane season in the central Pacific". National Oceanic and Atmospheric Administration. May 23, 2019.
- ^ "NOAA predicts above-normal 2019 hurricane season in the central Pacific". Climate Prediction Center. National Oceanic and Atmospheric Administration. May 23, 2019.
- ^ Neal Dorst (June 2, 2016). "TCFAQ G1) When is hurricane season?". Atlantic Oceanographic and Meteorological Laboratory. Archived from the original on 2009-05-06. Retrieved July 24, 2018.
- ^ Hurricane Specialist Unit (August 1, 2019). Monthly Eastern North Pacific Tropical Weather Summary (Report). National Hurricane Center. Retrieved August 3, 2019.
- ^ David Zelinsky (September 2, 2019). "Hurricane Juliette Advisory Number 7". www.nhc.noaa.gov. Miami, Florida: National Hurricane Center. Retrieved September 2, 2019.
- ^ Andrew S. Latto (August 22, 2019). Tropical Cyclone Report: Hurricane Alvin (PDF) (Report). National Hurricane Center. Retrieved April 6, 2020.
- ^ John P. Cangialosi (August 25, 2019). Tropical Cyclone Report: Hurricane Barbara (PDF) (Report). National Hurricane Center. Retrieved April 6, 2020.
- ^ Burke, Bob (July 8, 2019). "Area Forecast Discussion". National Weather Service Raw Text Product. Ames, Iowa: Iowa State University. Retrieved July 9, 2019.
- ^ "Power Interrupted as Storm Remnants Hit Hawaii's Big Island". The New York Times. Associated Press. July 8, 2019. Retrieved July 9, 2019. (subscription required)
- ^ David A. Zelinsky (August 19, 2019). Tropical Cyclone Report: Tropical Storm Cosme (PDF) (Report). National Hurricane Center. Retrieved April 6, 2020.
- ^ Robbie J. Berg (August 6, 2019). Tropical Cyclone Report: Tropical Depression Four-E (PDF) (Report). National Hurricane Center. Retrieved April 6, 2020.
- ^ Lixion A. Avila (August 9, 2019). Tropical Cyclone Report: Tropical Storm Dalila (PDF) (Report). National Hurricane Center. Retrieved April 6, 2020.
- ^ Eric S. Blake; Derek Wroe (April 23, 2021). Tropical Cyclone Report: Hurricane Erick (PDF) (Report). National Hurricane Center. Retrieved April 24, 2021.
- ^ Richard J. Pasch; David P. Roberts (January 9, 2020). Tropical Cyclone Report: Hurricane Flossie (PDF) (Report). National Hurricane Center. Retrieved April 6, 2020.
- ^ John L. Beven II (January 10, 2020). Tropical Cyclone Report: Tropical Storm Gil (PDF) (Report). National Hurricane Center. Retrieved April 6, 2020.
- ^ Stacy R. Stewart (October 8, 2019). Tropical Cyclone Report: Tropical Storm Henriette (PDF) (Report). National Hurricane Center. Retrieved April 6, 2020.
- ^ Daniel P. Brown (November 7, 2019). Tropical Cyclone Report: Tropical Storm Ivo (PDF) (Report). National Hurricane Center. Retrieved April 6, 2020.
- ^ Andrew S. Latto (December 10, 2019). Tropical Cyclone Report: Hurricane Juliette (PDF) (Report). National Hurricane Center. Retrieved April 6, 2020.
- ^ Eric Blake; Daniel Brown (September 4, 2019). Tropical Weather Outlook (Report). National Hurricane Center. Retrieved November 20, 2019.
- ^ David Zelinsky (September 4, 2019). Tropical Depression Twelve-E Discussion Number 1. www.nhc.noaa.gov (Report). Miami, Florida: National Hurricane Center. Retrieved September 4, 2019.
- ^ Ballard (September 5, 2019). Tropical Storm Akoni Discussion Number 7. www.nhc.noaa.gov (Report). Miami, Florida: National Hurricane Center. Retrieved November 20, 2019.
- ^ Tom Birchard (September 6, 2019). Post-Tropical Cyclone Akoni Discussion Number 10. www.nhc.noaa.gov (Report). Miami, Florida: National Hurricane Center. Retrieved September 7, 2019.
- ^ David A. Zelinsky (January 10, 2020). Tropical Cyclone Report: Hurricane Kiko (PDF) (Report). National Hurricane Center. Retrieved April 6, 2020.
- ^ Lixion A. Avila (October 30, 2019). Tropical Cyclone Report: Hurricane Lorena (PDF) (Report). National Hurricane Center. Retrieved April 6, 2020.
- ^ Robbie J. Berg (November 7, 2019). Tropical Cyclone Report: Tropical Storm Mario (PDF) (Report). National Hurricane Center. Retrieved April 6, 2020.
- ^ Eric S. Blake (November 15, 2019). Tropical Cyclone Report: Tropical Storm Narda (PDF) (Report). National Hurricane Center. Retrieved April 7, 2020.
- ^ Jump up to: a b "'Narda' deja tres muertos tras su paso por Oaxaca y Colima" (in Spanish). Noticieros Televisa. October 1, 2019. Retrieved October 1, 2019.
- ^ Sergio Ocampo Arista (October 1, 2019). "Tormenta tropical 'Narda' deja un muerto en Malinaltepec, Guerrero". La Jornada (in Spanish). Archived from the original on 2019-10-02. Retrieved October 1, 2019.
- ^ Jon Jelsema (October 12, 2019). Tropical Storm Ema Discussion Number 1 (Report). Miami, Florida: National Hurricane Center. Retrieved November 20, 2019.
- ^ Jon Jelsema (October 14, 2019). Post-Tropical Cyclone Ema Discussion Number 8 (Report). Central Pacific Hurricane Center. Retrieved October 14, 2019.
- ^ John L. Beven II (January 24, 2020). Tropical Cyclone Report: Tropical Storm Octave (PDF) (Report). National Hurricane Center. Retrieved April 7, 2020.
- ^ Stacy R. Stewart (December 9, 2019). Tropical Cyclone Report: Tropical Storm Priscilla (PDF) (Report). National Hurricane Center. Retrieved April 7, 2020.
- ^ Stacy Stewart (October 20, 2019). Tropical Depression Priscilla Advisory Number 3 (Report). Miami, Florida: National Hurricane Center. Retrieved October 21, 2019.
- ^ Daniel P. Brown (January 13, 2020). Tropical Cyclone Report: Tropical Storm Raymond (PDF) (Report). National Hurricane Center. Retrieved April 7, 2020.
- ^ EST, Soo Kim On 11/20/19 at 12:25 PM (2019-11-20). "A Flash Flood Watch has been issued across parts of Southern California, Arizona, Nevada and Utah". Newsweek. Retrieved 2019-11-21.
- ^ "Double whammy of heavy snow, flooding rain in western U.S. (forecast video)". FreightWaves. 2019-11-20. Retrieved 2019-11-21.
- ^ Andrew S. Latto (January 7, 2020). Tropical Cyclone Report: Tropical Depression Twenty-One-E (PDF) (Report). National Hurricane Center. Retrieved January 28, 2020.
- ^ Richard J. Pasch (February 28, 2020). Potential Tropical Cyclone Seventeen-E (PDF) (Report). National Hurricane Center. Retrieved April 7, 2020.
- ^ "Inundaciones, evacuados y calles bloqueadas tras fuertes lluvias en el territorio salvadoreño". elsalvador.com (in Spanish). October 15, 2019. Retrieved October 20, 2019.
- ^ "Tropical Cyclone Names". National Hurricane Center. National Oceanic and Atmospheric Administration. April 11, 2013. Archived from the original on April 30, 2013. Retrieved May 8, 2013.
- ^ "Pacific Tropical Cyclone Names 2016-2021". Central Pacific Hurricane Center. National Oceanic and Atmospheric Administration. May 12, 2016. Archived from the original (PHP) on December 4, 2016.
- ^ "Israeli dies in Mexico while saving son from drowning". Times of Israel. September 21, 2019. Retrieved September 26, 2019.
- ^ "Weather, Climate & Catastrophe Insight - 2019 Annual Report" (PDF). AON Impact Forecasting. Jan 22, 2020. Retrieved March 28, 2021.
- ^ Sergio Ocampo Arista (October 1, 2019). "Tormenta tropical 'Narda' deja un muerto en Malinaltepec, Guerrero". La Jornada (in Spanish). Archived from the original on October 2, 2019. Retrieved October 1, 2019.
- ^ Sergio Ocampo Arista (October 3, 2019). "Dos personas han fallecido en México debido a la fuerte tormenta tropical" (in Spanish). La Vanguardia. Retrieved October 3, 2019.
External links[]
| Wikimedia Commons has media related to 2019 Pacific hurricane season. |
- National Hurricane Center Website
- National Hurricane Center's Eastern Pacific Tropical Weather Outlook
- Servicio Meteorológico Nacional Website (in Spanish)
- Joint Typhoon Warning Center Archived 2018-02-02 at the Wayback Machine
- NHC 2019 Pacific hurricane season archive
| show Tropical cyclones of the 2019 Pacific hurricane season |
|---|

- 2019 Pacific hurricane season
- Pacific hurricane seasons
- Tropical cyclones in 2019