Basic reproduction number
In epidemiology, the basic reproduction number, or basic reproductive number (sometimes called basic reproduction ratio or incorrectly[1] basic reproductive rate), denoted (pronounced R nought or R zero),[2] of an infection is the expected number of cases directly generated by one case in a population where all individuals are susceptible to infection.[3] The definition assumes that no other individuals are infected or immunized (naturally or through vaccination). Some definitions, such as that of the Australian Department of Health, add the absence of "any deliberate intervention in disease transmission".[4] The basic reproduction number is not necessarily the same as the effective reproduction number (usually written [t for time], sometimes ),[5] which is the number of cases generated in the current state of a population, which does not have to be the uninfected state. is a dimensionless number (persons infected per person infecting) and not a time rate, which would have units of time−1,[6] or units of time like doubling time.[7]


is not a biological constant for a pathogen as it is also affected by other factors such as environmental conditions and the behaviour of the infected population. values are usually estimated from mathematical models, and the estimated values are dependent on the model used and values of other parameters. Thus values given in the literature only make sense in the given context and it is recommended not to use obsolete values or compare values based on different models.[8] does not by itself give an estimate of how fast an infection spreads in the population.
The most important uses of are determining if an emerging infectious disease can spread in a population and determining what proportion of the population should be immunized through vaccination to eradicate a disease. In commonly used infection models, when the infection will be able to start spreading in a population, but not if . Generally, the larger the value of , the harder it is to control the epidemic. For simple models, the proportion of the population that needs to be effectively immunized (meaning not susceptible to infection) to prevent sustained spread of the infection has to be larger than .[9] Conversely, the proportion of the population that remains susceptible to infection in the endemic equilibrium is .


The basic reproduction number is affected by several factors, including the duration of infectivity of affected people, the infectiousness of the microorganism, and the number of susceptible people in the population that the infected people contact.
History[]
The roots of the basic reproduction concept can be traced through the work of Ronald Ross, Alfred Lotka and others,[10] but its first modern application in epidemiology was by George Macdonald in 1952,[11] who constructed population models of the spread of malaria. In his work he called the quantity basic reproduction rate and denoted it by . "Rate" in this context means per person, which makes dimensionless as required. Because this can be misleading to anyone who understands "rate" only in the sense per unit of time, "number" or "ratio" is now preferred.[citation needed]

Definitions in specific cases[]
Contact rate and infectious period[]
Suppose that infectious individuals make an average of infection-producing contacts per unit time, with a mean infectious period of . Then the basic reproduction number is:


where is the rate of contact between susceptible and infected individuals and is the transmissibility, i.e, the probability of infection given a contact. It is also possible to decrease the infectious period by finding and then isolating, treating or eliminating (as is often the case with animals) infectious individuals as soon as possible.[citation needed]


With varying latent periods[]
Latent period is the transition time between contagion event and disease manifestation. In cases of diseases with varying latent periods, the basic reproduction number can be calculated as the sum of the reproduction numbers for each transition time into the disease. An example of this is tuberculosis (TB). Blower and coauthors calculated from a simple model of TB the following reproduction number:[13]

Heterogeneous populations[]
In populations that are not homogeneous, the definition of is more subtle. The definition must account for the fact that a typical infected individual may not be an average individual. As an extreme example, consider a population in which a small portion of the individuals mix fully with one another while the remaining individuals are all isolated. A disease may be able to spread in the fully mixed portion even though a randomly selected individual would lead to fewer than one secondary case. This is because the typical infected individual is in the fully mixed portion and thus is able to successfully cause infections. In general, if the individuals infected early in an epidemic are on average either more likely or less likely to transmit the infection than individuals infected late in the epidemic, then the computation of must account for this difference. An appropriate definition for in this case is "the expected number of secondary cases produced, in a completely susceptible population, produced by a typical infected individual".[15]
The basic reproduction number can be computed as a ratio of known rates over time: if an infectious individual contacts other people per unit time, if all of those people are assumed to contract the disease, and if the disease has a mean infectious period of , then the basic reproduction number is just . Some diseases have multiple possible latency periods, in which case the reproduction number for the disease overall is the sum of the reproduction number for each transition time into the disease. For example, Blower et al.[13] model two forms of tuberculosis infection: in the fast case, the symptoms show up immediately after exposure; in the slow case, the symptoms develop years after the initial exposure (endogenous reactivation). The overall reproduction number is the sum of the two forms of contraction: .


Estimation methods[]
The basic reproduction number can be estimated through examining detailed transmission chains or through genomic sequencing. However, it is most frequently calculated using epidemiological models.[16] During an epidemic, typically the number of diagnosed infections over time is known. In the early stages of an epidemic, growth is exponential, with a logarithmic growth rate


In exponential growth, is related to the doubling time as


Simple model[]
If an individual, after getting infected, infects exactly new individuals only after exactly a time (the serial interval) has passed, then the number of infectious individuals over time grows as


For example, with and , we would find .


If is time dependent


Latent infectious period, isolation after diagnosis[]
In this model, an individual infection has the following stages:
- Exposed: an individual is infected, but has no symptoms and does not yet infect others. The average duration of the exposed state is .
- Latent infectious: an individual is infected, has no symptoms, but does infect others. The average duration of the latent infectious state is . The individual infects other individuals during this period.
- Isolation after diagnosis: measures are taken to prevent further infections, for example by isolating the infected person.


This is a SEIR model and may be written in the following form[17]


In the special case , this model results in , which is different from the simple model above (). For example, with the same values and , we would find , rather than the true value of . The difference is due to a subtle difference in the underlying growth model; the matrix equation above assumes that newly infected patients are currently already contributing to infections, while in fact infections only occur due to the number infected at ago. A more correct treatment would require the use of delay differential equations.[18]


Effective reproduction number[]
In reality, varying proportions of the population are immune to any given disease at any given time. To account for this, the effective reproduction number is used, usually written as , or the average number of new infections caused by a single infected individual at time t in the partially susceptible population. It can be found by multiplying by the fraction S of the population that is susceptible. When the fraction of the population that is immune increases (i. e. the susceptible population S decreases) so much that drops below 1, "herd immunity" has been achieved and the number of cases occurring in the population will gradually decrease to zero.[19][20][21]
Limitations of R0[]
Use of in the popular press has led to misunderstandings and distortions of its meaning. can be calculated from many different mathematical models. Each of these can give a different estimate of , which needs to be interpreted in the context of that model. Therefore, the contagiousness of different infectious agents cannot be compared without recalculating with invariant assumptions. values for past outbreaks might not be valid for current outbreaks of the same disease. Generally speaking, can be used as a threshold, even if calculated with different methods: if , the outbreak will die out, and if , the outbreak will expand. In some cases, for some models, values of can still lead to self-perpetuating outbreaks. This is particularly problematic if there are intermediate vectors between hosts, such as malaria.[22] Therefore, comparisons between values from the "Values of of well-known infectious diseases" table should be conducted with caution.
Although cannot be modified through vaccination or other changes in population susceptibility, it can vary based on a number of biological, sociobehavioral, and environmental factors.[8] It can also be modified by physical distancing and other public policy or social interventions,[23][8] although some historical definitions exclude any deliberate intervention in reducing disease transmission, including nonpharmacological interventions.[4] And indeed, whether nonpharmacological interventions are included in often depends on the paper, disease, and what if any intervention is being studied.[8] This creates some confusion, because is not a constant; whereas most mathematical parameters with "nought" subscripts are constants.
depends on many factors, many of which need to be estimated. Each of these factors adds to uncertainty in estimates of . Many of these factors are not important for informing public policy. Therefore, public policy may be better served by metrics similar to , but which are more straightforward to estimate, such as doubling time or half-life ().[24][25]

Methods used to calculate include the survival function, rearranging the largest eigenvalue of the Jacobian matrix, the next-generation method,[26] calculations from the intrinsic growth rate,[27] existence of the endemic equilibrium, the number of susceptibles at the endemic equilibrium, the average age of infection[28] and the final size equation. Few of these methods agree with one another, even when starting with the same system of differential equations.[22] Even fewer actually calculate the average number of secondary infections. Since is rarely observed in the field and is usually calculated via a mathematical model, this severely limits its usefulness.[29]
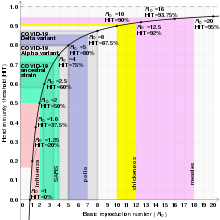
Sample values for various infectious diseases[]
| Disease | Transmission | R0 | HIT[a] |
|---|---|---|---|
| Measles | Aerosol | 12–18[30][31] | 92–94% |
| Chickenpox (varicella) | Aerosol | 10–12[32] | 90–92% |
| Mumps | Respiratory droplets | 10–12[33] | 90–92% |
| Rubella | Respiratory droplets | 6–7[b] | 83–86% |
| COVID-19 (Delta variant) | Respiratory droplets and aerosol | 5–8[38] | 80–88% |
| Polio | Fecal–oral route | 5–7[b] | 80–86% |
| Pertussis | Respiratory droplets | 5.5[39] | 82% |
| Smallpox | Respiratory droplets | 3.5–6.0[40] | 71–83% |
| COVID-19 (Alpha variant) | Respiratory droplets and aerosol | 4–5[38] | 75–80% |
| HIV/AIDS | Body fluids | 2–5[41] | 50–80% |
| COVID-19 (ancestral strain) | Respiratory droplets and aerosol[42] | 2.87 (2.39–3.44)[43] | 65% (58–71%) |
| SARS | Respiratory droplets | 2–4[44] | 50–75% |
| Diphtheria | Saliva | 2.6 (1.7–4.3)[45] | 62% (41–77%) |
| Common cold | Respiratory droplets | 2–3[46] | 50–67% |
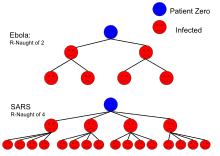
| Ebola (2014 outbreak) | Body fluids | 1.78 (1.44–1.80)[47] | 44% (31–44%) |
| Influenza (2009 pandemic strain) | Respiratory droplets | 1.58 (1.34–2.04)[3] | 37% (25–51%) |
| Influenza (seasonal strains) | Respiratory droplets | 1.3 (1.2–1.4)[48] | 23% (17–29%) |
| Andes hantavirus | Respiratory droplets and body fluids | 1.19 (0.82–1.56)[49] | 16% (0–36%)[c] |
| Nipah virus | Body fluids | 0.48[50] | 0%[c] |
| MERS | Respiratory droplets | 0.47 (0.29–0.80)[51] | 0%[c] |
In popular culture[]
In the 2011 film Contagion, a fictional medical disaster thriller, a blogger's calculations for are presented to reflect the progression of a fatal viral infection from case studies to a pandemic. The methods depicted were faulty.[23]
See also[]
- Compartmental models in epidemiology
- E-epidemiology
- Epi Info software program
- Epidemiological method
- Epidemiological transition
Notes[]
- ^ Calculated using p = 1 - 1 / R0.
- ^ Jump up to: a b From a module of a training course[34] with data modified from other sources.[35][36][37]
- ^ Jump up to: a b c When R0 < 1.0, the disease naturally disappears.
- Compartmental models in epidemiology describe disease dynamics over time in a population of susceptible (S), infectious (I), and recovered (R) people using the SIR model. Note that in the SIR model, and are different quantities – the former describes the number of recovered at t = 0 whereas the latter describes the ratio between the frequency of contacts to the frequency of recovery.
- Held L, Hens N, O'Neill PD, Wallinga J (November 7, 2019). Handbook of Infectious Disease Data Analysis. CRC Press. p. 347. ISBN 978-1-351-83932-7. According to Guangdong Provincial Center for Disease Control and Prevention, "The effective reproductive number (R or Re is more commonly used to describe transmissibility, which is defined as the average number of secondary cases generated by per [sic] infectious case." For example, by one preliminary estimate during the ongoing pandemic, the effective reproductive number for SARS-CoV-2 was found to be 2.9,[citation needed] whereas for SARS it was 1.77.

References[]
- ^ James Holland Jones: Notes on R0 California: Department of Anthropological Sciences (2007), p. 1.
- ^ Milligan GN, Barrett AD (2015). Vaccinology : an essential guide. Chichester, West Sussex: Wiley Blackwell. p. 310. ISBN 978-1-118-63652-7. OCLC 881386962.
- ^ Jump up to: a b Fraser C, Donnelly CA, Cauchemez S, Hanage WP, Van Kerkhove MD, Hollingsworth TD, et al. (June 2009). "Pandemic potential of a strain of influenza A (H1N1): early findings". Science. 324 (5934): 1557–61. Bibcode:2009Sci...324.1557F. doi:10.1126/science.1176062. PMC 3735127. PMID 19433588.
- ^ Jump up to: a b Becker NG, Glass K, Barnes B, Caley P, Philp D, McCaw JM, et al. (April 2006). "The reproduction number". Using Mathematical Models to Assess Responses to an Outbreak of an Emerged Viral Respiratory Disease. National Centre for Epidemiology and Population Health. ISBN 1-74186-357-0. Retrieved February 1, 2020.
- ^ Adam D (July 2020). "A guide to R - the pandemic's misunderstood metric". Nature. 583 (7816): 346–348. Bibcode:2020Natur.583..346A. doi:10.1038/d41586-020-02009-w. PMID 32620883.
- ^ Jones J. "Notes On R0" (PDF). Stanford University.
- ^ Siegel E. "Why 'Exponential Growth' Is So Scary For The COVID-19 Coronavirus". Forbes. Retrieved March 19, 2020.
- ^ Jump up to: a b c d Delamater PL, Street EJ, Leslie TF, Yang YT, Jacobsen KH (January 2019). "Complexity of the Basic Reproduction Number (R0)". Emerging Infectious Diseases. 25 (1): 1–4. doi:10.3201/eid2501.171901. PMC 6302597. PMID 30560777.
- ^ Fine, P.; Eames, K.; Heymann, D. L. (April 1, 2011). "'Herd Immunity': A Rough Guide". Clinical Infectious Diseases. 52 (7): 911–916. doi:10.1093/cid/cir007. PMID 21427399.
- ^ Smith DL, Battle KE, Hay SI, Barker CM, Scott TW, McKenzie FE (April 5, 2012). "Ross, macdonald, and a theory for the dynamics and control of mosquito-transmitted pathogens". PLOS Pathogens. 8 (4): e1002588. doi:10.1371/journal.ppat.1002588. PMC 3320609. PMID 22496640.
- ^ Macdonald G (September 1952). "The analysis of equilibrium in malaria". Tropical Diseases Bulletin. 49 (9): 813–29. PMID 12995455.
- ^ J.H. Jones, Notes on R0. Stanford University (2007).
- ^ Jump up to: a b Blower SM, McLean AR, Porco TC, Small PM, Hopewell PC, Sanchez MA, Moss AR (August 1995). "The intrinsic transmission dynamics of tuberculosis epidemics". Nature Medicine. 1 (8): 815–21. doi:10.1038/nm0895-815. PMID 7585186. S2CID 19795498.
- ^ Ma Y, Horsburgh CR, White LF, Jenkins HE (September 2018). "Quantifying TB transmission: a systematic review of reproduction number and serial interval estimates for tuberculosis". Epidemiology and Infection. 146 (12): 1478–1494. doi:10.1017/S0950268818001760. PMC 6092233. PMID 29970199.
- ^ Diekmann O, Heesterbeek JA, Metz JA (1990). "On the definition and the computation of the basic reproduction ratio R0 in models for infectious diseases in heterogeneous populations". Journal of Mathematical Biology. 28 (4): 365–82. doi:10.1007/BF00178324. hdl:1874/8051. PMID 2117040. S2CID 22275430.
- ^ Wohl S, Schaffner SF, Sabeti PC (September 2016). "Genomic Analysis of Viral Outbreaks". Annual Review of Virology. 3 (1): 173–195. doi:10.1146/annurev-virology-110615-035747. PMC 5210220. PMID 27501264.
- ^ Lipsitch M, Cohen T, Cooper B, Robins JM, Ma S, James L, et al. (June 2003). "Transmission dynamics and control of severe acute respiratory syndrome". Science. 300 (5627): 1966–70. Bibcode:2003Sci...300.1966L. doi:10.1126/science.1086616. PMC 2760158. PMID 12766207.
- ^ Rihan, Fathalla A.; Anwar, M. Naim (2012). "Qualitative Analysis of Delayed SIR Epidemic Model with a Saturated Incidence Rate". International Journal of Differential Equations. 2012: 1–13. doi:10.1155/2012/408637.
- ^ Garnett GP (February 2005). "Role of herd immunity in determining the effect of vaccines against sexually transmitted disease". The Journal of Infectious Diseases. 191 (Suppl 1): S97-106. doi:10.1086/425271. PMID 15627236.
- ^ Rodpothong P, Auewarakul P (October 2012). "Viral evolution and transmission effectiveness". World Journal of Virology. 1 (5): 131–4. doi:10.5501/wjv.v1.i5.131. PMC 3782273. PMID 24175217.
- ^ Dabbaghian V, Mago VK (2013). Theories and Simulations of Complex Social Systems. Springer. pp. 134–35. ISBN 978-3642391491. Retrieved March 29, 2015.
- ^ Jump up to: a b Li J, Blakeley D, Smith RJ (2011). "The failure of R0". Computational and Mathematical Methods in Medicine. 2011 (527610): 527610. doi:10.1155/2011/527610. PMC 3157160. PMID 21860658.
- ^ Jump up to: a b {{citation |title= The Misunderstood Number That Predicts Epidemics | vauthors = Byrne M |date= October 6, 2014 |work=vice.com |url= https://www.vice.com/en_us/article/pgazpv/meet-r-nought-the-magic-number-that-spreads-infectious-diseases |access-date= 2020-03-23}Rudy'sisthe
- gtdgere}
- ^ Balkew TM (December 2010). The SIR Model When S(t) is a Multi-Exponential Function (Thesis). East Tennessee State University.
- ^ Ireland MW, ed. (1928). The Medical Department of the United States Army in the World War, vol. IX: Communicable and Other Diseases. Washington: U.S.: U.S. Government Printing Office. pp. 116–7.
- ^ Diekmann O, Heesterbeek JA (2000). "The Basic Reproduction Ratio". Mathematical Epidemiology of Infectious Diseases : Model Building, Analysis and Interpretation. New York: Wiley. pp. 73–98. ISBN 0-471-49241-8.
- ^ Chowell G, Hengartner NW, Castillo-Chavez C, Fenimore PW, Hyman JM (July 2004). "The basic reproductive number of Ebola and the effects of public health measures: the cases of Congo and Uganda". Journal of Theoretical Biology. 229 (1): 119–26. arXiv:q-bio/0503006. Bibcode:2004JThBi.229..119C. doi:10.1016/j.jtbi.2004.03.006. PMID 15178190. S2CID 7298792.
- ^ Ajelli M, Iannelli M, Manfredi P, Ciofi degli Atti ML (March 2008). "Basic mathematical models for the temporal dynamics of HAV in medium-endemicity Italian areas". Vaccine. 26 (13): 1697–707. doi:10.1016/j.vaccine.2007.12.058. PMID 18314231.
- ^ Heffernan JM, Smith RJ, Wahl LM (September 2005). "Perspectives on the basic reproductive ratio". Journal of the Royal Society, Interface. 2 (4): 281–93. doi:10.1098/rsif.2005.0042. PMC 1578275. PMID 16849186.
- ^ Guerra FM, Bolotin S, Lim G, Heffernan J, Deeks SL, Li Y, Crowcroft NS (December 2017). "The basic reproduction number (R0) of measles: a systematic review". The Lancet. Infectious Diseases. 17 (12): e420–e428. doi:10.1016/S1473-3099(17)30307-9. PMID 28757186.
- ^ Delamater PL, Street EJ, Leslie TF, Yang YT, Jacobsen KH (January 2019). "Complexity of the Basic Reproduction Number (R0)". Emerging Infectious Diseases. 25 (1): 1–4. doi:10.3201/eid2501.171901. PMC 6302597. PMID 30560777.
- ^ Ireland's Health Services. Health Care Worker Information (PDF). Retrieved March 27, 2020.
- ^ Australian government Department of Health Mumps Laboratory Case Definition (LCD)
- ^ Centers for Disease Control and Prevention; World Health Organization (2001). "History and epidemiology of global smallpox eradication". Smallpox: disease, prevention, and intervention (training course) (Presentation). Atlanta: Centers for Disease Control and Prevention (published August 25, 2014). cdc:27929. Archived (PDF) from the original on March 17, 2017. Retrieved June 17, 2021.
- ^ Fine, Paul E. M. (1993). "Herd Immunity: History, Theory, Practice". Epidemiologic Reviews. 15 (2): 265–302. doi:10.1093/oxfordjournals.epirev.a036121. PMID 8174658.
- ^ Luman, ET; Barker, LE; Simpson, DM; Rodewald, LE; Szilagyi, PG; Zhao, Z (May 2001). "National, state, and urban-area vaccination-coverage levels among children aged 19–35 months, United States, 1999". American Journal of Preventive Medicine. 20 (4): 88–153. doi:10.1016/s0749-3797(01)00274-4. PMID 12174806.
- ^ Jiles, RB; Fuchs, C; Klevens, RM (September 22, 2000). "Vaccination coverage among children enrolled in Head Start programs or day care facilities or entering school". Morbidity and Mortality Weekly Report. 49 (9): 27–38. PMID 11016876.
- ^ Jump up to: a b Gallagher, James (June 12, 2021). "Covid: Is there a limit to how much worse variants can get?". BBC News. Retrieved July 21, 2021.
- ^ Kretzschmar M, Teunis PF, Pebody RG (June 2010). "Incidence and reproduction numbers of pertussis: estimates from serological and social contact data in five European countries". PLOS Medicine. 7 (6): e1000291. doi:10.1371/journal.pmed.1000291. PMC 2889930. PMID 20585374.
- ^ Gani R, Leach S (December 2001). "Transmission potential of smallpox in contemporary populations". Nature. 414 (6865): 748–51. Bibcode:2001Natur.414..748G. doi:10.1038/414748a. PMID 11742399. S2CID 52799168. Retrieved March 18, 2020.
- ^ "Playing the Numbers Game: R0". National Emerging Special Pathogen Training and Education Center. Archived from the original on May 12, 202. Retrieved December 27, 2020.
[...] while infections that require sexual contact like HIV have a lower R0 (2-5).
- ^ Prather, Kimberly A.; Marr, Linsey C.; Schooley, Robert T.; McDiarmid, Melissa A.; Wilson, Mary E.; Milton, Donald K. (October 16, 2020). "Airborne transmission of SARS-CoV-2". Science. 370 (6514): 303.2–304. Bibcode:2020Sci...370..303P. doi:10.1126/science.abf0521. PMID 33020250. S2CID 222145689.
- ^ Billah, Arif; Miah, Mamun; Khan, Nuruzzaman (November 11, 2020). "Reproductive number of coronavirus: A systematic review and meta-analysis based on global level evidence". PLOS ONE. 15 (11): e0242128. Bibcode:2020PLoSO..1542128B. doi:10.1371/journal.pone.0242128. PMC 7657547. PMID 33175914.
- ^ Consensus document on the epidemiology of severe acute respiratory syndrome (SARS). Department of Communicable Disease Surveillance and Response (Technical report). World Health Organization. p. 26. hdl:10665/70863. WHO/CDS/CSR/GAR/2003.11.
A number of researchers have estimated the basic reproduction number by fitting models to the initial growth of epidemics in a number of countries. Their observations indicate that the SARS-CoV is less transmissible than initially thought with estimates of Ro in the range of 2-4.
- ^ Truelove SA, Keegan LT, Moss WJ, Chaisson LH, Macher E, Azman AS, Lessler J (June 2020). "Clinical and Epidemiological Aspects of Diphtheria: A Systematic Review and Pooled Analysis". Clinical Infectious Diseases. 71 (1): 89–97. doi:10.1093/cid/ciz808. PMC 7312233. PMID 31425581.
- ^ Freeman C. "Magic formula that will determine whether Ebola is beaten". The Telegraph. Telegraph.Co.Uk. Retrieved March 30, 2020.
- ^ Wong ZS, Bui CM, Chughtai AA, Macintyre CR (April 2017). "A systematic review of early modelling studies of Ebola virus disease in West Africa". Epidemiology and Infection. 145 (6): 1069–1094. doi:10.1017/S0950268817000164. PMID 28166851.
The median of the R0 mean estimate for the ongoing epidemic (overall) is 1.78 (interquartile range: 1.44, 1.80)
- ^ Chowell G, Miller MA, Viboud C (June 2008). "Seasonal influenza in the United States, France, and Australia: transmission and prospects for control". Epidemiology and Infection. Cambridge University Press. 136 (6): 852–64. doi:10.1017/S0950268807009144. PMC 2680121. PMID 17634159.
The reproduction number across influenza seasons and countries lied in the range 0.9–2.0 with an overall mean of 1.3, and 95% confidence interval (CI) 1.2–1.4.
- ^ Martínez, Valeria P.; Di Paola, Nicholas; Alonso, Daniel O.; Pérez-Sautu, Unai; Bellomo, Carla M.; Iglesias, Ayelén A.; et al. (December 3, 2020). "'Super-Spreaders' and Person-to-Person Transmission of Andes Virus in Argentina". New England Journal of Medicine. 383 (23): 2230–2241. doi:10.1056/NEJMoa2009040. PMID 33264545. S2CID 227259435.
- ^ Luby SP (October 2013). "The pandemic potential of Nipah virus". Antiviral Research. 100 (1): 38–43. doi:10.1016/j.antiviral.2013.07.011. PMID 23911335.
- ^ Kucharski AJ, Althaus CL (June 2015). "The role of superspreading in Middle East respiratory syndrome coronavirus (MERS-CoV) transmission". Euro Surveillance. 20 (25): 14–8. doi:10.2807/1560-7917.ES2015.20.25.21167. PMID 26132768.
Further reading[]
| Scholia has a profile for basic reproduction number (Q901464). |
- Heesterbeek, J.A.P. (2002). "A brief history of R0 and a recipe for its calculation". Acta Biotheoretica. 50 (3): 189–204. doi:10.1023/a:1016599411804. hdl:1874/383700. PMID 12211331. S2CID 10178944.
- Heffernan, J.M; Smith, R.J; Wahl, L.M (September 22, 2005). "Perspectives on the basic reproductive ratio". Journal of the Royal Society Interface. 2 (4): 281–293. doi:10.1098/rsif.2005.0042. PMC 1578275. PMID 16849186.
- Jones JH (May 1, 2007). "Notes on " (PDF). Retrieved November 6, 2018.
- Van Den Driessche, P.; Watmough, James (2008). "Further Notes on the Basic Reproduction Number". Mathematical Epidemiology. Lecture Notes in Mathematics. 1945. pp. 159–178. doi:10.1007/978-3-540-78911-6_6. ISBN 978-3-540-78910-9.
- Epidemiology
- Epidemics
- Pandemics
- Disease ecology