Canadian federal election results in Winnipeg
This article does not cite any sources. (December 2009) |
This article needs to be updated. (February 2020) |
| Year | Results | ||||||||
|---|---|---|---|---|---|---|---|---|---|
| 2021 | |||||||||
| 2019 | |||||||||
| 2015 | |||||||||
| 2011 | |||||||||
| 2008 | |||||||||
| 2006 | |||||||||
| 2004 | |||||||||
| 2000 | |||||||||
| 1997 | |||||||||
| 1993 | |||||||||
| 1988 | |||||||||
| 1984 | |||||||||
| 1980 | |||||||||
| 1979 | |||||||||
| 1974 | |||||||||
| 1972 | |||||||||
| 1968 | |||||||||
| 1965 | |||||||||
| 1963 | |||||||||
| 1962 | |||||||||
| 1958 | |||||||||
| 1957 | |||||||||
| 1953 | |||||||||
| 1949 | |||||||||
| 1945 | |||||||||
| 1940 | |||||||||
| 1935 | |||||||||
| 1930 | |||||||||
| 1926 | |||||||||
| 1925 |
This is page shows results of Canadian federal elections in the Winnipeg area.
Regional profile[]
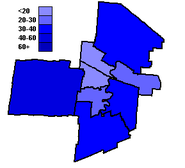
The city of Winnipeg has traditionally been a mixed bag, in which all three major parties have bases of support. The northern part of the city is a very left-leaning area which has some of the strongest New Democratic Party support in all of Canada. The south end (with many Jewish and Franco-Manitoban voters) is one of the few areas in the Prairies where the Liberals have been successful since the 1990s. The outer suburban areas tilt rightward, but this was obscured for most of the 1990s by massive vote-splitting.
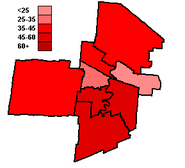
The end of vote-splitting on the right allowed the Conservatives to win two seats in 2004, in one case defeating a star candidate. The Conservatives picked up another seat in 2006, one more in 2008 and two additional seats in 2011—including Elmwood—Transcona, the former seat of longtime NDP MP and former deputy leader Bill Blaikie. In 2015, however, the Liberals took all but one seat in Winnipeg en route to their second-largest seat count ever. The only seat that didn't get swept up in the Liberal tide was Elmwood—Transcona, where Blaikie's son Daniel Blaikie narrowly retook the seat for the NDP. It was the first time since 1968, and only the second time since the end of World War II, that the centre-right was completely shut out of Winnipeg in the absence of vote-splitting. The Tories picked up the outer suburban seats of Charleswood—St. James—Assiniboia—Headingley and Kildonan—St. Paul in 2019.
2015 - 42nd General Election[]
| Electoral district | Candidates | Incumbent | ||||||||||
|---|---|---|---|---|---|---|---|---|---|---|---|---|
| Conservative | NDP | Liberal | Green | Other | ||||||||
| Charleswood—St. James—Assiniboia— Headingley |
Steven Fletcher 18,408 39.04% |
Tom Paulley 2,842 6.03% |
Doug Eyolfson 24,531 52.02% |
Kevin Nichols 1,376 2.92% |
Steven Fletcher Charleswood—St. James—Assiniboia | |||||||
| Elmwood—Transcona | Lawrence Toet 14,648 34.00% |
Daniel Blaikie 14,709 34.14% |
Andrea Richardson-Lipon 12,713 29.35% |
Kim Parke 1,016 2.36% |
Lawrence Toet | |||||||
| Kildonan—St. Paul | Jim Bell 17,478 39.84% |
Suzanne Hrynyk 6,270 14.29% |
MaryAnn Mihychuk 18,717 42.66% |
Steven Stairs 783 1.78% |
Eduard Walter Hiebert (Ind.) 142 0.32% |
Joy Smith† | ||||||
| David Reimer (CHP) 485 1.11% | ||||||||||||
| Saint Boniface—Saint Vital | François Catellier 14,005 28.69% |
Erin Selby 5,169 10.59% |
Dan Vandal 28,530 58.44% |
Glenn Zaretski 1,119 2.29% |
Shelly Glover† Saint Boniface | |||||||
| Winnipeg Centre | Allie Szarkiewicz 4,189 12.36% |
Pat Martin 9,490 28.01% |
Robert-Falcon Ouellette 18,471 54.51% |
Don Woodstock 1,379 4.07% |
Scott Miller (CHP) 221 0.65% |
Pat Martin | ||||||
| Darrell Rankin (Comm.) 135 0.40% | ||||||||||||
| Winnipeg North | Harpreet Turka 5,193 15.29% |
Levy Abad 4,543 13.38% |
Kevin Lamoureux 23,402 68.90% |
John Redekopp 826 2.43% |
Kevin Lamoureux | |||||||
| Winnipeg South | Gordon Giesbrecht 16,709 34.67% |
Brianne Goertzen 2,404 4.99% |
Terry Duguid 28,096 58.29% |
Adam Smith 990 2.05% |
Rod Bruinooge† | |||||||
| Winnipeg South Centre | Joyce Bateman 15,102 28.19% |
Matt Henderson 4,799 8.96% |
Jim Carr 31,993 59.72% |
Andrew Park 1,677 3.13% |
Joyce Bateman | |||||||
2011 - 41st General Election[]
| Electoral district | Candidates | Incumbent | ||||||||||
|---|---|---|---|---|---|---|---|---|---|---|---|---|
| Conservative | Liberal | NDP | Green | Other | ||||||||
| Charleswood—St. James— Assiniboia |
Steven Fletcher 23,264 57.56% |
Rob Clement 7,433 18.39% |
Tom Paulley 8,134 20.12% |
Denali Enns 1,587 3.93% |
Steven Fletcher | |||||||
| Elmwood—Transcona | Lawrence Toet 15,298 46.40% |
Ilona Niemczyk 1,660 5.03% |
Jim Maloway 14,998 45.49% |
Ellen Young 1,017 3.08% |
Jim Maloway | |||||||
| Kildonan—St. Paul | Joy Smith 22,670 58.16% |
Victor Andres 3,199 8.21% |
Rachelle Devine 11,727 30.09% |
Alon David Weinberg 1,020 2.62% |
Eduard Hiebert (Ind.) 145 0.37% |
Joy Smith | ||||||
| Brett Ryall (Ind.) 218 0.56% | ||||||||||||
| Saint Boniface | Shelly Glover 21,737 50.28% |
Raymond Simard 13,314 30.80% |
Patrice Miniely 6,935 16.04% |
Marc Payette 1,245 2.88% |
Shelly Glover | |||||||
| Winnipeg Centre | Bev Pitura 7,173 27.64% |
Allan Wise 2,872 11.07% |
Pat Martin 13,928 53.66% |
Jacqueline Romanow 1,830 7.05% |
Darrell Rankin (Comm.) 152 0.59% |
Pat Martin | ||||||
| Winnipeg North | Ann Matejicka 6,701 26.35% |
Kevin Lamoureux 9,097 35.78% |
Rebecca Blaikie 9,053 35.60% |
John Harvie 458 1.80% |
Frank Komarniski (Comm.) 118 0.46% |
Kevin Lamoureux | ||||||
| Winnipeg South | Rod Bruinooge 22,840 52.24% |
Terry Duguid 14,296 32.70% |
Dave Gaudreau 5,693 13.02% |
Caitlyn McIntyre 889 2.03% |
Rod Bruinooge | |||||||
| Winnipeg South Centre | Joyce Bateman 15,506 38.82% |
Anita Neville 14,784 37.02% |
Dennis Lewycky 7,945 19.89% |
Joshua McNeil 1,383 3.46% |
Lyndon B. Froese (Ind.) 103 0.26% |
Anita Neville | ||||||
| Matt Henderson (Ind.) 218 0.55% | ||||||||||||
2008 - 40th General Election[]
| Electoral district | Candidates | Incumbent | ||||||||||||
|---|---|---|---|---|---|---|---|---|---|---|---|---|---|---|
| Conservative | Liberal | NDP | Green | Christian Heritage | Other | |||||||||
| Charleswood— St. James— Assiniboia |
Steven Fletcher 21,588 53.83% |
Bob Friesen 8,514 21.23% |
Fiona Shiells 7,190 17.93% |
Brian Timlick 2,632 6.56% |
Mark Price 180 0.45% |
Steven Fletcher | ||||||||
| Elmwood—Transcona | Thomas Steen 12,776 40.74% |
Wes Penner 2,079 6.63% |
Jim Maloway 14,355 45.77% |
Chris Hrynkow 1,839 5.86% |
Robert Scott 312 0.99% |
Bill Blaikie† | ||||||||
| Kildonan— St. Paul |
Joy Smith 19,751 53.40% |
Lesley Hughes1 3,009 8.14% |
Ross Eadie 12,093 32.70% |
Kevan Bowkett 1,685 4.56% |
Jordan Loewen 233 0.63% |
Eduard Hiebert (Ind.) 214 0.58% |
Joy Smith | |||||||
| Saint Boniface | Shelly Glover 19,440 46.32% |
Raymond Simard 14,728 35.09% |
Matt Schaubroeck 5,502 13.11% |
Marc Payette 2,104 5.01% |
Justin Gregoire 195 0.46% |
Raymond Simard | ||||||||
| Winnipeg Centre | Kenny Daodu 5,437 21.65% |
Dan Hurley 3,922 15.62% |
Pat Martin 12,285 48.92% |
Jessie Klassen 2,777 11.06% |
Ed Ackerman (Ind.) 135 0.54% |
Pat Martin | ||||||||
| Joe Chan (Ind.) 226 0.90% | ||||||||||||||
| Lyle Morrisseau (FPNP) 212 0.84% | ||||||||||||||
| Darrell Rankin (Comm.) 119 0.47% | ||||||||||||||
| Winnipeg North | Ray Larkin 5,033 22.35% |
Marcelle Marion 2,075 9.22% |
Judy Wasylycia-Leis 14,097 62.61% |
Catherine Johannson 1,070 4.75% |
Frank Komarniski (Comm.) 151 0.67% |
Judy Wasylycia-Leis | ||||||||
| Roger F. Poisson (PPP) 90 0.40% | ||||||||||||||
| Winnipeg South | Rod Bruinooge 19,954 48.84% |
John Loewen 14,221 34.80% |
Sean Robert 4,673 11.44% |
David Cosby 1,839 4.50% |
Heidi Loewen-Steffano 173 0.42% |
Rod Bruinooge | ||||||||
| Winnipeg South Centre | Trevor Kennerd 14,103 36.26% |
Anita Neville 16,438 42.27% |
Rachel Heinrichs 5,490 14.12% |
Vere Scott 2,860 7.35% |
Anita Neville | |||||||||
1 Lesley Hughes was on the ballot as a Liberal candidate, but was disavowed by the party.
2006 - 39th General Election[]
| Electoral district | Candidates | Incumbent | ||||||||||
|---|---|---|---|---|---|---|---|---|---|---|---|---|
| Liberal | Conservative | NDP | Green | Other | ||||||||
| Charleswood—St. James— Assiniboia |
John Loewen 16,099 36.37% |
Steven Fletcher 20,791 46.98% |
Dennis Kshyk 5,669 12.81% |
Mike Johannson 1,700 3.84% |
Steven Fletcher | |||||||
| Elmwood—Transcona | Tanya Parks 4,108 12.31% |
Linda West 10,720 32.13% |
Bill Blaikie 16,967 50.85% |
Tanja Hutter 1,211 3.63% |
Robert Scott (CHP) 363 1.09% |
Bill Blaikie | ||||||
| Kildonan—St. Paul | Terry Duguid 13,597 33.47% |
Joy Smith 17,524 43.13% |
Evelyn Myskiw 8,193 20.17% |
Colleen Zobel 1,101 2.71% |
Eduard Hiebert (Ind.) 213 0.52% |
Joy Smith | ||||||
| Saint Boniface | Raymond Simard 16,417 38.59% |
Ken Cooper 14,893 35.00% |
Mathieu Allard 9,311 21.88% |
Marc Payette 1,640 3.85% |
Jane MacDiarmid (CHP) 285 0.67% |
Raymond Simard | ||||||
| Winnipeg Centre | Ray St. Germain 6,940 24.34% |
Helen Sterzer 5,554 19.48% |
Pat Martin 13,805 48.43% |
Gary Gervais 2,010 7.05% |
Anna-Celestrya Carr (Comm.) 199 0.70% |
Pat Martin | ||||||
| Winnipeg North | Parmjeet Gill 5,752 21.11% |
Garreth McDonald 4,810 17.65% |
Judy Wasylycia-Leis 15,582 57.18% |
David Carey 779 2.86% |
Darrell Rankin (Comm.) 123 0.45% |
Judy Wasylycia-Leis | ||||||
| Eric Truijen (CHP) 207 0.76% | ||||||||||||
| Winnipeg South | Reg Alcock 17,217 41.15% |
Rod Bruinooge 17,328 41.42% |
Robert Page 5,743 13.73% |
Wesley Owen Whiteside 1,289 3.08% |
Heidi Loewen-Steffano (CHP) 259 0.62% |
Reg Alcock | ||||||
| Winnipeg South Centre | Anita Neville 16,296 39.25% |
Michael Richards 13,077 31.49% |
Mark Wasyliw 9,055 21.81% |
Vere H. Scott 1,848 4.45% |
Jeffrey Anderson (Ind.) 246 0.59% |
Anita Neville | ||||||
| Dale Swirsky (PC) 934 2.25% | ||||||||||||
| Magnus Thompson (CAP) 66 0.16% | ||||||||||||
2004 - 38th General Election[]
This section needs expansion. You can help by . (June 2020) |

- Charleswood-St. James-Assiniboia
- Elmwood-Transcona
- Kildonan-St. Paul
- Saint Boniface
- Winnipeg Centre
- Winnipeg North
- Winnipeg South
- Winnipeg South Centre
Conservative Party of Canada

Green Party of Canada
Liberal Party of Canada

New Democratic Party


- Canadian federal election results in Manitoba
- Politics of Winnipeg