Coventry City Council elections
One third of Coventry City Council in the West Midlands, England is elected each year, followed by one year without election. Since the last boundary changes in 2004, 54 councillors have been elected from 18 wards.[1]
Political control[]
Since the first election to the council in 1973, political control of the council has been held by the following parties:[2]
| Party in control | Years |
|---|---|
| Labour | 1973–1978 |
| Conservative | 1978–1979 |
| Labour | 1979–2003 |
| No overall control | 2003–2006 |
| Conservative | 2006–2008 |
| No overall control | 2008–2010 |
| Labour | 2010–present |
Council elections[]
- 1998 Coventry City Council election
- 2002 Coventry City Council election
- 2003 Coventry City Council election
- 2004 Coventry City Council election (whole council elected after boundary changes took place)[3]
- 2006 Coventry City Council election
- 2007 Coventry City Council election
- 2008 Coventry City Council election
- 2010 Coventry City Council election
- 2011 Coventry City Council election
- 2012 Coventry City Council election
- 2015 Coventry City Council election
- 2016 Coventry City Council election
- 2018 Coventry City Council election
- 2019 Coventry City Council election
- 2021 Coventry City Council election
Overview[]
| Year | Conservative | Labour | Liberal Democrats | Socialist | Independent | |||||
| 2015 | 13 | 41 | 0 | 0 | 0 | |||||
| 2012 | 11 | 43 | 0 | 0 | 0 | |||||
| 2011 | 17 | 35 | 1 | 1 | 0 | |||||
| 2010 | 22 | 30 | 1 | 1 | 0 | |||||
| 2008 | 27 | 24 | 1 | 2 | 0 | |||||
| 2007 | 28 | 23 | 1 | 2 | 0 | |||||
| 2006 | 29 | 19 | 2 | 3 | 1 | |||||
| 2004 | 27 | 22 | 3 | 2 | 0 | |||||
| 2003 | 23 | 26 | 2 | 3 | 0 | |||||
| 2002 | 19 | 31 | 1 | 3 | 0 | |||||
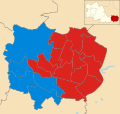
Borough result maps[]

2004 results map

2007 results map

2008 results map
2010 results map

2011 results map
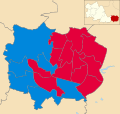
2021 results map


By-election results[]
1993-1997[]
| Party | Candidate | Votes | % | ±% | |
|---|---|---|---|---|---|
| Labour | 1,674 | 49.0 | |||
| Conservative | 953 | 27.9 | |||
| Militant Labour | 535 | 15.6 | |||
| Liberal Democrats | 255 | 7.5 | |||
| Majority | 721 | 21.1 | |||
| Turnout | 3,417 | 28.9 | |||
| Labour hold | Swing | ||||
1997-2001[]
| Party | Candidate | Votes | % | ±% | |
|---|---|---|---|---|---|
| Labour | 4,801 | 63.7 | -7.2 | ||
| Conservative | 1,600 | 21.2 | +2.4 | ||
| Liberal Democrats | 1,136 | 15.1 | +4.8 | ||
| Majority | 3,201 | 42.5 | |||
| Turnout | 7,537 | 62.0 | |||
| Labour hold | Swing | ||||
| Party | Candidate | Votes | % | ±% | |
|---|---|---|---|---|---|
| Conservative | 1,741 | 61.8 | +11.9 | ||
| Labour | 673 | 23.9 | -7.8 | ||
| Liberal Democrats | 360 | 12.8 | -5.6 | ||
| Socialist Alliance | 44 | 1.6 | +1.6 | ||
| Majority | 1,068 | 37.9 | |||
| Turnout | 2,818 | 22.2 | |||
| Conservative hold | Swing | ||||
2001-2005[]
| Party | Candidate | Votes | % | ±% | |
|---|---|---|---|---|---|
| Labour | 2,998 | 46.9 | -5.2 | ||
| Conservative | 2,146 | 33.6 | -23.2 | ||
| Liberal Democrats | 987 | 15.5 | +13.9 | ||
| Unknown | 257 | 4.0 | +4.0 | ||
| Majority | 852 | 13.3 | |||
| Turnout | 6,388 | ||||
| Labour hold | Swing | ||||
| Party | Candidate | Votes | % | ±% | |
|---|---|---|---|---|---|
| Labour | Tony Skipper | 873 | 53.5 | +2.2 | |
| Liberal Democrats | Peter Simpson | 442 | 27.1 | +11.8 | |
| Conservative | Gary Ridley | 316 | 19.4 | -8.4 | |
| Majority | 431 | 26.4 | |||
| Turnout | 1,631 | 13.0 | |||
| Labour hold | Swing | ||||
2006-2011[]
| Party | Candidate | Votes | % | ±% | |
|---|---|---|---|---|---|
| Labour | Catherine Elizabeth Miks | 1,366 | 53.9 | -3.3 | |
| Conservative | Jaswant Singh Birdi | 563 | 22.2 | -0.1 | |
| Socialist Alternative | Robert McArdle | 254 | 10.0 | +3.6 | |
| BNP | Keith Oxford | 149 | 5.9 | +0.2 | |
| Green | Laura Vesty | 114 | 4.5 | -3.2 | |
| Liberal Democrats | Mark Edward Widdop | 79 | 3.1 | N/A | |
| Majority | 803 | 31.7 | |||
| Turnout | 2,532 | 18.51 | |||
| Labour hold | Swing | ||||
2016-2021[]
| Party | Candidate | Votes | % | ±% | |
|---|---|---|---|---|---|
| Labour | Rupinder Singh | 1,237 | |||
| Conservative | Ellane Francoise Yebkal | 344 | |||
| UKIP | Harjinder Singh Sehmi | 290 | |||
| Green | Aimee Challenor | 165 | |||
| Liberal Democrats | Christopher Mark Glenn | 124 | |||
| Majority | 893 | ||||
| Turnout | 2,160 | ||||
| Labour hold | Swing | ||||
| Party | Candidate | Votes | % | ±% | |
|---|---|---|---|---|---|
| Conservative | Mattie Heaven | 1,560 | 53 | ||
| Liberal Democrats | James Frederick Morshead | 634 | 22 | ||
| Labour | Abdul Jobbar | 544 | 19 | ||
| Brexit Party | George Stuart Ronald Beamish | 193 | 7 | ||
| Majority | 926 | ||||
| Turnout | 2,948 | ||||
| Conservative hold | Swing | ||||
| Party | Candidate | Votes | % | ±% | |
|---|---|---|---|---|---|
| Labour | Gurdev Singh Hayre | 639 | 53 | ||
| Conservative | Gurdeep Singh Sohal | 350 | 29 | ||
| Green | Chrissie Lynn Brown | 120 | 10 | ||
| Jane Elizabeth Nellist | 101 | 8 | |||
| Majority | 289 | ||||
| Turnout | 1,210 | ||||
| Labour hold | Swing | ||||
References[]
- ^ "Coventry City Council". Coventry City Council. Archived from the original on 5 May 2010. Retrieved 7 May 2010.
- ^ "Coventry". BBC News Online. 19 April 2009. Retrieved 7 May 2010.
- ^ "Coventry council". BBC News Online. Retrieved 7 May 2010.
- ^ "Tony's win keeps Labour hold". Coventry Evening Telegraph. 21 September 2001. p. 5.
- ^ "Notice of By-election". Coventry City Council. 1 September 2011. Archived from the original on 23 July 2012. Retrieved 17 September 2011.
- ^ "Statement of Persons Nominated". Coventry City Council. 9 September 2011. Archived from the original on 23 July 2012. Retrieved 17 September 2011.
- ^ "Statement of results". Coventry City Council. 7 October 2011. Retrieved 8 October 2011.
- ^ "Labour win by-election after deputy leader's death". Coventry Telegraph. 13 February 2016. p. 8.
- ^ "Election results for Wainbody". Coventry City Council. 5 September 2019. Retrieved 8 September 2019.
- ^ "Election results for Upper Stoke". Coventry City Council. 19 March 2020. Retrieved 2 May 2020.
External links[]
| Birmingham | |
|---|---|
| Coventry | |
| Dudley | |
| Sandwell | |
| Solihull | |
| Walsall | |
| Wolverhampton | |
| West Midlands CC |
|
| Mayor | |
| |
Metropolitan districts of England | ||
|---|---|---|
| Districts |
|  |
| Councils |
| |
| Local elections |
| |
Categories:
- Coventry City Council elections
- Elections in Coventry
- Local government in Coventry
- Council elections in the West Midlands (county)
- Metropolitan borough council elections in England