Hungarians (3.5%) Roma (2.1%) Bosniaks (2%) other minorities less than 1% respectively
Language
Official
Serbian at national level; Hungarian, Bosnian, Croatian, Slovak, Albanian, Romanian, Montenegrin and Rusyn are in official use in individual municipalities
Spoken
Serbian (88%) Hungarian (3.4%) Bosnian (1.9%) Romani (1.4%) other minority languages less than 1% respectively
This article is about the demographic features of the population of Serbia; including vital statistics, ethnicity, religious affiliations, education level, health of the populace, and other aspects of the population.
Censuses in Serbia ordinarily take place every 10 years, organized by the Statistical Office of the Republic of Serbia. The Principality of Serbia had conducted the first population census in 1834; the subsequent censuses were conducted in 1841, 1843, 1846, 1850, 1854, 1859, 1863 and 1866 and 1874. During the era Kingdom of Serbia, six censuses were conducted in 1884, 1890, 1895, 1900, 1905 and the last one being in 1910. During the Kingdom of Yugoslavia, censuses were conducted in 1931 and 1921; the census in 1941 was never conducted due to the outbreak of World War II. Socialist Yugoslavia conducted censuses in 1948, 1953, 1961, 1971, 1981, and 1991. The two most recent censuses were held in 2002 and 2011.
The years since the first 1834 Census saw frequent border changes of Serbia, first amidst the disintegration of the Ottoman Empire and Austria-Hungary, then subsequent formation and later disintegration of Yugoslavia and, finally, 2008 partially recognized independence of Kosovo which affected territorial scope in which all these censuses have been conducted.
Historical population
Year
Pop.
±%
1834
678,192
—
1841
828,895
+22.2%
1843
859,545
+3.7%
1846
915,080
+6.5%
1850
956,893
+4.6%
1854
998,919
+4.4%
1859
1,078,281
+7.9%
1863
1,108,668
+2.8%
1866
1,216,219
+9.7%
1874
1,669,337
+37.3%
1884
1,901,336
+13.9%
1895
2,493,770
+31.2%
1910
2,922,858
+17.2%
1921
4,781,446
+63.6%
1931
5,675,567
+18.7%
1948
5,794,966
+2.1%
1953
6,163,154
+6.4%
1961
6,678,227
+8.4%
1971
7,202,591
+7.9%
1981
7,729,676
+7.3%
1991
7,822,915
+1.2%
2002
7,498,001
−4.2%
2011
7,253,862
−3.3%
2020
6,899,126
−4.9%
Total fertility rate 1860-1949[]
The total fertility rate is the number of children born per woman. It is based on fairly good data for the entire period. Sources: Our World In Data and Gapminder Foundation.[3]
Female fertile population (15–49 years) by age group
Average 1950-2019
1950
1951
1952
1953
1954
1955
1956
1957
1958
1959
1960
1961
1962
1963
1964
1965
1966
1967
1968
1969
1970
1971
1972
1973
1974
1975
1976
1977
1978
1979
1980
1981
1982
1983
1984
1985
1986
1987
1988
1989
1990
1991
1992
1993
1994
1995
1996
1997
1998
1999
2000
2001
2002
2003
2004
2005
2006
2007
2008
2009
2010
2011
2012
2013
2014
2015
2016
2017
2018
2019
Female fertile population (15–49 years) by age group
Total female 15–49 years
1,808,883
1,667,489
1,679,515
1,691,530
1,703,548
1,714,614
1,725,685
1,736,751
1,739,485
1,742,115
1,739,287
1,733,296
1,727,303
1,735,235
1,750,899
1,769,796
1,807,362
1,843,693
1,887,344
1,945,878
1,972,004
2,012,702
2,020,324
2,019,717
2,036,056
2,020,513
2,010,021
2,002,713
1,994,191
1,974,022
1,986,006
1,997,988
1,977,061
1,947,609
1,914,434
1,921,422
1,920,627
1,911,361
1,919,612
1,899,146
1,895,541
1,899,883
1,813,520
1,821,688
1,833,456
1,846,610
1,860,970
1,868,882
1,864,628
1,855,228
1,844,875
1,831,994
1,821,493
1,810,526
1,789,668
1,770,053
1,750,845
1,733,316
1,718,428
1,704,735
1,691,363
1,677,562
1,632,708
1,615,898
1,599,129
1,582,643
1,566,064
1,550,651
1,537,044
1,523,675
1,510,363
Total female 15–49 years
10-14
254,659
286,018
272,832
263,321
253,810
248,651
243,492
238,333
259,259
130,000
262,500
284,501
306,501
480,000
343,333
350,000
340,000
278,333
330,000
286,677
245,000
301,667
270,134
272,000
280,000
276,667
240,000
267,333
280,000
266,000
249,750
233,500
247,952
230,000
286,667
269,091
276,667
960,000
150,000
283,333
269,222
263,428
247,904
246,328
245,564
245,740
244,758
241,922
238,560
234,552
228,803
222,954
218,969
215,677
211,248
207,565
204,964
201,529
197,138
192,518
187,193
181,840
171,697
170,484
170,695
172,024
173,405
172,970
170,506
167,578
165,053
10-14
15-19
251,635
322,143
315,156
308,163
301,169
290,326
279,483
268,641
260,126
250,035
240,206
231,449
222,692
223,599
237,840
256,505
285,061
304,850
316,625
309,634
327,168
330,123
329,876
321,732
305,654
290,749
278,969
270,780
265,831
262,186
260,023
257,860
256,821
250,964
248,465
248,198
247,661
247,852
249,622
252,208
254,455
258,548
243,797
247,977
250,885
252,289
252,477
251,204
249,269
248,396
248,825
248,140
245,807
243,588
239,596
233,847
227,633
222,688
217,825
212,667
208,819
206,230
198,633
193,813
188,306
182,061
175,752
171,643
170,365
170,575
171,903
15-19
20-24
262,174
321,829
321,495
321,160
320,826
318,313
315,800
313,286
306,135
295,138
283,579
277,224
270,868
257,128
247,990
238,765
230,851
223,430
227,936
230,027
260,421
287,177
304,801
317,996
327,965
333,533
333,334
330,390
320,918
305,179
294,164
283,148
283,316
275,220
272,016
268,306
262,557
255,500
251,111
248,448
247,287
247,977
234,244
234,665
236,468
239,771
244,273
248,830
251,940
253,675
254,292
254,017
253,183
252,034
250,942
251,319
250,871
248,448
245,415
241,218
234,965
228,435
217,830
213,807
209,178
205,340
202,378
198,542
193,587
188,104
181,880
20-24
25-29
268,398
277,906
286,770
295,633
304,497
308,962
313,428
317,893
317,818
317,767
316,851
313,135
309,419
302,131
292,180
281,269
274,954
267,333
258,805
267,313
240,769
232,681
220,104
226,442
239,681
258,296
282,740
303,622
316,918
327,271
332,994
338,717
330,113
321,722
308,516
297,112
287,251
280,669
276,290
272,610
267,496
262,173
246,353
243,004
241,067
240,581
240,019
238,939
238,560
239,290
241,330
244,663
249,236
252,889
254,373
255,142
255,136
253,941
252,413
251,575
251,697
250,749
238,303
235,397
231,884
226,717
221,367
217,526
213,514
208,882
205,057
25-29
30-34
265,303
134,063
163,358
192,652
221,946
242,577
263,209
283,840
294,990
302,155
306,746
311,278
315,810
313,597
313,727
313,909
311,678
306,911
300,573
298,694
281,392
276,431
274,208
263,637
252,997
241,813
229,224
221,821
225,544
239,104
262,974
286,844
307,532
316,391
326,362
333,811
333,597
330,656
323,276
309,221
295,965
287,163
271,599
267,670
264,838
260,732
255,413
249,849
245,565
242,490
240,935
239,755
239,025
239,673
240,479
242,733
246,175
250,043
253,124
254,889
255,369
255,004
245,974
243,648
242,307
241,765
240,366
237,669
234,840
231,377
226,230
30-34
35-39
260,084
213,898
190,297
166,695
143,094
150,148
157,203
164,257
193,826
227,176
252,891
263,388
273,886
290,652
298,136
303,035
309,341
311,691
311,961
322,265
312,229
313,051
309,425
304,644
295,696
287,141
278,450
271,234
262,040
251,465
241,913
232,361
220,939
225,611
239,750
260,536
284,606
305,643
318,210
327,307
331,826
333,029
315,513
310,509
299,894
289,308
280,382
274,134
269,007
264,966
259,920
254,209
249,072
245,868
243,012
241,694
240,631
239,452
239,408
240,389
242,506
245,781
246,117
248,115
248,784
248,524
247,355
245,091
242,817
241,481
240,970
35-39
40-44
254,686
209,677
212,524
215,371
218,218
207,018
195,819
184,619
160,394
138,987
130,407
141,419
152,430
190,557
224,774
249,400
265,282
275,563
287,875
297,681
301,928
308,713
311,956
311,891
314,960
314,568
310,308
308,128
302,559
292,321
286,523
280,725
273,956
258,034
248,674
240,681
231,151
220,740
226,613
239,949
258,207
283,650
290,449
301,607
310,550
316,247
317,488
316,475
310,488
298,749
287,305
278,152
272,523
268,552
264,657
259,782
254,052
248,595
244,762
242,136
240,839
239,741
237,758
237,523
238,137
239,404
241,748
244,754
246,729
247,395
247,165
40-44
45-49
246,603
187,973
189,915
191,856
193,798
197,270
200,743
204,215
206,196
210,857
208,607
195,403
182,198
157,571
136,252
126,913
130,195
153,915
183,569
220,264
248,097
264,526
269,954
273,375
299,103
294,413
296,996
296,738
300,381
296,496
307,415
318,333
304,384
299,667
270,651
272,778
273,804
270,301
274,490
249,403
240,305
227,343
211,565
216,256
229,754
247,682
270,918
289,451
299,799
307,662
312,268
313,058
312,647
307,922
296,609
285,536
276,347
270,149
265,481
261,861
257,168
251,622
248,093
243,595
240,533
238,832
237,098
235,426
235,192
235,861
237,158
45-49
50-54
239,600
157,043
162,099
167,154
172,209
171,171
170,133
169,095
173,308
186,066
197,258
197,594
197,929
235,772
210,996
209,712
191,481
166,766
142,978
152,623
122,902
133,847
148,558
173,305
238,587
280,513
225,263
325,345
198,667
337,273
278,136
219,000
303,494
222,000
380,833
223,333
449,231
288,235
417,273
277,894
265,882
271,916
262,804
252,564
240,886
229,567
216,684
208,601
212,912
225,738
242,948
265,432
283,757
294,709
302,490
307,254
308,001
307,102
301,678
290,771
280,161
271,378
269,285
264,459
260,489
255,410
249,572
243,815
239,376
236,410
234,846
50-54
General,specific and total fertility rates
Average 1950-2019
1950
1951
1952
1953
1954
1955
1956
1957
1958
1959
1960
1961
1962
1963
1964
1965
1966
1967
1968
1969
1970
1971
1972
1973
1974
1975
1976
1977
1978
1979
1980
1981
1982
1983
1984
1985
1986
1987
1988
1989
1990
1991
1992
1993
1994
1995
1996
1997
1998
1999
2000
2001
2002
2003
2004
2005
2006
2007
2008
2009
2010
2011
2012
2013
2014
2015
2016
2017
2018
2019
General,specific and total fertility rates
General fertility rate
53.84
97.77
86.30
95.21
88.95
88.91
81.29
76.01
68.10
67.95
66.01
68.79
66.65
63.34
61.81
58.61
58.98
56.21
54.76
53.18
53.45
50.82
51.43
52.83
53.15
54.62
56.10
56.86
55.85
55.96
55.30
54.79
52.22
54.63
56.35
55.64
53.01
51.96
51.14
51.27
48.11
47.56
49.80
47.64
47.90
46.13
46.30
44.13
42.70
41.11
39.12
40.22
43.02
43.10
44.12
44.14
41.19
40.92
39.59
40.48
41.51
40.68
40.14
41.57
40.96
41.95
41.90
41.71
42.18
41.94
42.60
General fertility rate
Under 15
0.29
0.09
0.08
0.09
0.13
0.14
0.13
0.08
0.13
0.10
0.17
0.16
0.16
0.09
0.18
0.20
0.20
0.33
0.32
0.36
0.23
0.42
0.52
0.53
0.43
0.32
0.67
0.56
0.43
0.53
0.46
0.54
0.62
0.74
0.43
0.40
0.40
0.11
0.66
0.32
0.25
0.40
0.19
0.32
0.33
0.35
0.25
0.29
0.36
0.22
0.21
0.27
0.29
0.28
0.22
0.24
0.29
0.27
0.34
0.31
0.45
0.33
0.28
0.36
0.25
0.31
0.21
0.28
0.26
0.29
0.27
Under 15
15-19
45.98
48.66
44.11
50.51
49.40
51.92
49.75
48.16
50.22
52.34
59.23
64.32
65.66
61.27
58.59
53.68
57.17
63.70
65.57
66.97
69.32
63.85
64.25
66.89
65.05
64.63
64.75
62.56
59.88
59.75
58.61
56.93
51.12
54.01
53.33
53.70
53.70
52.27
49.99
51.40
47.23
44.46
45.69
41.22
41.31
38.87
36.30
33.53
31.78
29.03
26.50
26.44
26.97
25.41
25.25
24.57
23.08
22.77
22.28
22.04
21.66
20.01
18.96
19.17
18.05
17.88
16.39
15.35
15.17
14.00
13.64
15-19
20-24
134.43
203.67
181.10
202.51
189.04
192.79
179.19
168.54
153.72
157.86
157.05
167.75
162.62
162.77
163.28
163.15
170.12
160.96
161.16
159.76
157.39
147.98
150.35
149.23
148.83
148.37
152.75
152.68
150.96
150.98
152.66
152.79
143.51
150.98
154.04
152.28
147.64
146.02
145.01
146.35
138.31
137.48
142.18
136.70
135.84
127.02
125.04
116.92
110.36
104.52
96.48
98.09
98.23
94.71
94.53
90.75
82.46
78.79
74.34
72.69
69.82
64.90
62.89
63.44
60.48
61.34
58.20
57.57
57.57
56.07
56.52
20-24
25-29
107.07
178.77
154.05
166.68
153.67
152.82
138.77
128.55
112.08
112.79
108.26
113.92
110.34
108.76
109.99
107.16
110.46
105.80
102.25
99.16
96.45
90.14
92.64
92.43
95.96
99.34
99.60
102.43
99.90
100.94
101.94
100.66
98.53
102.48
106.27
108.13
103.71
104.19
105.54
105.83
99.84
101.55
109.49
106.35
106.64
104.99
108.56
105.20
102.84
99.46
95.36
97.36
105.69
104.61
105.06
103.33
94.47
93.10
88.56
90.63
91.69
91.39
89.81
91.79
90.41
91.28
91.41
91.61
91.99
91.03
91.93
25-29
30-34
55.66
115.06
85.03
79.04
90.43
82.86
70.17
63.13
53.85
52.52
48.73
49.58
48.78
47.03
47.07
45.34
45.72
44.62
43.55
43.94
43.62
42.61
40.41
40.02
40.07
40.66
40.86
41.76
43.00
44.50
43.90
44.50
42.81
43.31
45.74
46.30
44.23
43.56
44.86
44.19
42.26
44.07
48.83
48.61
51.78
52.24
56.05
54.54
53.78
52.88
51.24
52.85
60.03
62.98
65.20
66.81
63.07
63.68
62.80
65.15
70.34
69.81
72.83
77.20
77.12
80.19
82.37
82.08
83.21
84.87
88.13
30-34
35-39
21.57
50.29
51.14
63.59
41.19
37.86
32.78
32.38
26.83
24.04
21.59
21.05
19.90
17.89
17.73
16.65
15.93
15.53
15.46
15.01
15.04
13.79
13.91
13.86
14.56
14.80
14.60
14.83
14.19
13.42
13.39
13.17
13.18
13.96
15.03
15.63
14.72
14.39
14.49
13.86
13.98
13.81
14.84
14.99
16.02
17.05
17.94
18.26
19.00
18.35
18.17
18.45
20.58
21.53
23.02
23.89
22.74
23.63
23.77
26.14
29.07
29.56
29.93
32.04
33.06
35.06
36.73
38.10
40.04
41.34
43.60
35-39
40-44
5.16
21.85
19.71
20.88
12.04
11.95
11.35
9.36
7.69
8.09
8.27
7.24
8.30
6.90
5.93
5.20
4.44
4.03
3.90
3.79
3.53
3.24
3.25
3.30
3.26
3.24
3.30
3.35
3.39
3.06
3.02
3.03
2.75
2.93
2.80
2.76
2.78
2.90
3.15
3.03
3.03
2.96
3.14
3.09
3.35
3.33
3.13
3.58
3.16
3.30
3.05
3.44
3.64
3.98
4.28
4.49
4.03
3.98
3.77
4.26
4.66
5.07
5.47
5.96
6.10
6.70
7.20
7.14
8.32
8.82
9.14
40-44
45-49
0.63
4.66
4.36
4.43
3.17
2.66
2.25
1.78
1.46
1.48
0.98
0.89
1.06
1.00
1.21
1.29
1.11
0.90
0.87
0.72
0.44
0.35
0.34
0.34
0.26
0.28
0.27
0.30
0.33
0.27
0.27
0.30
0.31
0.21
0.29
0.27
0.26
0.25
0.27
0.19
0.22
0.22
0.20
0.19
0.28
0.27
0.22
0.19
0.21
0.23
0.24
0.23
0.17
0.20
0.22
0.18
0.16
0.24
0.25
0.28
0.25
0.35
0.36
0.47
0.49
0.58
0.40
0.39
0.64
0.64
0.69
45-49
50 and over
0.13
1.55
1.45
1.39
0.65
0.57
0.49
0.28
0.26
0.19
0.10
0.07
0.25
0.23
0.20
0.20
0.19
0.32
0.27
0.25
0.22
0.25
0.18
0.13
0.07
0.05
0.10
0.04
0.06
0.07
0.06
0.05
0.05
0.04
0.02
0.06
0.02
0.03
0.02
0.04
0.04
0.03
0.05
0.07
0.13
0.06
0.05
0.03
0.05
0.04
0.05
0.05
0.03
0.02
0.04
0.04
0.03
0.05
0.03
0.03
0.03
0.03
0.05
0.06
0.06
0.08
0.02
0.03
0.06
0.11
0.06
50 and over
Total fertility rate (15–49)
1.85
3.11
2.70
2.94
2.69
2.66
2.42
2.26
2.03
2.05
2.02
2.12
2.08
2.03
2.02
1.96
2.02
1.98
1.96
1.95
1.93
1.81
1.83
1.83
1.84
1.86
1.88
1.89
1.86
1.86
1.87
1.86
1.76
1.84
1.89
1.90
1.84
1.82
1.82
1.82
1.72
1.72
1.82
1.76
1.78
1.72
1.74
1.66
1.61
1.54
1.46
1.48
1.58
1.57
1.59
1.57
1.45
1.43
1.38
1.41
1.44
1.41
1.40
1.45
1.43
1.47
1.46
1.46
1.48
1.48
1.52
Total fertility rate (15–49)
Ethnic groups[]
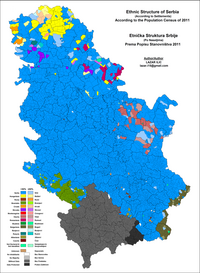
Ethnic map (2011 census)
Situated in the middle of the Balkans, Serbia is home to many different ethnic groups. According to the 2011 census, Serbs are the largest ethnic group in the country and constitute 83.3% of population. Hungarians are the largest ethnic minority in Serbia, concentrated predominately in northern Vojvodina and representing 3.5% of the country's population (13% in Vojvodina). Roma people constitute 2% of the total population but unofficial estimates put their actual number to be twice or three as high.[19]Bosniaks are third largest ethnic minority mainly inhabiting Raška region in southwestern part of the country. Other minority groups include Croats (0.9%), Slovaks (0.8%), Albanians, Montenegrins (0.5%), Romanians (0.4%), Macedonians (0.3%), and Bulgarians (0.3%). The Chinese[20][21] and Arabs, are the only two significant immigrant minorities.
Serbia is largely a homogeneous Eastern Orthodox nation, with Catholic and Muslim minorities, among other smaller confessions.[25]
Orthodox Christians number 6,079,396 or 84.5% of country's population. The Serbian Orthodox Church is the largest and traditional church of the country, adherents of which are overwhelmingly Serbs. Other Orthodox Christian communities in Serbia include Montenegrins, Macedonians Romanians, Vlachs and Bulgarians.
There are 356,957 Roman Catholics in Serbia, roughly 5% of the population, mostly in Vojvodina (especially its northern part) which is home to minority ethnic groups such as Hungarians, Croats, Bunjevci, Albanians, as well as to some Slovaks and Czechs.[25]Protestantism accounts for about 1% of the country's population, chiefly among Slovaks in Vojvodina as well as among Reformist Hungarians.
Muslims, with 222,282 or 3% of population, form third largest religious group. Islam has a strong historic following in the southern regions of Serbia, primarily in southern Raška. Bosniaks are the largest Islamic community in Serbia; estimates are that some third of country's Roma people are Muslim.
The official language is Serbian, member of the South Slavic group of languages, and is native to 6,330,919 or 88% of the population.[26] Recognized minority languages are: Hungarian (mother tongue to 243,146 people or 3.4% of population), Slovak, Romanian, Bulgarian, and Rusyn as well as Bosnian and Croatian which are completely mutually intelligible with Serbian. All these languages are in official use in municipalities or cities where more than a 15% of population consists of national minority.[27] In Vojvodina, provincial administration uses, besides Serbian, five other languages (Hungarian, Slovak, Romanian, Croatian, and Rusyn).
According to 2011 census, literacy in Serbia stands at 98% of population while computer literacy is at 49% (complete computer literacy is at 34.2%).[30] Same census showed the following levels of education: 16.2% of inhabitants have higher education (10.6% have bachelors or master's degrees, 5.6% have an associate degree), 49% have a secondary education, 20.7% have an elementary education, and 13.7% have not completed elementary education.[31]
The life expectancy in Serbia at birth is 74.8 years, 71.9 for males and 77.7 for females.[32] Serbia has a comparatively old overall population (among the 10 oldest in the world), with the average age of 42.9 years.[33]
Ocić, Časlav (2006). "Kosovo and Metohia: Ethnodemographic Changes from the End of World War II to 1991". Срби на Косову и у Метохији: Зборник радова са научног скупа(PDF). Београд: Српска академија наука и уметности. pp. 441–460. Archived from the original(PDF) on 2016-03-25. Retrieved 2017-08-01.