Demographics of the Czech Republic
| Demographics of the Czech Republic | |
|---|---|
 Czech Republic population pyramid in 2020 | |
| Population | |
| Growth rate | 0.004% (2020)[2] |
| Birth rate | 8.9 births/1,000 population (2020)[2] |
| Death rate | 10.7 deaths/1,000 population (2020)[2] |
| Life expectancy | 79.3 years (2020)[2] |
| • male | 76.3 years (2020)[2] |
| • female | 82.4 years (2020)[2] |
| Fertility rate | 1.7 children born/woman (2020)[2] |
| Infant mortality rate | 2.6 deaths/1,000 live births (2020)[2] |
| Net migration rate | 2.3 migrant(s)/1,000 population (2020)[2] |
| Sex ratio | |
| Total | 0.97 male(s)/female (2018)[3] |
| Nationality | |
| Nationality |
|
| Major ethnic | Czech 64.3% (2011)[2] |
| Minor ethnic |
|
| Language | |
| Official | Czech |
| Spoken |
|

| Year | Pop. | ±% |
|---|---|---|
| 1790 | 4,444,000 | — |
| 1800 | 4,659,000 | +4.8% |
| 1810 | 4,870,000 | +4.5% |
| 1820 | 5,272,791 | +8.3% |
| 1830 | 5,996,778 | +13.7% |
| 1840 | 6,378,071 | +6.4% |
| 1850 | 6,826,465 | +7.0% |
| 1860 | 7,277,801 | +6.6% |
| 1870 | 7,698,830 | +5.8% |
| 1880 | 8,196,719 | +6.5% |
| 1890 | 8,703,318 | +6.2% |
| 1900 | 9,333,853 | +7.2% |
| 1910 | 10,035,575 | +7.5% |
| 1921 | 10,002,030 | −0.3% |
| 1930 | 10,648,057 | +6.5% |
| 1950 | 8,925,122 | −16.2% |
| 1961 | 9,588,016 | +7.4% |
| 1970 | 9,805,157 | +2.3% |
| 1980 | 10,326,792 | +5.3% |
| 1991 | 10,308,682 | −0.2% |
| 2001 | 10,224,192 | −0.8% |
| 2011 | 10,496,672 | +2.7% |
| 2021 | 10,701,777 | +2.0% |
| Source: Czech Statistical Office | ||
This article is about the demographic features of the population of the Czech Republic, including population density, ethnicity, education level, health of the populace, economic status, and religious affiliations.
Population[]
With an estimated population of 10,665,677 as of 2018, compared to 9.3 million at the beginning of the 20th century, the population growth of the Czech Republic has been limited, due to low fertility rates and loss of population in and around World Wars I and II. Population loss during World War I was approximately 350,000. At the beginning of World War II the population of the Czech Republic reached its maximum (11.2 million). Due to the expulsion of the German residents after World War II, the Czech Republic lost about 3 million inhabitants and in 1947 the population was only 8.8 million. Population growth resumed, and in 1994 the population was 10.33 million.
From 1994 to 2003 natural growth was slightly negative (-0.15% per year) and the population decreased to 10.2 million. Since 2005, natural growth has been positive, but in recent times the most important influence on the population of the Czech Republic has been immigration: approximately 300,000 during the 2010s.
Population censuses[]


| Census date | Population |
|---|---|
| 31 Dec 1857 | 7,016,531 |
| 31 Dec 1869 | 7,617,230 |
| 31 Dec 1880 | 8,222,013 |
| 31 Dec 1890 | 8,665,421 |
| 31 Dec 1900 | 9,372,214 |
| 31 Dec 1910 | 10,078,637 |
| 15 Feb 1921 | 10,009,587 |
| 1 Dec 1930 | 10,674,386 |
| 1 Mar 1950 | 8,896,133 |
| 1 Mar 1961 | 9,571,531 |
| 1 Dec 1970 | 9,807,697 |
| 1 Nov 1980 | 10,291,927 |
| 3 Mar 1991 | 10,302,215 |
| 1 Mar 2001 | 10,230,060 |
| 25 Mar 2011 | 10,486,731 |
Vital statistics[]
Births and deaths[]
Source: Czech Demographic Handbook 2007[4]
| Average population | Live births | Deaths | Natural change | Crude birth rate (per 1000) | Crude death rate (per 1000) | Natural change (per 1000) | Total fertility rates[5] | Migration change[6] | |
|---|---|---|---|---|---|---|---|---|---|
| 1900 | 9,334,000 | 330,662 | 227,920 | 102,742 | 35.4 | 24.4 | 11.0 | 4.85 | |
| 1901 | 9,405,000 | 325,514 | 221,052 | 104,462 | 34.6 | 23.5 | 11.1 | 4.76 | |
| 1902 | 9,475,000 | 333,619 | 222,457 | 111,162 | 35.2 | 23.5 | 11.7 | 4.68 | |
| 1903 | 9,545,000 | 318,275 | 218,448 | 99,827 | 33.3 | 22.9 | 10.5 | 4.6 | |
| 1904 | 9,615,000 | 319,433 | 222,276 | 97,157 | 33.2 | 23.1 | 10.1 | 4.52 | |
| 1905 | 9,685,000 | 300,414 | 232,999 | 67,415 | 31.0 | 24.1 | 7.0 | 4.44 | |
| 1906 | 9,754,000 | 313,449 | 203,182 | 110,267 | 32.1 | 20.8 | 11.3 | 4.36 | |
| 1907 | 9,825,000 | 306,356 | 210,721 | 95,635 | 31.2 | 21.4 | 9.7 | 4.27 | |
| 1908 | 9,895,000 | 308,504 | 210,101 | 98,403 | 31.2 | 21.2 | 9.9 | 4.19 | |
| 1909 | 9,965,000 | 305,426 | 210,047 | 95,379 | 30.6 | 21.1 | 9.6 | 4.11 | |
| 1910 | 10,036,000 | 295,617 | 196,728 | 98,889 | 29.5 | 19.6 | 9.9 | 4.03 | |
| 1911 | 10,099,000 | 289,058 | 206,266 | 82,792 | 28.6 | 20.4 | 8.2 | 3.92 | |
| 1912 | 10,157,000 | 280,368 | 203,324 | 77,044 | 27.6 | 20.0 | 7.6 | 3.82 | |
| 1913 | 10,221,000 | 275,060 | 190,475 | 84,585 | 26.9 | 18.6 | 8.3 | 3.71 | |
| 1914 | 10,283,000 | 269,142 | 188,838 | 80,304 | 26.2 | 18.4 | 7.8 | 3.6 | |
| 1915 | 10,286,000 | 197,542 | 201,280 | -3,738 | 19.2 | 19.6 | -0.4 | 3.5 | |
| 1916 | 10,222,000 | 140,211 | 186,381 | -46,170 | 13.7 | 18.2 | -4.5 | 3.39 | |
| 1917 | 10,128,000 | 126,916 | 188,649 | -61,733 | 12.5 | 18.6 | -6.1 | 3.28 | |
| 1918 | 10,004,000 | 120,579 | 236,035 | -115,456 | 12.1 | 23.6 | -11.5 | 3.18 | |
| 1919 | 9,922,000 | 189,675 | 177,428 | 12,247 | 19.1 | 17.9 | 1.2 | 3.07 | |
| 1920 | 9,978,000 | 244,668 | 176,562 | 68,106 | 24.5 | 17.7 | 6.8 | 2.964 | |
| 1921 | 10,002,000 | 257,281 | 161,321 | 95,960 | 25.7 | 16.1 | 9.6 | 3.035 | |
| 1922 | 10,113,000 | 248,728 | 163,366 | 85,362 | 24.6 | 16.2 | 8.4 | 2.882 | |
| 1923 | 10,198,000 | 241,230 | 142,335 | 98,895 | 23.7 | 14.0 | 9.7 | 2.768 | |
| 1924 | 10,278,000 | 228,894 | 146,098 | 82,796 | 22.3 | 14.2 | 8.1 | 2.590 | |
| 1925 | 10,370,000 | 225,555 | 146,450 | 79,105 | 21.8 | 14.1 | 7.6 | 2.484 | |
| 1926 | 10,443,000 | 219,802 | 148,298 | 71,504 | 21.0 | 14.2 | 6.8 | 2.392 | |
| 1927 | 10,496,000 | 208,711 | 155,479 | 53,232 | 19.9 | 14.8 | 5.1 | 2.237 | |
| 1928 | 10,549,000 | 208,942 | 147,064 | 61,878 | 19.8 | 13.9 | 5.9 | 2.209 | |
| 1929 | 10,598,000 | 203,064 | 155,493 | 47,571 | 19.2 | 14.7 | 4.5 | 2.124 | |
| 1930 | 10,648,000 | 207,224 | 142,159 | 65,065 | 19.5 | 13.4 | 6.1 | 2.149 | |
| 1931 | 10,702,000 | 196,214 | 144,534 | 51,680 | 18.3 | 13.5 | 4.8 | 2.026 | |
| 1932 | 10,750,000 | 190,397 | 142,997 | 47,400 | 17.7 | 13.3 | 4.4 | 1.966 | |
| 1933 | 10,791,000 | 176,201 | 140,906 | 35,295 | 16.3 | 13.1 | 3.3 | 1.826 | |
| 1934 | 10,826,000 | 171,042 | 135,914 | 35,128 | 15.8 | 12.6 | 3.2 | 1.774 | |
| 1935 | 10,853,000 | 161,748 | 140,878 | 20,870 | 14.9 | 13.0 | 1.9 | 1.678 | |
| 1936 | 10,873,000 | 157,992 | 139,093 | 18,899 | 14.5 | 12.8 | 1.7 | 1.664 | |
| 1937 | 10,889,000 | 155,996 | 139,558 | 16,438 | 14.3 | 12.8 | 1.5 | 1.690 | |
| 1938 | 10,877,000 | 163,525 | 143,115 | 20,410 | 15.0 | 13.2 | 1.9 | 1.847 | |
| 1939 | 11,106,000 | 192,344 | 146,976 | 45,368 | 17.3 | 13.2 | 4.1 | 1.916 | |
| 1940 | 11,160,000 | 218,043 | 153,499 | 64,544 | 19.5 | 13.8 | 5.8 | 2.195 | |
| 1941 | 11,129,000 | 208,913 | 152,048 | 56,865 | 18.8 | 13.7 | 5.1 | 2.279 | |
| 1942 | 11,054,000 | 199,259 | 153,096 | 46,163 | 18.0 | 13.8 | 4.2 | 2.422 | |
| 1943 | 11,035,000 | 225,379 | 153,349 | 72,030 | 20.4 | 13.9 | 6.5 | 2.784 | |
| 1944 | 11,109,000 | 230,183 | 161,457 | 68,726 | 20.7 | 14.5 | 6.2 | 2.796 | |
| 1945 | 10,693,000 | 194,182 | 184,944 | 9,238 | 18.2 | 17.3 | 0.9 | 2.673 | |
| 1946 | 9,523,000 | 210,454 | 134,568 | 75,886 | 22.1 | 14.1 | 8.0 | 3.254 | |
| 1947 | 8,765,000 | 206,745 | 105,277 | 101,468 | 23.6 | 12.0 | 11.6 | 3.050 | |
| 1948 | 8,893,000 | 197,837 | 101,501 | 96,336 | 22.2 | 11.4 | 10.8 | 2.886 | |
| 1949 | 8,893,000 | 185,484 | 104,632 | 80,852 | 20.9 | 11.8 | 9.1 | 2.728 | |
| 1950 | 8,930,000 | 188,341 | 103,203 | 85,138 | 21.1 | 11.6 | 9.5 | 2.801 | |
| 1951 | 9,000,000 | 185,570 | 102,658 | 82,912 | 20.6 | 11.4 | 9.2 | 2.763 | |
| 1952 | 9,075,000 | 180,143 | 97,726 | 82,417 | 19.9 | 10.8 | 9.1 | 2.701 | |
| 1953 | 9,140,000 | 172,547 | 98,837 | 73,710 | 18.9 | 10.8 | 8.1 | 2.611 | |
| 1954 | 9,200,000 | 168,402 | 99,636 | 68,766 | 18.3 | 10.8 | 7.5 | 2.581 | |
| 1955 | 9,270,000 | 165,874 | 93,300 | 72,574 | 17.9 | 10.1 | 7.8 | 2.578 | |
| 1956 | 9,330,000 | 162,509 | 93,526 | 68,983 | 17.4 | 10.0 | 7.4 | 2.568 | |
| 1957 | 9,390,000 | 155,429 | 98,687 | 56,742 | 16.6 | 10.5 | 6.0 | 2.495 | |
| 1958 | 9,435,000 | 141,762 | 93,697 | 48,065 | 15.0 | 9.9 | 5.1 | 2.305 | |
| 1959 | 9,465,000 | 128,982 | 97,159 | 31,823 | 13.6 | 10.3 | 3.4 | 2.121 | |
| 1960 | 9,490,000 | 128,879 | 93,863 | 35,016 | 13.6 | 9.9 | 3.7 | 2.113 | |
| 1961 | 9,587,000 | 131,019 | 94,973 | 36,046 | 13.7 | 9.9 | 3.8 | 2.133 | |
| 1962 | 9,625,000 | 133,557 | 104,318 | 29,239 | 13.9 | 10.8 | 3.0 | 2.140 | |
| 1963 | 9,671,000 | 148,840 | 100,129 | 48,711 | 15.4 | 10.4 | 5.0 | 2.332 | |
| 1964 | 9,728,000 | 154,420 | 101,984 | 52,436 | 15.9 | 10.5 | 5.4 | 2.356 | |
| 1965 | 9,779,000 | 147,438 | 105,108 | 42,330 | 15.1 | 10.7 | 4.3 | 2.178 | |
| 1966 | 9,821,000 | 141,162 | 105,784 | 35,378 | 14.4 | 10.8 | 3.6 | 2.008 | |
| 1967 | 9,853,000 | 138,448 | 108,967 | 29,481 | 14.1 | 11.1 | 3.0 | 1.897 | |
| 1968 | 9,876,000 | 137,437 | 115,195 | 22,242 | 13.9 | 11.7 | 2.3 | 1.827 | |
| 1969 | 9,897,000 | 143,165 | 120,653 | 22,512 | 14.5 | 12.2 | 2.3 | 1.859 | |
| 1970 | 9,800,000 | 147,865 | 123,327 | 24,538 | 15.1 | 12.6 | 2.5 | 1.913 | |
| 1971 | 9,827,000 | 154,180 | 122,375 | 31,805 | 15.7 | 12.5 | 3.2 | 1.978 | |
| 1972 | 9,868,000 | 163,661 | 119,205 | 44,456 | 16.6 | 12.1 | 4.5 | 2.074 | |
| 1973 | 9,922,000 | 181,750 | 124,437 | 57,313 | 18.3 | 12.5 | 5.8 | 2.286 | |
| 1974 | 9,988,000 | 194,215 | 126,809 | 67,406 | 19.4 | 12.7 | 6.7 | 2.431 | |
| 1975 | 10,059,000 | 191,776 | 124,314 | 67,462 | 19.1 | 12.4 | 6.7 | 2.402 | |
| 1976 | 10,126,000 | 187,378 | 125,232 | 62,146 | 18.5 | 12.4 | 6.1 | 2.362 | |
| 1977 | 10,187,000 | 181,763 | 126,214 | 55,549 | 17.8 | 12.4 | 5.5 | 2.319 | |
| 1978 | 10,242,000 | 178,901 | 127,136 | 51,765 | 17.5 | 12.4 | 5.1 | 2.324 | |
| 1979 | 10,292,000 | 172,112 | 127,949 | 44,163 | 16.7 | 12.4 | 4.3 | 2.286 | |
| 1980 | 10,283,000 | 153,801 | 135,537 | 18,264 | 15.0 | 13.2 | 1.8 | 2.096 | |
| 1981 | 10,301,000 | 144,438 | 130,407 | 14,031 | 14.0 | 12.7 | 1.4 | 2.016 | |
| 1982 | 10,315,000 | 141,738 | 130,765 | 10,973 | 13.7 | 12.7 | 1.1 | 2.007 | |
| 1983 | 10,324,000 | 137,431 | 134,474 | 2,957 | 13.3 | 13.0 | 0.3 | 1.963 | |
| 1984 | 10,330,000 | 136,941 | 132,188 | 4,753 | 13.3 | 12.8 | 0.5 | 1.966 | |
| 1985 | 10,337,000 | 135,881 | 131,641 | 4,240 | 13.1 | 12.7 | 0.4 | 1.962 | |
| 1986 | 10,341,000 | 133,356 | 132,585 | 771 | 12.9 | 12.8 | 0.1 | 1.935 | |
| 1987 | 10,349,000 | 130,921 | 127,244 | 3,677 | 12.7 | 12.3 | 0.4 | 1.909 | |
| 1988 | 10,356,000 | 132,667 | 125,694 | 6,973 | 12.8 | 12.1 | 0.7 | 1.940 | |
| 1989 | 10,362,000 | 128,356 | 127,747 | 609 | 12.4 | 12.3 | 0.1 | 1.873 | |
| 1990 | 10,363,000 | 130,564 | 129,166 | 1,398 | 12.6 | 12.5 | 0.1 | 1.893 | |
| 1991 | 10,309,000 | 129,354 | 124,290 | 5,064 | 12.5 | 12.1 | 0.5 | 1.860 | |
| 1992 | 10,318,000 | 121,705 | 120,337 | 1,368 | 11.8 | 11.7 | 0.1 | 1.714 | |
| 1993 | 10,331,000 | 121,025 | 118,185 | 2,840 | 11.7 | 11.4 | 0.3 | 1.665 | |
| 1994 | 10,336,000 | 106,579 | 117,373 | -10,794 | 10.3 | 11.4 | -1.0 | 1.438 | |
| 1995 | 10,331,000 | 96,097 | 117,913 | -21,816 | 9.3 | 11.4 | -2.1 | 1.277 | |
| 1996 | 10,315,000 | 90,446 | 112,782 | -22,336 | 8.8 | 10.9 | -2.2 | 1.185 | |
| 1997 | 10,304,000 | 90,657 | 112,744 | -22,087 | 8.8 | 10.9 | -2.1 | 1.172 | |
| 1998 | 10,295,000 | 90,535 | 109,527 | -18,992 | 8.8 | 10.6 | -1.8 | 1.156 | |
| 1999 | 10,283,000 | 89,471 | 109,768 | -20,297 | 8.7 | 10.7 | -2.0 | 1.132 | |
| 2000 | 10,273,000 | 90,910 | 109,001 | -18,091 | 8.8 | 10.6 | -1.8 | 1.143 | |
| 2001 | 10,224,000 | 90,715 | 107,755 | -17,040 | 8.9 | 10.5 | -1.7 | 1.145 | |
| 2002 | 10,201,000 | 92,786 | 108,243 | -15,457 | 9.1 | 10.6 | -1.5 | 1.171 | 12,290 |
| 2003 | 10,207,000 | 93,685 | 111,288 | -17,603 | 9.2 | 10.9 | -1.7 | 1.178 | 25,789 |
| 2004 | 10,216,000 | 97,664 | 107,177 | -9,513 | 9.6 | 10.5 | -0.9 | 1.226 | 18,635 |
| 2005 | 10,236,000 | 102,211 | 107,938 | -5,727 | 10.0 | 10.5 | -0.6 | 1.281 | 36,229 |
| 2006 | 10,269,000 | 105,831 | 104,441 | 1,390 | 10.3 | 10.2 | 0.1 | 1.327 | 34,720 |
| 2007 | 10,334,000 | 114,632 | 104,636 | 9,996 | 11.1 | 10.1 | 1.0 | 1.438 | 83,945 |
| 2008 | 10,425,000 | 119,570 | 104,948 | 14,622 | 11.5 | 10.1 | 1.4 | 1.497 | 71,790 |
| 2009 | 10,488,000 | 118,348 | 107,421 | 10,927 | 11.3 | 10.2 | 1.0 | 1.492 | 28,344 |
| 2010 | 10,517,000 | 117,153 | 106,844 | 10,309 | 11.1 | 10.2 | 0.9 | 1.493 | 15,648 |
| 2011 | 10,514,000 | 108,673 | 106,848 | 1,825 | 10.4 | 10.2 | 0.2 | 1.427 | 16,889 |
| 2012 | 10,516,100 | 108,576 | 108,189 | 387 | 10.3 | 10.3 | 0.0 | 1.452 | 10,293 |
| 2013 | 10,512,400 | 106,751 | 109,160 | -2,409 | 10.2 | 10.4 | -0.2 | 1.456 | -1,297 |
| 2014 | 10,538,300 | 109,860 | 105,665 | 4,195 | 10.4 | 10.0 | 0.4 | 1.527 | 21,661 |
| 2015 | 10,553,800 | 110,764 | 111,173 | -409 | 10.5 | 10.5 | 0.0 | 1.570 | 15,977 |
| 2016 | 10,578,800 | 112,663 | 107,750 | 4,913 | 10.7 | 10.2 | 0.5 | 1.630 | 20,064 |
| 2017 | 10,610,000 | 114,405 | 111,443 | 2,962 | 10.8 | 10.5 | 0.3 | 1.687 | 28,273 |
| 2018 | 10,649,800 | 114,036 | 112,920 | 1,116 | 10.7 | 10.6 | 0.1 | 1.708 | 38,629 |
| 2019 | 10,693,939 | 112,231 | 112,362 | -131 | 10.5 | 10.5 | -0.0 | 1.709 | 44,270 |
| 2020 | 10,701,777 | 110,200 | 129,289 | -19,089 | 10.3 | 12.1 | -1.8 | 1.710 | 26,927 |
Current vital statistics[]
| Period | Live births | Deaths | Natural increase |
|---|---|---|---|
| January - June 2020 | 54,600 | 57,200 | -2,600 |
| January - June 2021 | 55,000 | 76,300 | -21,300 |
| Difference |
List of 20 largest cities (2019)[]


| Name | Population[8] | Area (km2) | Region |
|---|---|---|---|
| 1 308 632 | 496 | Prague | |
| 380 681 | 230 | South Moravian Region | |
| 289 128 | 214 | Moravian-Silesian Region | |
| 172 441 | 138 | Plzeň Region | |
| 104 445 | 106 | Liberec Region | |
| 100 523 | 103 | Olomouc Region | |
| 94 014 | 56 | South Bohemian Region | |
| 92 952 | 94 | Ústí nad Labem Region | |
| 92 742 | 106 | Hradec Králové Region | |
| 90 688 | 78 | Pardubice Region | |
| 74 997 | 119 | Zlín Region | |
| 71 903 | 32 | Moravian-Silesian Region | |
| 69 054 | 37 | Central Bohemian Region | |
| 66 186 | 87 | Ústí nad Labem Region | |
| 56 638 | 91 | Moravian-Silesian Region | |
| 55 931 | 52 | Moravian-Silesian Region | |
| 52 824 | 57 | Moravian-Silesian Region | |
| 50 845 | 79 | Vysočina Region | |
| 49 575 | 24 | Ústí nad Labem Region | |
| 48 809 | 118 | Ústí nad Labem Region |
Other demographics statistics[]
Demographic statistics according to the World Population Review in 2019.[9]
At the turn of the century, the Czech Republic had one of the lowest fertility rates in the world. While the fertility rate has moved towards European average, it is still well below replacement value and the growth is primarily driven by immigration. The country is currently growing at a very small 0.1% a year.[9]
- One birth every 5 minutes
- One death every 5 minutes
- One net migrant every 44 minutes
- Net gain of one person every 131 minutes
Demographic statistics according to the CIA World Factbook, unless otherwise indicated.[10]
Population[]
- 10,686,269 (July 2018 est.)
Age structure[]


2018
0–14 years:
15.21% (male 834,800 /female 790,128)
15-24 years:
9.34% (male 514,728 /female 483,546)
25-54 years:
43.79% (male 2,404,724 /female 2,275,309)
55-64 years:
12.24% (male 638,130 /female 669,959)
65 years and over:
19.42% (male 865,455 /female 1,209,490)
2017
0–14 years:
15.2% (male 821,275 ; female 778,267 )
15–64 years:
65.7% (male ; female )
65 years and over:
19.1% (male 845,112 ; female 1,174,704 )
2010
0–14 years:
14.2% (male ; female )
15–64 years:
70.6% (male ; female )
65 years and over:
15.2% (male ; female )
2007
0–14 years:
14.2% (male 758,305; female 718,619)
15–64 years:
71.2% (male 3,726,148; female 3,665,225)
65 years and over:
14.6% (male 598,481; female 914,353)
2006
0–14 years:
14.4% (male 760,065; female 719,449)
15–64 years:
71.2% (male 3,683,215; female 3,642,023)
65 years and over:
14.4% (male 582,904; female 899,533)
2005
0–14 years:
14.7% (male 773,028; female 731,833)
15–64 years:
71.1% (male 3,651,018; female 3,627,006)
65 years and over:
14.2% (male 565,374; female 892,879)
2004
0–14 years:
14.9% (male 784,186; female 742,760)
15–64 years:
71.0% (male 3,638,782; female 3,620,219)
65 years and over:
14.0% (male 557,945; female 876,685)
2003
0–14 years:
15.2% (male 797,847; female 756,628)
15–64 years:
70.8% (male 3,625,092; female 3,608,696)
65 years and over:
13.9% (male 551,801; female 871,391)
Median age[]
- total: 42.5 years. Country comparison to the world: 29th
- male: 41.2 years
- female: 43.8 years (2018 est.)
Birth rate[]
- 9.2 births/1,000 population (2018 est.) Country comparison to the world: 203rd
Death rate[]
- 10.5 deaths/1,000 population (2018 est.) Country comparison to the world: 27th
Total fertility rate[]
- 1.46 children born/woman (2018 est.) Country comparison to the world: 203rd
Net migration rate[]
- 2.3 migrant(s)/1,000 population (2018 est.) Country comparison to the world: 45th
Mother's mean age at first birth[]
- 28.1 years (2014 est.)
Urbanization[]
- urban population: 73.8% of total population (2018)
- rate of urbanization: 0.21% annual rate of change (2015-20 est.)

| 1.9 - 2.1 1.7 - 1.9 1.5 - 1.7 1.4 - 1.5 1.3 - 1.4 < 1.3 |
Sex ratio[]
at birth:
1.06 male(s)/female
under 15 years:
1.06 male(s)/female
15–64 years:
1.01 male(s)/female
65 years and over:
0.65 male(s)/female
total population:
0.96 male(s)/female (2007 est.)
Infant mortality rate[]
| Year | Rate |
|---|---|
| 2006 | 3.3 |
| 2007 | 3.1 |
| 2008 | 2.8 |
| 2009 | 2.9 |
| 2010 | 2.7 |
| 2014 | 2.4 |
Life expectancy at birth[]
- total population: 78.9 years. Country comparison to the world: 57th
- male: 76 years
- female: 82.1 years (2018 est.)
Average life expectancy at age 0 of the total population.[12]
| Period | Life expectancy in Years |
|---|---|
| 1950–1955 | 66.86 |
| 1955–1960 | |
| 1960–1965 | |
| 1965–1970 | |
| 1970–1975 | |
| 1975–1980 | |
| 1980–1985 | |
| 1985–1990 | |
| 1990–1995 | |
| 1995–2000 | |
| 2000–2005 | |
| 2005–2010 | |
| 2010–2015 |
Literacy[]
definition: NA (2011 est.)
- total population: 99%
- male: 99%
- female: 99% (2011 est.)
School life expectancy (primary to tertiary education)[]
- total: 17 years
- male: 16 years
- female: 18 years (2016)
Unemployment, youth ages 15-24[]
- total: 7.9%. Country comparison to the world: 143rd
- male: 7.4%
- female: 8.7% (2017 est.)
Ethnic groups[]
The majority of the 10.7 million inhabitants of the Czech Republic are ethnically and linguistically Czech (95%). They are descendants of Slavic people from the Black Sea-Carpathian region who settled in Bohemia, Moravia and parts of present-day Austria in the 6th century AD. Other ethnic groups include Germans, Romani people, Poles, and Hungarians. Historical minorities like Germans and Poles are declining due to assimilation. There is also a growing community from Vietnam. Other ethnic communities like Greeks, Turks, Italians, and Yugoslavs are found in Prague. Since the dissolution of Czechoslovakia, Slovaks living in the Czech Republic have comprised roughly 3% of the population.
There are different groups of national and ethnic minorities in the Czech Republic. The so-called "old minorities" live mostly in specific areas (e.g. Poles in the Zaolzie region, Germans in the Hultschiner region) while the "new minorities" are scattered among the majority population (generally in the larger towns). While some of the minorities have the whole social structure of Czech society[clarification needed] (Poles, Slovaks, Greeks), other represent only some of the social groups (i.e. Russian newcomers of middle class, and Ukrainians and Romani people who generally represent the underclass).[13]
1880-1910[]
| Language | 1880 | 1890 | 1900 | 1910 |
|---|---|---|---|---|
| Czech | 62.5% | 62.4% | 62.4% | 62.9% |
| German | 35.8% | 35.6% | 35.1% | 34.6% |
| Polish | 1.0% | 1.2% | 1.6% | 1.6% |
| Other | 0.7% | 0.8% | 0.9% | 0.9% |
| Total population | 8,222,013 | 8,665,421 | 9,372,140 | 10,078,637 |
After World War I[]
| Ethnic group |
census 1921 1 | census 1930 | census 1950 | census 1961 | census 1970 | census 1980 | census 1991 | census 2001 | census 2011[15] | |||||||||
|---|---|---|---|---|---|---|---|---|---|---|---|---|---|---|---|---|---|---|
| Number | % | Number | % | Number | % | Number | % | Number | % | Number | % | Number | % | Number | % | Number | % | |
| Czechs | 6,758,983 | 67.5 | 7,304,588 | 68.3 | 8,343,558 | 93.9 | 9,023,501 | 94.2 | 9,270,617 | 94.4 | 9,733,925 | 94.6 | 8,363,768 | 81.2 | 9,249,777 | 90.5 | 6,732,104 | 63.7 |
| Moravians | 1,362,313 | 13.2 | 380,474 | 3.7 | 522,474 | 4.9 | ||||||||||||
| Silesians | 44,446 | 0.4 | 10,878 | 0.1 | 12,231 | 0.1 | ||||||||||||
| Slovaks | 15,732 | 0.2 | 44,451 | 0.4 | 258,025 | 2.9 | 275,997 | 2.9 | 320,998 | 3.3 | 359,370 | 3.5 | 314,877 | 3.1 | 193,190 | 1.9 | 149,140 | 1.4 |
| Poles | 103,521 | 1.0 | 92,689 | 0.9 | 70,816 | 0.8 | 66,540 | 0.7 | 64,074 | 0.7 | 66,123 | 0.6 | 59,383 | 0.6 | 51,968 | 0.5 | 39,269 | 0.4 |
| Germans | 3,061,369 | 30.6 | 3,149,820 | 29.5 | 159,938 | 1.8 | 134,143 | 1.4 | 80,903 | 0.8 | 58,211 | 0.6 | 48,556 | 0.5 | 39,106 | 0.4 | 18,772 | 0.3 |
| Ukrainians | 13,343 | 0.1 | 22,657 | 0.2 | 19,384 | 0.2 | 19,549 | 0.2 | 9,794 | 0.1 | 10,271 | 0.1 | 8,220 | 0.1 | 22,112 | 0.2 | 53,603 | 0.5 |
| Rusyns | 1,926 | 0.0 | 1,106 | 0.0 | 739 | 0.0 | ||||||||||||
| Russians | 6,619 | 0.1 | 5,051 | 0.0 | 5,062 | 0.0 | 12,369 | 0.1 | 18,021 | 0.2 | ||||||||
| Vietnamese | 421 | 0.0 | 17,462 | 0.2 | 29,825 | 0.3 | ||||||||||||
| Hungarians | 7,049 | 0.1 | 11,427 | 0.1 | 13,201 | 0.1 | 15,152 | 0.2 | 18,472 | 0.2 | 19,676 | 0.2 | 19,932 | 0.2 | 14,672 | 0.1 | 9,049 | 0.1 |
| Romani people[16] | 227 | 0.0 | 19,770 | 0.2 | 19,392 | 0.2 | 32,903 | 0.3 | 11,746 | 0.1 | 5,199 | 0.0 | ||||||
| Jews | 35,699 | 0.4 | 37,093 | 0.4 | 218 | 0.0 | 521 | 0.0 | ||||||||||
| Yugoslavs | 4,749 | 0.0 | 3,957 | 0.0 | 3,386 | 0.0 | ||||||||||||
| Romanians | 966 | 0.0 | 3,205 | 0.0 | 1,034 | 0.0 | 1,238 | 0.0 | 1,921 | 0.0 | ||||||||
| Others/undeclared | 10,038 | 0.1 | 5,719 | 0.1 | 11,441 | 0.1 | 10,095 | 0.1 | 36,220 | 0.4 | 39,300 | 0.4 | 39,129 | 0.4 | 220,660 | 2.6 | 2,739,4881 | 26.0 |
| Total | 10,005,734 | 10,674,386 | 8,896,133 | 9,571,531 | 9,807,697 | 10,291,927 | 10,302,215 | 10,230,060 | 10,562,214 | |||||||||
| 1 On the territory of the census date. | ||||||||||||||||||
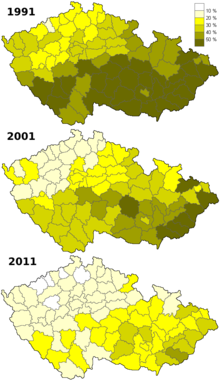
1 In 2011 a large part of the population did not claim any ethnicity, before the census it was widely mediatized that the question is not mandatory. The vast majority of those who did so are presumed to be ethnic Czechs, number of whom dropped by roughly the same amount that the number of undeclared people rose, circa 2.5 million.

Czechs in 1991
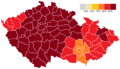
Czechs in 2001

Czechs in 2011


The legal position of the minorities is defined foremost in the Act No. 273/2001 Coll. (The Rights of the Minorities Act) which implements the Charter of Fundamental Rights and Basic Freedoms, Framework Convention for the Protection of National Minorities and Recommendation of the Council of Europe No. 1201. There is a number of other enactments which to lesser extent deal with the minorities.
A special situation applies in the case of Moravians and Silesians, who are frequently allocated within the group of Czechs when it comes to the statistical data.
Officially recognized minorities[]
Minorities, which "traditionally and on a long term basis live within the territory of the Czech Republic" enjoy some privileges. As of 2013 there are 14 such officially recognized minorities, which are (alphabetically): Belarusians, Bulgarians, Croatians, Germans, Greeks, Hungarians, Poles, Romani people, Russians, Rusyns, Serbians, Slovaks, Ukrainians and Vietnamese.[17]
Citizens belonging to the officially recognized minorities enjoy the right to "use their language in communication with authorities and in courts of law". Article 25 of the Czech Charter of Fundamental Rights and Basic Freedoms provides the right of the national and ethnic minorities to education and communication with authorities in their own language. Act No. 500/2004 Coll. (The Administrative Rule) in its paragraph 16 (4) (Procedural Language) provides that a citizen of the Czech Republic who belongs to a national or an ethnic minority, which traditionally and on a long-term basis lives within the territory of the Czech Republic, has the right to address an administrative agency and proceed before it in the language of the minority. In the case that the administrative agency does not have an employee with knowledge of the language, the agency is bound to obtain a translator at the agency's own expense. According to Act No. 273/2001 (About The Rights of Members of Minorities) paragraph 9 (The right to use language of a national minority in dealing with authorities and in the courts of law) the same also applies to members of national minorities in the courts of law.
Bulgarians[]
The economic migration of Bulgarians to the Czech Republic began in the 1990s. 4,363 citizens claimed to have Bulgarian nationality in the 2001 census. They mostly live in the large cities and towns, such as Prague, Brno, Ostrava, Karlovy Vary, Kladno, Ústí nad Labem, Děčín, and Havířov. Nowadays the newcomers from Bulgaria aim for these areas in particular, where they can join an already established community. Many of these economic immigrants have dual citizenship of both the Czech Republic and Bulgaria. However most of the recent immigrants still only have Bulgarian citizenship.
The Bulgarian Cultural Organisation publishes the magazine Roden Glas, while a folklore organisation Kytka promotes traditional Bulgarian dances. Among other organisations are Pirin, Zaedno, Vazraždane and Hyshove.[18]
As an officially recognized minority the Bulgarian citizens of the Czech Republic enjoy the right to use their language in communication with authorities and in the courts of law. They also enjoy a number of other rights connected to the status of recognized minority, e.g. the right to education in their own language: the first Bulgarian school in the current Czech Republic was established in 1946 in Prague.
Germans[]

The German minority of the Czech Republic, historically the largest minority of the country, was almost entirely removed when 3 million were forcibly expelled in 1945–6 on the basis of the Potsdam agreement. The constitution guarantees rights for minority languages, however there are 13 municipalities with German minority constituting 10% of population, which qualifies for such provisions.[20] There is no bilingual education system in Western and Northern Bohemia, where the German minority is mostly concentrated. However, this is in large part due to the absence of German-speaking youth, a heritage of the post-war policy of the Communist government.
According to the 2001 census there remain 13 municipalities and settlements in the Czech Republic with more than 10% Germans.[20]
Many[citation needed] representatives of expellees' organizations support the erection of bilingual signs in all formerly German-speaking territory as a visible sign of the bilingual linguistic and cultural heritage of the region, but their efforts are not supported by some of the current inhabitants, as the vast majority of the current population is not of German descent.
The German-Czech Declaration of 21 January 1997 covered the two most critical issues—the role of some Sudeten Germans in the breakup of Czechoslovakia in 1938 and their expulsion after World War II.[21]
Greeks[]
Another influential minority are Greeks. Large numbers of Greeks arrived in Czechoslovakia during the end of the Greek Civil War. The first transports of Greek children arrived in 1948 and 1949. Later, more transports, also including adults, arrived.[22] They were partly leftists, communists and guerillas with their relatives, hence the willingness of Czechoslovak government to allow the immigration.[23] This was viewed rather as a temporary solution. After the defeat of DSE and other left-wing guerillas, the Greeks stayed in Czechoslovakia. In total more than 12,000 Greeks immigrated to Czechoslovakia between 1948 and 1950.[23] Today, there are about 7000 Greeks in the country (3219 according to 2001 census data),[23] mostly in the 3 biggest towns – Prague, Brno, Ostrava – and also in Bohumín, Havířov, Jeseník, Karviná, Krnov, Šumperk, Třinec, Vrbno pod Pradědem and Žamberk (apart from the last one these towns are in Silesia).[24]
Poles[]
The most concentrated linguistic minority in the Czech Republic are ethnic Poles, historically the plurality, today constituting about 10% of the population of Karviná and Frýdek-Místek districts. Poles have the right to use their language in official dealings; the public media (Czech TV and Czech Radio) regularly broadcast in Polish; and there are many Polish primary and secondary schools in the area. The Polish minority has been decreasing substantially since World War II as education in Polish was difficult to obtain, while Czech authorities did not permit bilingual signs to maintain Polish awareness among the population.
The erection of bilingual signs has technically been permitted since 2001, if a minority constitutes 10% of the population of a municipality. The requirement that a petition be signed by the members of minority was cancelled, thus simplifying the whole process.[25] Still, only a couple of villages with large Polish minorities have bilingual signs (Vendryně/Wędrynia for instance).
Romanis[]
Another minority is the Roma, who nonetheless have very little influence on Czech policy. Around 90% of the Roma that lived in the Czech Republic prior to World War II were exterminated by the Nazi Porajmos. The Roma there now are 80% post-war immigrants from Slovakia or Hungary, or the descendants thereof. In total, the Roma in the CR now number around 200,000.[26] There is Romani press in the CR, written in both Czech and Romani, but Romani radio is broadcast in Czech and there is no Romani television. Romani is also absent from legislative, judiciary, and other political texts but it has recently entered some university and elementary school courses. Life expectancy, literacy, , school enrolment, and other socio-economic markers remain low while Roma compose the majority of prison and habitual offender populations despite accounting for only a fraction of a percent of Czech population.[27]
Immigration[]

According to the Czech Statistical Office as of December 31, 2018 there were 564,345 legal foreign residents in the Czech Republic (5.1% of the total population).[28] Residents from Ukraine are the largest group (131,302), followed by residents of Slovakia (116,817). There are also Asian immigrant communities in the Czech Republic. The largest is the Vietnamese one (61,097) followed by the Mongolians (9,075) and the Chinese (7,485). During the communist era the governments of Czechoslovakia and Vietnam had a deal concerning the education of Vietnamese people in Czechoslovakia. Vietnamese people came to Czechoslovakia for the first time in 1956 and then the number of new migrants grew until the fall of communism. First generation Vietnamese work mostly as small-scale businessmen in markets. Still, many Vietnamese are without Czech citizenship. One of the towns with the largest Vietnamese communities is Cheb. Other large immigrant groups come from Russia (38,033), Poland (21,279), Germany (21,267), Bulgaria (15,593) and Romania (14,684).
Recent trends[]
| Country | 2016 | 2017 | 2018 |
|---|---|---|---|
| 5,778 | 10,340 | 16,747 | |
| 6,706 | 6,328 | 6,671 | |
| 2,404 | 2,891 | 3,388 | |
| 1,752 | 2,196 | 2,264 | |
| 1,648 | 1,829 | 2,184 | |
| 1,331 | 1,620 | 1,977 | |
| 709 | 1,165 | 1,498 | |
| 911 | 1,238 | 1,330 | |
| 751 | 1,001 | 1,158 | |
| 421 | 657 | 1,145 | |
| 551 | 823 | 1,123 | |
| 1,063 | 1,073 | 1,101 | |
| 230 | 414 | 1,041 | |
| Total | 37,503 | 45,957 | 58,148 |
Foreign-born population[]
| Nationality | Population (2019) |
|---|---|
| 145,153 | |
| 121,278 | |
| 61,910 | |
| 38,010 | |
| 21,767 | |
| 21,478 | |
| 17,183 | |
| 16,824 | |
| 9,844 | |
| 8,332 | |
| 7,675 | |
| 7,673 | |
| 7,245 | |
| 6,920 | |
| 5,940 | |
| 5,880 | |
| 5,682 | |
| 5,593 | |
| 4,923 | |
| 4,409 |
- See also
- Armenians in the Czech Republic
- Chinese people in the Czech Republic
- Croats in the Czech Republic
- Germans in the Czech Republic
- Greeks in the Czech Republic
- History of the Jews in the Czech Republic
- Koreans in the Czech Republic
- Macedonians in the Czech Republic
- Mongolians in the Czech Republic
- Polish minority in the Czech Republic
- Romani people in the Czech Republic
- Slovaks in the Czech Republic
- Ukrainians in the Czech Republic
- Vietnamese people in the Czech Republic
Languages[]

The Czech language (divided into three dialects in Bohemia, four dialects in Moravia, and two dialects in Czech Silesia) is the official language of the state. There is also the transitional Cieszyn Silesian dialect as well as the Polish language in Cieszyn Silesia, both spoken in Czech Silesia. Various Sudeten German dialects are currently practically extinct: present Czech Germans speak mainly Czech or Standard German. Czech Sign Language is the language of most of the deaf community.
For other languages spoken in the Czech Republic, see the above section on officially recognised minorities.
Religion[]
| 1991 | 2001 | 2011 | ||||
|---|---|---|---|---|---|---|
| number | % | number | % | number | % | |
| Roman Catholic Church | 4,021,385 | 39.0 | 2,740,780 | 26.8 | 1,083,899 | 10.3 |
| Evangelical Church of Czech Brethren | 203,996 | 2.0 | 117,212 | 1.1 | 51,916 | 0.5 |
| Czechoslovak Hussite Church | 178,036 | 1.7 | 99,103 | 1.0 | 39,276 | 0.4 |
| Believers identified with another specific religion | 120,317 | 1.7 | 330,993 | 3.2 | 292,347 | 2.7 |
| Believers not identified with any specific religion | 707,649 | 6.7 | ||||
| No religion | 4,112,864 | 39.9 | 6,039,991 | 59.0 | 3,612,804 | 34.2 |
| No response, unknown | 1,665,617 | 16.2 | 901,981 | 8.8 | 4,774,323 | 45.2 |
| Total population | 10,302,215 | 10,230,060 | 10,562,214 | |||
Almost half (45.2%) of the Czech population prefer not to respond to religious questions in the Census. Others claim to have no religion or that they are without religious affiliation (34.2%). In comparison, one in every five claims to have some personal belief (20.6%).
The largest denominations are Roman Catholicism, estimated at 10.3% of the population, Protestant (0.5%), Hussites (0.4%). Other organized religions, including non-organized believers, totalled about (9.4%) (as of Census 2011).
According to the most recent Eurobarometer Poll 2005,[37] 19% of Czech citizens responded that "they believe there is a God", whereas 50% answered that "they believe there is some sort of spirit or life force" and 30% that "they do not believe there is any sort of spirit, god, or life force"; the percentage of believers is thus the lowest of EU countries after Estonia with 16%.[38]
See also[]
References[]
- ^ "Population - CZSO". Czech Statistical Office. Retrieved 2021-03-22.
- ^ Jump up to: a b c d e f g h i j k l "EUROPE :: CZECHIA". CIA.gov. Central Intelligence Agency. Retrieved 9 February 2020.
- ^ "Zaostřeno na ženy a muže - 2019". CZSO.cz. Czech Statistical Office.
- ^ "Czech Demographic Handbook 2007". Czech Statistical Office.
- ^ Max Roser (2014), "Total Fertility Rate around the world over the last centuries", Our World In Data, Gapminder Foundation
- ^ "Czech Statistical Office - Population". Czech Statistical Office.
- ^ "Population change".
- ^ "Obsah nenalezen | ČSÚ". www.czso.cz.
- ^ Jump up to: a b "Czech Republic Population 2019", World Population Review
- ^ "The World FactBook - Czechia", The World Factbook, July 12, 2018
- ^ "Total fertility rate by NUTS 3 region". Eurostat.
- ^ "World Population Prospects - Population Division - United Nations". esa.un.org. Retrieved 2018-08-26.
- ^ "Postavení národnostních menšin" (in Czech). Retrieved 2010-12-01.
- ^ [1] Archived April 25, 2012, at the Wayback Machine
- ^ "Tab. 614a Obyvatelstvo podle věku, národnosti a pohlaví" (in Czech). Statistics of Czechia. Retrieved 24 April 2019.
- ^ In census people can leave the "nationality" field empty and they can also write down any nationality or ethnicity they want. Most Romani people fill in the Czech nationality. Thus, the real number of Romani people in the country is estimated to be around 220,000. Petr Lhotka: Romové v České republice po roce 1989 Archived 2007-02-20 at the Wayback Machine
- ^ See Government Council for National Minorities, Belorussian and Vietnamese since 4 July 2013, see Česko má nové oficiální národnostní menšiny. Vietnamce a Bělorusy
- ^ "Bulharská národnostní menšina" (in Czech). Vlada.cz. Retrieved 2010-11-30.
- ^ Statistický lexikon obcí v Republice československé I. Země česká. Prague. 1934.
Statistický lexikon obcí v Republice československé II. Země moravskoslezská. Prague. 1935. - ^ Jump up to: a b Peter Josika: Mehrsprachig: Ein Faktor der Versöhnung at Prager Zeitung, 21 August 2007.
- ^ Wolff, Stefan (2000). German minorities in Europe: ethnic identity and cultural belonging. Berghahn Books. p. 200. ISBN 978-1-57181-504-0.
- ^ "Greeks in Czech Country". Dialogos-kpr.cz. Retrieved 2013-11-19.
- ^ Jump up to: a b c [2] Archived February 11, 2008, at the Wayback Machine
- ^ Vangelis Liolios. "Podkladové materiály pro Radu vlády pro národnostní menšiny o situaci řecké menšiny v České republice" (PDF) (in Czech). Dialogs-kpr.cz. Retrieved 2013-11-19.
- ^ "Aktualności". www.polonica.cz. Retrieved 2013-11-19.
- ^ "European Commission - Languages eac". Ec.europa.eu. 2011-01-13. Retrieved 2013-11-19.
- ^ Říčan, Pavel (1998). S Romy žít budeme – jde o to jak: dějiny, současná situace, kořeny problémů, naděje společné budoucnosti (in Czech). Praha: Portál. ISBN 978-80-7178-250-6.
- ^ "R01Foreigners in the CR in the years 2004–2018 (as at 31 December)" (in Czech).
- ^ "Statistical Yearbook of the Czech Republic - 2018" CZSO
- ^ "Statistical Yearbook of the Czech Republic - 2019" CZSO
- ^ https://www.czso.cz/documents/11292/27320905/c01R04_2019.xlsx/3bc309de-78d4-4ac9-8081-6f6866f86788?version=1.0
- ^ "Europeans and their Languages" (PDF). Ec.europa.eu. Retrieved 2013-11-19.
- ^ "Population by denomination and sex: as measured by 1921, 1930, 1950, 1991 and 2001 censuses" (PDF) (in Czech and English). Czech Statistical Office. Retrieved 2010-03-09.
- ^ "Scitani lidu, domu a bytu 2001". Czso.cz. Archived from the original on 2014-11-03. Retrieved 2013-11-19.
- ^ "Tab 7.1 Population by religious belief and by municipality size groups" (PDF) (in Czech). Czso.cz. Archived from the original (PDF) on 2015-02-21. Retrieved 2013-11-19.
- ^ "Tab 7.2 Population by religious belief and by regions" (PDF) (in Czech). Czso.cz. Retrieved 2013-11-19.
- ^ "Eurobarometer on Social Values, Science and technology 2005 - page 11" (PDF). Archived from the original (PDF) on 2006-05-24. Retrieved 2007-05-05.
- ^ "Social values, Science and Technology" (PDF). Eurobarometer. June 2005. Archived from the original (PDF) on 2006-05-24. Retrieved 2006-12-19.
External links[]
- Czech Statistical Office, state institution responsible to provide official data about Czech Republic
- Official European Union entry
| show Czech Republic articles |
|---|

| show |
|---|
- Demographics of the Czech Republic