Durham County Council elections
This article uses bare URLs, which may be threatened by link rot. (May 2021) |
Elections to Durham County Council are held every four years. The council was created as part of the 1972 local government reforms. The first elections to the new authority were held in 1973 in advance of the council taking office in 1974. As part of changes to local government in 2009, the council became a unitary authority with the first elections to the new council taking place in 2008. Since becoming a unitary authority, 126 councillors have been elected from 63 wards.[1]
Political control[]
Durham was the first County Council to be controlled by Labour, who took power in 1919. Prior to 1973 political control has been held by the following parties:[2]
County Council
| Party in control | Years | |
|---|---|---|
| Labour | 1919-1922 | |
| Labour minority | 1922-1925 | |
| Labour | 1925-1973 | |
Since 1973 political control of the council has been held by the following parties:[3][4]
Non-metropolitan county
| Party in control | Years | |
|---|---|---|
| Labour | 1973-2009 | |
Unitary authority
| Party in control | Years | |
|---|---|---|
| Labour | 2008–2021 | |
| No Overall Control | 2021–Present | |
County council elections[]
| Election | Labour | Conservative | Liberal Democrat[a] | Independent | Total |
|---|---|---|---|---|---|
| 1973[5] | 56 | 2 | 6 | 7 | 72[6] |
| 1977[7] | 41 | 14 | 7 | 10 | 72 |
| 1981[8] | 53 | 7 | 6 | 6 | 72 |
| 1985[9] | 50 | 5 | 7[b] | 10[c] | 72 |
| 1989[10] | 56 | 7 | 5 | 4 | 72 |
| 1993[11] | 56 | 6 | 6 | 4 | 72 |
| 1997[12] | 53 | 2 | 2 | 4 | 61 |
| [13] | 53 | 2 | 4 | 2 | 61 |
| 2005[14] | 53 | 2 | 5 | 3 | 63 |
| 2008[15] | 67 | 10 | 27 | 22 | 126 |
| 2013[16] | 94 | 4 | 9 | 19 | 126 |
| 2017 | 74 | 10 | 14 | 28 | 126 |
| 2021 | 53 | 24 | 17 | 32 | 126 |
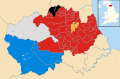
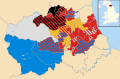
County result maps[]
2005 results map
2008 results map

2013 results map

2017 results map

2021 results map


District council elections[]
Prior to the formation of the unitary authority in 2009, the county was divided into a number of second tier districts. The following articles detail the local elections to those district councils. The Borough of Darlington has formed a unitary authority outside the area covered by the County Council since 1997.
- Chester-le-Street District Council elections, 1973 – 2009 (council abolished)
- Durham City Council elections, 1973 – 2009 (council abolished)
- Darlington Borough Council elections, 1973 – 1997 (unitary authority 1997 – present)
- Derwentside District Council elections, 1973 – 2009 (council abolished)
- Easington District Council elections, 1973 – 2009 (council abolished)
- Sedgefield Borough Council elections, 1973 – 2009 (council abolished)
- Teesdale District Council elections, 1973 – 2009 (council abolished)
- Wear Valley District Council elections, 1973 – 2009 (council abolished)
By-election results[]
The following is an incomplete list of by-elections to Durham County Council.
1997-2008[]
| Party | Candidate | Votes | % | ±% | |
|---|---|---|---|---|---|
| Liberal Democrats | 689 | 42.9 | +1.2 | ||
| Labour | 601 | 37.4 | -21.0 | ||
| Conservative | 318 | 19.8 | +19.8 | ||
| Majority | 88 | 5.5 | |||
| Turnout | 1,608 | 22.5 | |||
| Liberal Democrats gain from Labour | Swing | ||||
| Party | Candidate | Votes | % | ±% | |
|---|---|---|---|---|---|
| Independent | Reginald Ord | 519 | 37.2 | +2.2 | |
| Labour | 500 | 35.8 | -18.3 | ||
| Liberal Democrats | 322 | 23.1 | +23.1 | ||
| Conservative | 54 | 3.9 | -7.1 | ||
| Majority | 19 | 1.4 | |||
| Turnout | 1,395 | 22.0 | |||
| Independent gain from Labour | Swing | ||||
| Party | Candidate | Votes | % | ±% | |
|---|---|---|---|---|---|
| Labour | Leslie Vaux | 1,702 | 56.1 | -20.6 | |
| Liberal Democrats | David Rolfe | 566 | 18.7 | +4.3 | |
| BNP | Dean McAdam | 509 | 16.8 | +16.8 | |
| Conservative | Stuart Tilney | 256 | 8.4 | -0.5 | |
| Majority | 1,136 | 37.4 | |||
| Turnout | 3,033 | 46.4 | |||
| Labour hold | Swing | ||||
| Party | Candidate | Votes | % | ±% | |
|---|---|---|---|---|---|
| Labour | John Lethbridge | 1,538 | 66.3 | -2.0 | |
| Liberal Democrats | Jody Dunn | 782 | 33.7 | +9.6 | |
| Majority | 756 | 32.6 | |||
| Turnout | 2,320 | 43.7 | |||
| Labour hold | Swing | ||||
| Party | Candidate | Votes | % | ±% | |
|---|---|---|---|---|---|
| Labour | Abiodun Williams | 834 | 51.6 | +4.8 | |
| Liberal Democrats | Isobell Lunan | 561 | 34.7 | -9.1 | |
| Conservative | Michael Fishwick | 220 | 13.6 | +4.2 | |
| Majority | 273 | 16.9 | |||
| Turnout | 1,615 | 34.0 | |||
| Labour hold | Swing | ||||
| Party | Candidate | Votes | % | ±% | |
|---|---|---|---|---|---|
| Labour | George Burlison | 1,187 | 43.4 | -5.5 | |
| Liberal Democrats | Redvers Crooks | 1,037 | 37.9 | -2.9 | |
| Independent | Ian Rutland | 267 | 9.8 | +9.8 | |
| Conservative | Patricia Wynne | 245 | 9.0 | -1.4 | |
| Majority | 150 | 5.5 | |||
| Turnout | 2,737 | 37.1 | |||
| Labour hold | Swing | ||||
| Party | Candidate | Votes | % | ±% | |
|---|---|---|---|---|---|
| Labour | Edwin Mason | 775 | 84.0 | +4.3 | |
| Conservative | Lucille Nicholson | 148 | 16.0 | -4.3 | |
| Majority | 627 | 68.0 | |||
| Turnout | 923 | 18.7 | |||
| Labour hold | Swing | ||||
| Party | Candidate | Votes | % | ±% | |
|---|---|---|---|---|---|
| Labour | Colin Carr | 665 | 57.7 | -2.8 | |
| Liberal Democrats | Sean Kilkenny | 487 | 42.3 | +19.2 | |
| Majority | 178 | 15.4 | |||
| Turnout | 1,152 | 18.6 | |||
| Labour hold | Swing | ||||
2008-2012[]
| Party | Candidate | Votes | % | ±% | |
|---|---|---|---|---|---|
| Conservative | James Rowlandson | 1,263 | 46.9 | +4.2 | |
| Independent | Anthony Cooke | 634 | 23.5 | -20.0 | |
| Liberal Democrats | Michael Newlands | 479 | 17.8 | +17.8 | |
| Labour | Sharon Longcroft | 319 | 11.8 | -1.9 | |
| Majority | 629 | 23.4 | |||
| Turnout | 2,695 | 38.9 | |||
| Conservative hold | Swing | ||||
| Party | Candidate | Votes | % | ±% | |
|---|---|---|---|---|---|
| Labour | Alan Barker | 702 | 55.8 | -8.3 | |
| Independent | Terry Murray | 311 | 24.7 | +24.7 | |
| Liberal Democrats | Carole Harrison | 126 | 10.0 | -25.9 | |
| Conservative | Mergaret Reid | 120 | 9.5 | +9.5 | |
| Majority | 391 | 31.1 | |||
| Turnout | 1,259 | 20.9 | |||
| Labour hold | Swing | ||||
2012-2016[]
| Party | Candidate | Votes | % | ±% | |
|---|---|---|---|---|---|
| Labour | Andrea Patterson | 741 | 40.3 | ||
| Independent | Ian Hirst | 496 | 27.0 | ||
| Wear Valley Independent Group | John Bailey | 360 | 19.6 | ||
| Liberal Democrats | David English | 145 | 7.9 | ||
| Conservative | Beaty Bainbridge | 54 | 2.9 | ||
| Green | Joanne Yelland | 41 | 2.2 | ||
| Majority | 245 | 13.3 | |||
| Turnout | 1837 | 18.6 | |||
| Labour hold | Swing | ||||
2016-present[]
| Party | Candidate | Votes | % | ±% | |
|---|---|---|---|---|---|
| Labour | Leanne Kennedy | 693 | 52.3 | +6.2 | |
| Seaham Community Party | Robert Arthur | 633 | 47.7 | +10.8 | |
| Majority | 60 | 4.6 | |||
| Turnout | 1,329 | 21.3 | |||
| Labour hold | Swing | ||||
Notes[]
- ^ Liberal Party prior to 1981, SDP-Liberal Alliance in 1983, Social and Liberal Democrats in 1989
- ^ 3 Liberal, 4 SDP
- ^ Includes five of other parties
References[]
- ^ "Councillors - general information". Durham County Council. Archived from the original on 25 April 2010. Retrieved 7 February 2010.
- ^ Bulmer, Martin (2015). Mining and Social Change (Routledge Revivals): Durham County in the Twentieth Century. Routledge. p. 129. ISBN 9781317448488.
- ^ "Durham". BBC News Online. 19 April 2008. Retrieved 7 February 2010.
- ^ "Local election results: Durham". BBC News Online. Retrieved 7 February 2010.
- ^ "Labour take over metropolitan counties and 11 other councils". The Times. 14 April 1973. p. 3.
- ^ Including one seat vacant after election
- ^ "Conservatives triumphant in Greater London and Metropolitan counties". The Times. 6 May 1977. p. 4.
- ^ "GLC results in full: big Labour gains in the counties". The Times. 8 May 1981. p. 4.
- ^ "County Council elections". The Times. 3 May 1985. p. 5.
- ^ "County council election results". The Times. 5 May 1989. p. 5.
- ^ "Results". The Times. 7 May 1993. p. 9.
- ^ "County Councils". The Times. 3 May 1997. p. 10.
- ^ "Durham". BBC News. Retrieved 14 April 2013.
- ^ "Durham". BBC News. Retrieved 14 April 2013.
- ^ "Durham". BBC News. 2 May 2008. Retrieved 14 April 2013.
- ^ "Results for Durham". BBC News. 3 May 2013. Retrieved 3 May 2013.
- ^ "Lib Dem win follows family tradition". guardian.co.uk. London. 29 November 2002. Retrieved 7 February 2010.
- ^ "Lib Dems fail in key bylelection". guardian.co.uk. London. 27 January 2006. Retrieved 7 February 2010.
- ^ "Burlison retains seat for Labour". The Journal. 10 June 2006. p. 35.
- ^ "Mixed results for Tories in council byelections". guardian.co.uk. London. 20 October 2006. Retrieved 7 February 2010.
- ^ "News in brief". The Northern Echo. 2 December 2006. p. 15.
- ^ "Declaration of result of poll" (PDF). Durham County Council. Archived from the original (PDF) on 4 February 2010. Retrieved 7 February 2010.
- ^ "Labour maintains majority on Durham County Council with Easington victory". The Northern Echo. 12 February 2010. Retrieved 12 February 2010.
- ^ "Archived copy" (PDF). Archived from the original (PDF) on 4 March 2016. Retrieved 27 June 2014.
{{cite web}}: CS1 maint: archived copy as title (link) - ^ http://www.durham.gov.uk/media/22036/Declaration-of-result---Dawdon-division-29-June-2017/pdf/DeclarationOfResultDawdonDivision20170629.pdf
External links[]
| Durham County Council | |
|---|---|
| Darlington Borough Council | |
| Hartlepool Borough Council | |
| Stockton-on-Tees Borough Council | |
| Cleveland County Council |
|
| Chester-le-Street District Council |
|
| Durham City Council |
|
| Derwentside District Council |
|
| Easington District Council |
|
| Sedgefield Borough Council | |
| Teesdale District Council |
|
| Wear Valley District Council |
|
| Tees Valley Mayor |
|
| |

- Durham County Council elections
- Council elections in County Durham
- Unitary authority elections in England