Güímar
Güímar | |
|---|---|
 Pyramid of Güímar | |
 Flag  Coat of arms | |
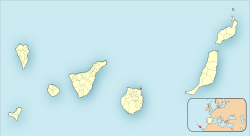
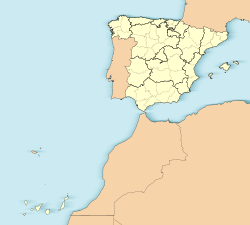
 Municipal location in Tenerife | |
 Güímar Location in Tenerife | |
| Coordinates: 28°18′54″N 16°24′36″W / 28.31500°N 16.41000°WCoordinates: 28°18′54″N 16°24′36″W / 28.31500°N 16.41000°W | |
| Country | |
| Autonomous Community | |
| Province | Tenerife |
| Island | Tenerife |
| Government | |
| • Mayor | Carmen Luisa Castro Dorta (PP) |
| Area | |
| • Total | 102.9 km2 (39.7 sq mi) |
| Elevation (AMSL) | 289 m (948 ft) |
| Population (2018)[1] | |
| • Total | 19,739 |
| • Density | 190/km2 (500/sq mi) |
| Time zone | UTC+0 (CET) |
| • Summer (DST) | UTC+1 (CEST (GMT +1)) |
| Postal code | 38500 |
| Area code(s) | +34 (Spain) + 922 (Tenerife) |
| Climate | BSh |
| Website | www.guimar.es |

Güímar (Spanish pronunciation: [ˈgwimaɾ]) is the name of a municipality, town and valley in the eastern part of the Spanish island of Tenerife, one of the Canary Islands, and part of Santa Cruz de Tenerife (province). The municipality extends for 102.9 square kilometers from the mountainous interior to the beaches on the Atlantic, and borders the municipalities of La Orotava, Arafo and Fasnia. Its estimated population is 18,589 (2013). The TF-1 motorway passes through the municipality.
The municipality is famous for its pyramids. It is also the location of the barranco de Badajoz. A portion of its volcanic landscape has been set aside as the Nature reserve of Malpaís of Güímar, its highest point being Montaña Grande.

Aloe vera cultivation in a greenhouse in Güímar
Climate[]
| hideClimate data for Güímar (altitude: 289 metres (948 feet)) | |||||||||||||
|---|---|---|---|---|---|---|---|---|---|---|---|---|---|
| Month | Jan | Feb | Mar | Apr | May | Jun | Jul | Aug | Sep | Oct | Nov | Dec | Year |
| Average high °C (°F) | 18.5 (65.3) |
18.7 (65.7) |
19.9 (67.8) |
20.7 (69.3) |
21.8 (71.2) |
23.8 (74.8) |
26.3 (79.3) |
27.5 (81.5) |
26.1 (79.0) |
24.5 (76.1) |
21.4 (70.5) |
19.5 (67.1) |
22.4 (72.3) |
| Daily mean °C (°F) | 15.4 (59.7) |
15.6 (60.1) |
16.5 (61.7) |
17.1 (62.8) |
18.1 (64.6) |
20.1 (68.2) |
22.3 (72.1) |
23.1 (73.6) |
22.5 (72.5) |
21.0 (69.8) |
18.4 (65.1) |
16.4 (61.5) |
18.9 (66.0) |
| Average low °C (°F) | 12.4 (54.3) |
12.5 (54.5) |
13.1 (55.6) |
13.5 (56.3) |
14.5 (58.1) |
16.5 (61.7) |
18.3 (64.9) |
18.8 (65.8) |
18.9 (66.0) |
17.5 (63.5) |
15.4 (59.7) |
13.4 (56.1) |
15.4 (59.7) |
| Average rainfall mm (inches) | 57 (2.2) |
45 (1.8) |
40 (1.6) |
20 (0.8) |
9 (0.4) |
4 (0.2) |
1 (0.0) |
1 (0.0) |
7 (0.3) |
37 (1.5) |
67 (2.6) |
73 (2.9) |
361 (14.3) |
| Source: Climate-Data.org[2] | |||||||||||||
References[]
- ^ Municipal Register of Spain 2018. National Statistics Institute.
- ^ "Clima Güímar".
External links[]
| show Places adjacent to Güímar |
|---|
| show Municipalities in the province of Santa Cruz de Tenerife |
|---|
| show Authority control |
|---|
Categories:
- Municipalities in Tenerife