Gülitz-Reetz
Gülitz-Reetz | |
|---|---|
show Location of Gülitz-Reetz within Prignitz district | |
 Gülitz-Reetz | |
| Coordinates: 53°12′00″N 11°58′59″E / 53.20000°N 11.98306°ECoordinates: 53°12′00″N 11°58′59″E / 53.20000°N 11.98306°E | |
| Country | Germany |
| State | Brandenburg |
| District | Prignitz |
| Municipal assoc. | Putlitz-Berge |
| Government | |
| • Mayor (2019–24) | Detlef Spiegelberg[1] |
| Area | |
| • Total | 24.27 km2 (9.37 sq mi) |
| Highest elevation | 70 m (230 ft) |
| Lowest elevation | 50 m (160 ft) |
| Population (2020-12-31)[2] | |
| • Total | 454 |
| • Density | 19/km2 (48/sq mi) |
| Time zone | UTC+01:00 (CET) |
| • Summer (DST) | UTC+02:00 (CEST) |
| Postal codes | 19348 |
| Dialling codes | 038782 |
| Vehicle registration | PR |


Gülitz-Reetz is a municipality in the Prignitz district, in Brandenburg, Germany.
Demography[]
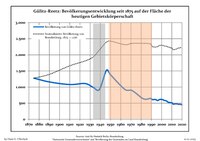
Development of population since 1875 within the current boundaries (Blue line: Population; Dotted line: Comparison to population development of Brandenburg state; Grey background: Time of Nazi rule; Red background: Time of communist rule)
|
|
|
References[]
- ^ Landkreis Prignitz Wahl der Bürgermeisterin / des Bürgermeisters, accessed 2 July 2021.
- ^ "Bevölkerung im Land Brandenburg nach amtsfreien Gemeinden, Ämtern und Gemeinden 31. Dezember 2020". Amt für Statistik Berlin-Brandenburg (in German). June 2021.
- ^ Detailed data sources are to be found in the Wikimedia Commons.Population Projection Brandenburg at Wikimedia Commons
| Authority control |
|
|---|
This Brandenburg location article is a stub. You can help Wikipedia by . |
Categories:
- Municipalities in Brandenburg
- Localities in Prignitz
- Province of Brandenburg
- Bezirk Schwerin
- Brandenburg geography stubs