Gantt chart
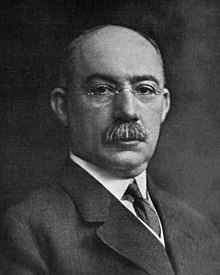
A Gantt chart is a type of bar chart that illustrates a project schedule, named after its inventor, Henry Gantt (1861–1919), who designed such a chart around the years 1910–1915.[1][2] Modern Gantt charts also show the dependency relationships between activities and the current schedule status.
Definition[]
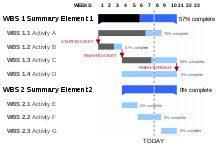
A Gantt chart is a type of bar chart[3][4] that illustrates a project schedule.[5] This chart lists the tasks to be performed on the vertical axis, and time intervals on the horizontal axis.[3][6] The width of the horizontal bars in the graph shows the duration of each activity.[6][7] Gantt charts illustrate the start and finish dates of the terminal elements and summary elements of a project. Terminal elements and summary elements constitute the work breakdown structure of the project. Modern Gantt charts also show the dependency (i.e., precedence network) relationships between activities. Gantt charts can be used to show current schedule status using percent-complete shadings and a vertical "TODAY" line.
Gantt charts are sometimes equated with bar charts.[7][8]
Gantt charts are usually created initially using an early start time approach, where each task is scheduled to start immediately when its prerequisites are complete. This method maximizes the float time available for all tasks.[3]
Historical development[]
Although widely used in project planning in the present day, Gantt charts were considered revolutionary when introduced.[9] The first known tool of this type was developed in 1896 by Karol Adamiecki, who called it a harmonogram.[10] Adamiecki did not publish his chart until 1931, however, and only in Polish, which limited both its adoption and recognition of his authorship.
In 1912, published what would be considered Gantt charts while discussing a construction project. It appears that Schürch's charts were not notable but rather routine in Germany at the time they were published.[11][12][13] The prior development leading to Schürch's work is unknown.[14] Unlike later Gantt charts, Schürch's charts did not display interdependencies, leaving them to be inferred by the reader. These were also static representations of a planned schedule.[15]
The chart is named after Henry Gantt (1861–1919), who designed his chart around the years 1910–1915.[1][2] Gantt originally created his tool for systematic, routine operations. He designed this visualization tool to more easily measure productivity levels of employees and gauge which employees were under- or over-performing. Gantt also frequently included graphics and other visual indicators in his charts to track performance. [16]
One of the first major applications of Gantt charts was by the United States during World War I, at the instigation of General William Crozier.[17]
The earliest Gantt charts were drawn on paper and therefore had to be redrawn entirely in order to adjust to schedule changes. For many years, project managers used pieces of paper or blocks for Gantt chart bars so they could be adjusted as needed.[18] Gantt's collaborator Walter Polakov introduced Gantt charts to the Soviet Union in 1929 when he was working for the Supreme Soviet of the National Economy. They were used in developing the First Five Year Plan, supplying Russian translations to explain their use.[19][20]
In the 1980s, personal computers allowed widespread creation of complex and elaborate Gantt charts. The first desktop applications were intended mainly for project managers and project schedulers. With the advent of the Internet and increased collaboration over networks at the end of the 1990s, Gantt charts became a common feature of web-based applications, including collaborative groupware.[citation needed] By 2012, almost all Gantt charts were made by software which can easily adjust to schedule changes.[18]
In 1999, Gantt charts were identified as "one of the most widely used management tools for project scheduling and control".[3]
Example[]
In the following tables there are seven tasks, labeled a through g. Some tasks can be done concurrently (a and b) while others cannot be done until their predecessor task is complete (c and d cannot begin until a is complete). Additionally, each task has three time estimates: the optimistic time estimate (O), the most likely or normal time estimate (M), and the pessimistic time estimate (P). The expected time (TE) is estimated using the beta probability distribution for the time estimates, using the formula (O + 4M + P) ÷ 6.
| Activity | Predecessor | Time estimates (in days) | Expected time (TE) | ||
|---|---|---|---|---|---|
| Opt. (O) | Normal (M) | Pess. (P) | |||
| a | — | 2 | 4 | 6 | 4.00 |
| b | — | 3 | 5 | 9 | 5.33 |
| c | a | 4 | 5 | 7 | 5.17 |
| d | a | 4 | 6 | 10 | 6.33 |
| e | b, c | 4 | 5 | 7 | 5.17 |
| f | d | 3 | 4 | 8 | 4.50 |
| g | e | 3 | 5 | 8 | 5.17 |
Once this step is complete, one can draw a Gantt chart or a network diagram.
 A Gantt chart created using Microsoft Project (MSP). Note (1) the critical path is in red, (2) the slack is the black lines connected to non-critical activities, (3) since Saturday and Sunday are not work days and are thus excluded from the schedule, some bars on the Gantt chart are longer if they cut through a weekend.

Progress Gantt charts[]
In a progress Gantt chart, tasks are shaded in proportion to the degree of their completion: a task that is 60% complete would be 60% shaded, starting from the left. A vertical line is drawn at the time index when the progress Gantt chart is created, and this line can then be compared with shaded tasks. If everything is on schedule, all task portions left of the line will be shaded, and all task portions right of the line will not be shaded. This provides a visual representation of how the project and its tasks are ahead or behind schedule.[21]
Linked Gantt charts[]
Linked Gantt charts contain lines indicating the dependencies between tasks. However, linked Gantt charts quickly become cluttered in all but the simplest cases. Critical path network diagrams are superior to visually communicate the relationships between tasks.[22] Nevertheless, Gantt charts are often preferred over network diagrams because Gantt charts are easily interpreted without training, whereas critical path diagrams require training to interpret.[8] Gantt chart software typically provides mechanisms to link task dependencies, although this data may or may not be visually represented.[3] Gantt charts and network diagrams are often used for the same project, both being generated from the same data by a software application.[3]
See also[]
- Critical path method
- Event chain methodology
- Float (project management)
- Henry Gantt
- List of project management software, which includes specific Gantt chart software.
- Program evaluation and review technique (PERT)
- Event chain diagram
Citations[]
- ^ Jump up to: a b Gantt 1910.
- ^ Jump up to: a b Morris 1997, p. 7.
- ^ Jump up to: a b c d e f Klein 1999, p. 49.
- ^ Richman 2002, pp. 97, 117, 276.
- ^ Kumar, Pankaja Pradeep (2005). "Effective Use of Gantt Chart for Managing Large Scale Projects". Cost Engineering. Morgantown, WV: American Association of Cost Engineers. 47 (7): 13–21. ISSN 0274-9696. OCLC 209778284.
- ^ Jump up to: a b Richman 2002, pp. 117, 276.
- ^ Jump up to: a b Selig 2008, p. 235.
- ^ Jump up to: a b Flouris & Lock 2012, p. 236, Chapter 12.
- ^ Wilson 2003.
- ^ Marsh 1974, p. 32.
- ^ Weaver 2012a, pp. 5–6.
- ^ Weaver 2012b, pp. 4–6.
- ^ Weaver 2017, pp. 6–7.
- ^ Weaver 2017, p. 7.
- ^ Weaver 2017, p. 6.
- ^ Geraldi, Joana; Lechter, Thomas (2012). "Gantt charts revisited". International Journal of Managing Projects in Business. 5 (4): 578-594. doi:10.1108/17538371211268889.
- ^ Clark 1922.
- ^ Jump up to: a b Flouris & Lock 2012, p. 281, Chapter 14.
- ^ Kelly, D. J. (2004) "Marxist Manager Amidst the Progressives: Walter N. Polakov and the Taylor Society", Journal of Industrial History, 6(2), November 2004, 61-75
- ^ Olson, Richard G. (2015). Scientism and Technocracy in the Twentieth Century: The Legacy of Scientific Management. Lexington Books. ISBN 9781498525718. Retrieved 25 September 2018.
- ^ Klein 1999, pp. 56–57.
- ^ Flouris & Lock 2012, p. 239, Chapter 12.
References[]
- Clark, Wallace (1922). The Gantt Chart: A Working Tool of Management. New York, NY: Ronald Press.
- Flouris, Triant G.; Lock, Dennis (2012). Managing Aviation Projects from Concept to Completion. Ashgate Publishing Limited. ISBN 978-1-4094-8613-8.
- Gantt, H.L. (1910). "Work, Wages and Profit". Engineering Magazine. New York.; republished as Work, Wages and Profits. Easton, Pennsylvania: Hive Publishing Company. 1974. ISBN 0-87960-048-9.
- Klein, R. (1999). Scheduling of Resource-Constrained Projects. Operations Research/Computer Science Interfaces Series. Springer US. ISBN 978-0-7923-8637-7.
- Marsh, Edward R. (1974). "The Harmonogram of Karol Adamiecki". Academy of Management Proceedings. 1974: 32. doi:10.5465/ambpp.1974.17530521. ISSN 0065-0668.
- Morris, Peter W. G. (1997) [1994]. The Management of Projects. Thomas Telford. ISBN 978-0-7277-2593-6.
- Richman, L. (2002). Project Management Step-by-step. Amacom. p. 117. ISBN 978-0-8144-2657-9.
- Selig, Gad J. (2008). Implementing IT Governance: A Practical Guide to Global Best Practices in IT Management. Van Haren Publishing. ISBN 978-90-8753-774-6.
- Weaver, Patrick (2012a). "Henry L Gantt, 1861–1919: A retrospective view of his work" (PDF). PM World Journal. Retrieved 29 January 2018. (It is unclear when this was last modified. The PDF metadata indicates 2015, and a note in the text says "Augmented with additional materials received since publication".)
- Weaver, Patrick (2012b). "Henry L Gantt, 1861–1919: Debunking the myths, a retrospective view of his work" (PDF). 1 (5). Retrieved 29 January 2018. Cite journal requires
|journal=(help) - Weaver, Patrick (2017). "A Brief History of Scheduling: Back to the Future" (PDF). Retrieved 29 January 2018. Cite journal requires
|journal=(help) Adapted from "A Brief History of Scheduling: Back to the Future" (PDF). PM World Journal. 3 (8). 2014. Adapted from an even earlier 2006 presentation. - Wilson, James M. (2003). "Gantt charts: A centenary appreciation" (PDF). European Journal of Operational Research. 149 (2): 430–437. doi:10.1016/S0377-2217(02)00769-5. Archived from the original (PDF) on 26 November 2013. Retrieved 28 July 2013.
Further reading[]
- Burkhard, Remo Aslak; Meier, Michael; Rodgers, Peter; Smis, Matthias Thomas Jelle; Stott, Jonathan (2005). Knowledge visualization: A comparative study between Project Tube Maps and Gantt Charts. 5th International Conference on Knowledge Management. Graz, Austria: University of Kent. Retrieved 17 September 2017.
- Geraldi, Joana; Lechter, Thomas (2012). "Gantt charts revisited: A critical analysis of its roots and implications to the management of projects today". International Journal of Managing Projects in Business. 5 (4): 578–594. doi:10.1108/17538371211268889.
- Kumar, Pankaja Pradeep (2005). "Effective use of Gantt chart for managing large scale projects". Cost Engineering. 47 (7): 14–21. ISSN 0274-9696. Retrieved 17 September 2017.
- Marsh, Edward R. (1975). "The Harmonogram of Karol Adamiecki". Academy of Management Journal. 18 (2): 358–364. doi:10.2307/255537. JSTOR 255537.
- Maylor, Harvey (2001). "Beyond the Gantt chart: Project management moving on". European Management Journal. 19 (1): 92–100. doi:10.1016/S0263-2373(00)00074-8.
- Schürch, Hermann (1915), "Der Bau des Talüberganges bei Langwies an der elektrischen Bahn Chur-Arosa" [The construction of the valley crossing at Langwies of the Chur-Arosa electric railway line] (PDF), Armierter Beton: Monatsschrift für Theorie und Praxis des gesamten Betonbaues (Reinforced concrete: Monthly for theory and practice of the entire concrete construction) (in German), Berlin: Springer, 8 (10), pp. 229–238, retrieved 29 January 2018
- Virine, Lev & Trumper, Michael (2013), ProjectThink. Why Good Managers Make Poor Project Choices, Gower Pub Co., ISBN 978-1409454984CS1 maint: multiple names: authors list (link)
- Virine, Lev & Trumper, Michael (2017), Project Risk Analysis Made Ridiculously Simple, World Scientific Publishing, ISBN 978-9814759373CS1 maint: multiple names: authors list (link)
- Weaver, Patrick. "Henry L. Gantt: A Retrospective view of his work". Retrieved 29 January 2018.
- Weaver, Patrick. "A Brief History of Scheduling".
External links[]
| Wikimedia Commons has media related to Gantt charts. |
| Look up gantt chart in Wiktionary, the free dictionary. |
- Long-running discussion regarding limitations of the Gantt chart format, and alternatives, on Edward Tufte's website
- Diagrams
- Planning
- Project management techniques
- Technical drawing
- Schedule (project management)
- Charts