Genetic studies on Croats
Population genetics is a scientific discipline which contributes to the examination of the human evolutionary and historical migrations. Particularly useful information is provided by the research of two uniparental markers within our genome, the Y-chromosome (Y-DNA) and mitochondrial DNA (mtDNA), as well as autosomal DNA. The data from Y-DNA and autosomal DNA suggests that the Croats mostly are descendants of the Slavs from medieval migration period, according to mtDNA have genetic diversity which fits within a broader European maternal genetic landscape, and overall have an uniformity with other South Slavs from the territory of former Yugoslavia.
There are many Paleolithic period sites located in the territory of Croatia, mostly ascribed to the Mousterian phase in the Middle Paleolithic period. In the Neolithic period in Southeast Europe were founded major cultures like Vinča, Varna, Starčevo. In the Bronze Age happened symbiosis between Proto-Indo-Europeans of Kurgan culture and autochthonous populations, leading to the formation among others also of Proto-Illyrians. They gradually mixed and were assimilated by the Romans, Celts, Avars, and finally Slavs since the 6th century. An additional significant migration happened from Bosnia and Herzegovina, an expansion which was influenced by the Ottoman Empire's conquest since the 15th century, as well by Croatian immigration prior and post World Wars I and II and Croatian War of Independence.
Y chromosome DNA[]
Prehistoric Y-DNA[]
In the 2014 study, of the three successfully generated SNP profiles of Neolithic Starčevo culture samples from Vinkovci, two belonged to Y-DNA haplogroup G2a-P15 and one to I2a1-P37.2, which could indicate G2a as potential representatives of the spread of farming from the Near East to Europe, while I2a as Mesolithic substratum in Europe.[1]
In the 2018 study, 10 out of 17 samples from Croatia had a successful Y-DNA sequencing; two Croatia Cardial Neolithic (6005-5786 BCE) samples from Zemunica Cave belonged to C1a2 and E1b1b1a1b1, Early-Neolithic Starčevo (5837-5659 BCE) from Beli Manastir-Popova zemlja to C, Early-Neolithic Croatia Impressa (5641-5560 BCE) from Kargadur to G2a2a1, two Middle-Neolithic Sopot (5207-4546 BCE) samples from Osijek to G2a2a1 and J2a1, Late-Neolithic Sopot (4790-4558 BCE) from Beli Manastir-Popova zemlja to I, two Vučedol (2884-2582 BCE) samples from Beli Manastir-Popova zemlja and Vucedol Tell to R1b1a1a2a2 and G2a2a1a2a, and the Early-Middle Bronze Age (1631-1521 BCE) sample from Veliki Vanik belonged to J2b2a.[2]
Contemporary Y-DNA[]
Genetically, on the paternal Y chromosome line and studies published between 2003 and 2008, a majority (>85%) of male Croats from Croatia belongs to one of the three major European Y-DNA haplogroups - I (38%[3][4][5]-44%[6]), R1a (27%[6]-34%[3][4][5]) and R1b (12.4%[6]-15%[3][4][5]), while a minority (>15%) mostly belongs to haplogroup E (9%[6]), and others to haplgroups J (4.4%[6]), N (2%[6]), and G (1%[6]). According to most recent and extensive studies published between 2012 and 2016, a majority (75%) of male Croats from Croatia belongs to haplogroups I (38%-43%), R1a (22%-25%) and R1b (8%-9%), while a minority (25%) mostly belongs to haplogroups E (10%), J (7%-10%), G (2%-4%), H (0.3-1.8%), and N (<1%).[7][8]

Haplogroup I among Croats from Croatia is around 43.5%,[7] while in Šokci, a subgroup of Croats from eastern Croatia, is between 44% and 50% of the same haplogroup.[9][10] It is divided in two major subdivisions - subclade I2 (37.7%), typical for the populations of the Balkans and Eastern Europe, and I1 (5.8%), typical for the populations of Scandinavia.[6] From the I2 subclade, the most prevailing is I2a1a (I-P37.2) i.e. its subclade I-M423 (18,400-14,000 YBP) > I-Y3104 (14,000-11,400 YBP) > I-L621 (11,400-6,500 YBP) > I-CTS10936 (6,500-5,600 YBP) > I-S19848 (5,600 YBP) > I-CTS4002 (5,600-5,100 YBP) > I-CTS10228 (5,100-3,400 YBP) > I-Y3120 (3,400-2,100 YBP) > I-S17250 (2,100-1,850 YBP) > I-PH908 (1,850-1,700 YBP),[11] which is typical of the South Slavic populations of Southeastern Europe, being highest in Bosnia-Herzegovina (>50%).[5] In Croatia the highest frequency is observed in Dalmatia, peaking in cities of Dubrovnik (53%) and Zadar (60%),[8] as well southern islands of Vis (44.6%),[8] Brač and Korčula (~55%), and Hvar (65%).[6] The frequency is lower in the town of Osijek (27.6%) on the banks of the river Drava, in the western mountainous Žumberak region (18.2%),[8] and in the northern islands of Cres (3%) and Krk (27%).[6][3] The highest frequency of the haplogroup is found in Croats from Herzegovina (73%).[6] The subclade I1 was not found in Osijek and Bosnian Croats,[6] but peaked at 8.9% in Dubrovnik.[8] The subclade's I-P37.2 very high frequency in the Western Balkans diminishes in all directions.[12][8]
The population with haplogroup I migrated to Europe from the Middle East, approximately 25,000-13,000 years ago. It represents the Paleolithic and Mesolithic population of hunter gatherers in Europe. However, in comparison to older research which argued a prehistoric autochthonous origin of the haplogroup I2 in Croatia and the Balkans,[nb 1] as already Battaglia et al. (2009) observed highest variance of the haplogroup in Ukraine, Zupan et al. (2013) noted that it suggests it arrived with Slavic migration from the homeland which was in present-day Ukraine.[17] The most recent research by O.M. Utevska (2017), concluded that the haplogroup STR haplotypes have the highest diversity in Ukraine, with ancestral STR marker result "DYS448=20" comprising "Dnieper-Carpathian" cluster, while younger derived result "DYS448=19" comprising the "Balkan cluster" which is predominant among the South Slavs.[18] This "Balkan cluster" also has the highest variance in Ukraine, which indicates that the very high frequency in the Western Balkan is because of a founder effect.[18] Utevska calculated that the STR cluster divergence and its secondary expansion from the middle reaches of the Dnieper river or from Eastern Carpathians towards the Balkan peninsula happened approximately 2,860 ± 730 years ago, relating it to the times before Slavs, but much after the decline of the Tripolye culture.[18] More specifically, the cluster is represented by a single SNP, I-PH908, known as I2a1a2b1a1a1c in ISOGG phylogenetic tree (2019), and according to YFull YTree it formed and had TMRCA approximately 1,850-1,700 YBP.[11] Although it is considered that I-L621 might have been present in the Cucuteni–Trypillia culture,[19] until now was only found G2a,[20] and another subclade I2a1a1-CTS595 was present in the Baden culture of the chalcolithic Carpathian Basin.[19][21] Although it is dominant among the modern Slavic peoples on the territory of the former Balkan provinces of the Roman Empire, until now it was not found among the samples from the Roman period and is almost absent in contemporary population of Italy.[22] It was found in the skeletal remains with artifacts, indicating leaders, of Hungarian conquerors of the Carpathian Basin from the 9th century, part of Western Eurasian-Slavic component of the Hungarians.[22][19] According to Pamjav et. al. (2019) and Fóthi et al. (2020), the distribution of ancestral subclades like of I-CTS10228 among contemporary carriers indicates a rapid expansion from Southeastern Poland, is mainly related to the Slavs and their medieval migration, and the "largest demographic explosion occurred in the Balkans".[22][23] The earliest archeogenetic sample until now is Sungir 6 (~900 YBP) near Vladimir, Russia which belonged to the I-S17250 > I-Y5596 > I-Z16971 > I-Y5595 > I-A16681 subclade.[24][25]
R1a1a1-M17 (22.1%-25.6%) is the second most prevailing haplogroup.[7] The haplogroup R-M17 in Croatia is mostly divided into two subclades, R-M558 which is predominant (19.2%), and R-M458 (4.9%), while R-Z282 is rare (1.2%).[8] It has highest frequency in northern region of Croatia (29.1%), and almost the same lowest frequency in eastern (18.6%), southern (19.1%), and western (20%) region of Croatia.[7] The highest local frequency of R1a1a1-M17 was found in the Croats from Osijek (39%),[6] Žumberak (34.1),[8] and in the northern islands of Krk (37%) and Cres (56.5%),[3][8] being similar to the values of the other Slavs, like Slovenes, Czechs and Slovaks. The frequency is lower in Šokci from eastern Croatia (16%),[9][10] in the cities of Zadar (4%) and Dubrovnik (13.4%) in Dalmatia, as well on the southern islands of Hvar (8%), Vis (17%), and intermediate in Korčula (20%) and Brač (25%).[3][8] In Bosnian Croats, the frequency is similar to those of other South Slavs (12%).[6] The R-M558 subclade is more frequent among East Slavs in Eastern Europe and Volga-Ural region, while R-M458 among West Slavs in Central and Eastern Europe. Both are present in "informative frequencies in Balkan populations with known Slavonic heritage".[26] R-M558 subclade CTS1211 was also found among Hungarian conquerors which indicates mixing and assimilation of the Slavs among the Hungarians.[19]
The highest frequency of the haplogroup Haplogroup R1b (7.9%-9.1%), which in Croatia is divided into several subclades (mainly R-L23 and its subclade R-U152), has in northern (10.9%) and central (11.8%) region of Croatia,[7] while locally in the Croats from the island of Krk (16.2%) and Dugi Otok (25%),[3][8] and Žumberak (11.3%),[8] while in the southern islands, city of Dubrovnik (3.9%) and in Bosnian Croats it is almost absent (1-6%),[3][6][8] or like in Osijek it was not found.[6] These two haplogroups (R1a and R1b) are connected to Proto-Indo-Europeans migration from the Eurasian area some 5,000 years ago,[12] with R1a particularly to Slavic population's migration.[5][8] Their frequency show north-south gradiation and an opposite frequency distribution to the haplogroup I-P37.2,[12] and the highest frequency is observed in the northern, western and eastern Croatia.[3][6]
From the haplogroup E (9.8%-10.6%) among Croats the most frequent is subclade E1b1b1a1b-V13 (6.7%), while E1b1b1a3-M149 and E1b1b1c-M123 were also found in small numbers (1.1%).[6] E-V13 it's typical of the populations of south-eastern Europe, peaking among Kosovo Albanians (44%), and is also high among the Macedonians, Greeks, Romanians, Bulgarians and Serbs.[5] The highest frequency in Croatian mainland has been found in Žumberak (18.2%)[8] and Osijek (10.3%),[6] in central islands Dugi Otok (15.9%) and Ugljan (13.2%), as well southern islands Vis (23.4%) and Mljet (15.4%).[8] In the northern islands of Cres (3%)[8] and Krk (6.8%) was similar to other southern islands (3.7-4.3%).[3] In Bosnian Croats the frequency was the same as among the Croats from Croatia (8.9%).[6] Subclades of J1 are rare in Croatia, while J2 are higher in Croats from Croatia, peaking in Croats from Osijek (10.2%) and central islands Ugljan (10.2%) and Pašman (16.6%) as well the northern island of Krk (10.8%) and Cres (14.1%),[3][6][8] than in Bosnian Croats (both 1.1%).[6] Subclade G2a-P15 both in Croatian and Bosnian Croats is found in low numbers (1.1%),[6] but peaks locally in the north-eastern town of Osijek (13.8%),[6] and the southern islands of Mljet (15.4%), Korčula (10.4%), Brač (6%) as well northern island Cres (7%).[3][8] The haplogroup E and J are related to post-LGM, Neolithic migration of a population from Anatolia who brought with them domestication of wild animals and plants. Specifically, the haplogroup E's subclade probably arose locally in the Balkan not earlier than 8,000-10,000 years ago. These haplogroups show south-north gradiation.[12] The haplogroup G could have been present in Europe during the LGM or population with some of its subclades arrived with early farmers.[12]
Haplogroup's N subclades are rare in Croatia (0.6%-2.2%).[6][8] It is very frequent in the Far East, like Siberia and China, while in Europe in Finns (60%) and in the Baltic countries (45%). Unusually for European populations, another central Asian-Siberian haplogroup P (i.e. Q) was found in unusually high frequencies due to founder effect in the islands of Hvar (14%) and Korčula (6%).[3]
Abstract and data[]
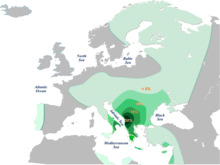
The region of modern-day Croatia was part of a wider Balkan region which may have served as one of several refugia during the LGM, a source region for the recolonization of Europe during the post-glacial period and Holocene (10,000 years ago).[6][12] The eastern Adriatic coast was much further south.[4] The northern and the western parts of that sea were steppes and plains, while the modern Croatian islands (rich in Paleolithic archeological sites) were hills and mountains.[4][6] The region had a specific role in the structuring of European, and particularly among Slavic, paternal genetic heritage, characterized by the predominance of R1a and I, and scarcity of E lineages.[5] The contemporary insular population's genetic diversity is characterized by strong isolation and endogamy.[27]
In the table below is cited the most extensive study (2012) until now on the population in Croatia. It is a national reference DNA database of 17 loci system which acquired Y-STR haplotypes were predicted in estimated (over 90% probability) Y-SNP haplogroups.[7] The sub-populations were divided in five regions which sub-populations showed strong similarity and homogeneity of paternal genetic contribution, with exception of sub-population from southern Croatia who showed a mild difference. In addition to high degree of overall homogeneity, there are gradient similarities to a central European cluster (Germanic, Slavic, Hungarian), and a southern European cluster (Bosnian, Serbian, Bulgarian, Macedonian, Romanian, Albanian, South Italian), going from north to south (and east to west).[7]
| Population | Samples | Source | I2a(xI2a1) | R1a | E1b1b1-M35 | R1b | I1 | J2b | G2a | H | J2a1h | J1 | J2a1b | E1b1a1-M2 | G2c | I2a1 | I2b1 | I2b(xI2b1) | J2a1-bh | L | N | Q | T |
|---|---|---|---|---|---|---|---|---|---|---|---|---|---|---|---|---|---|---|---|---|---|---|---|
| Overall Croatia | 1,100 | Mršić et al. (2012) | 37.7% (415/1100) |
22.1% (243/1100) |
10.6% (117/1100) |
7.9% (87/1100) |
5.8% (64/1100) |
3.7% (41/1100) |
2.7% (30/1100) |
1.8% (20/1100) |
1.2% (13/1100) |
1.1% (12/1100) |
1% (11/1100) |
<1 | <1 | <1 | <1 | <1 | <1 | <1 | <1 | <1 | <1 |
| Central Croatia | 220 | Mršić et al. (2012) | 31.8% (70/220) |
23.6% (52/220) |
11.8% (26/220) |
10.4% (23/220) |
5% (11/220) |
5% (11/220) |
3.6% (8/220) |
1.3% (3/220) |
0.4% (1/220) |
2.2% (5/220) |
0.9% | 0 | 0 | 0.4% | 0.9% | 0.9% | 0 | 0.4% | 0.9% | 0 | 0 |
| North Croatia | 220 | Mršić et al. (2012) | 25.4% (56/220) |
29.1% (64/220) |
10.9% (24/220) |
10.4% (23/220) |
4.1% (9/220) |
5% (11/220) |
3.1% (7/220) |
5% (11/220) |
0.4% (1/220) |
0 | 0.4% (1/220) |
0.4% | 0 | 0 | 2.2% | 0.9% | 0 | 0.4% | 0.4% | 0 | 1.3% |
| East Croatia | 220 | Mršić et al. (2012) | 40% (88/220) |
18.6% (41/220) |
11.3% (25/220) |
8.2% (18/220) |
5.9% (13/220) |
2.7% (6/220) |
1.8% (4/220) |
0.9% (2/220) |
2.2% (5/220) |
2.7% (6/220) |
1.3% | 0 | 0 | 0 | 0.4% | 0 | 0.4% | 0 | 0.9% | 1.8% | 0.4% |
| West Croatia | 220 | Mršić et al. (2012) | 36.8% (81/220) |
20% (44/220) |
12.7% (28/220) |
5.9% (13/220) |
8.6% (19/220) |
3.2% (7/220) |
3.2% (7/220) |
1.8% (4/220) |
1.8% (4/220) |
0.4% (1/220) |
1.8% | 0 | 0.4% | 0 | 0.4% | 0 | 0.4% | 0 | 0.9% | 0.4% | 0.9% |
| South Croatia | 220 | Mršić et al. (2012) | 54.5% (120/220) |
19.1% (42/220) |
6.3% (14/220) |
4.5% (10/220) |
5.4% (12/220) |
2.7% (6/220) |
1.8% (4/220) |
0.4% (1/220) |
0.9% (2/220) |
0 | 0.4% | 0 | 0 | 0 | 0.4% | 0 | 0.9% | 0.4% | 0 | 1.3% | 0.4% |
| Zagreb & Croatia | 239 | Purps et al. (2014)[28] | 36.1% | 23.8% | 6.4% | 13.9% | 3.9% | 2.1% | n/a | n/a | 1.9% | 0.9% | n/a | n/a | n/a | n/a | n/a | n/a | n/a | n/a | n/a | n/a | n/a |
| Croatia | 720 | Šarac et al. (2016) | 32.5% | 25.6% | 9.8% | 9.1% | 4.1% | 5.0% | 4.4% | 0.3% | 2.7% | 0.5% | 1.0% | 0.4% | 0 | 0.3% | 0.8% | 0.5% | 1.0% | 0 | 0.6% | 0.9% | 1.2% |
Mitochondrial DNA[]
Prehistoric mtDNA[]
In the 2014 Y-DNA and mtDNA study, one Mesolithic sample dated 6080-6020 BCE from Vela Spila near Vela Luka on island Korčula belonged to mtDNA haplogroup U5b2a5 common in hunter-gatherer communities, while other eleven Neolithic Starčevo culture samples dated circa 6000–5400 BCE from Vinkovci were assigned haplogroups J1c, K1a, T2b, HV0, K, V, V6, which reveal similar mtDNA diversity and shared ancestry in early farming populations from the Pannonian Basin and the populations of the Central European LBK, accompanied by a reduction of the Mesolithic mtDNA substratum.[1]
Preliminary results from 2016 mtDNA study, which will approximately include 30 samples from Neolithic and 5 samples from Early to Late Bronze Age, on 5 ancient Croatian petrous bones (3 Neolithic Cardial Impresso from Zemunica Cave near Bisko, 1 Middle Neolithic Danilo culture from Zidana Cave near Staničići Žumberački, 1 Mid/Late Bronze Age from Jazinka Cave near Nečven) indicated mtDNA haplogroups K2 and K1b1a, H1e/H41, H1b for Neolithic samples similar to Early European Farmers (EEFs) and modern Sardinians and Southern Europeans, while haplogroup HV or H4 for Bronze Age sample similar to modern day Croatian and Balkan population, but without clear evidence for connection with the Indo-European migration.[29]
The 2018 study which included 17 samples from Croatia; Mesolithic (7308-7027 BCE) from Vela Spila to U5b2b, three Croatia Cardial Neolithic (6005-5751 BCE) samples from Zemunica Cave to H1, K1b1a and N1a1, Early-Neolithic Starčevo (5837-5659 BCE) from Beli Manastir-Popova zemlja to U8b1b1, two Early-Neolithic Croatia Impressa (5670-5560 BCE) samples from Kargadur to H5a and H7c, two Middle-Neolithic Sopot (5207-4546 BCE) samples from Osijek to U5a1a2 and H10, two Late-Neolithic Sopot (4790-4536 BCE) samples from Beli Manastir-Popova zemlja to U5b2b and N1a1, Eneolithic (3710-3360 BCE) from Radovanci to J1c2, three Vučedol (3000-2582 BCE) samples from Beli Manastir-Popova zemlja and Vucedol Tell to T2e, T2c2 and U4a, Early-Middle Bronze Age (1631-1521 BCE) from Veliki Vanik to I1a1, and the Late Bronze Age (805-761 BCE) sample from Jazinka Cave belonged to HV0e.[2]
Medieval mtDNA[]
The 2011 mtDNA study on 27 early medieval skeletal remains in Naklice near Omiš in Southern Dalmatia showed that 67% belonged to haplogroup H, 18% to J, 11% to U5, and 4% to HV.[30] The 2015 mtDNA study on medieval skeletal remains in Šopot (14th-15th century) and Ostrovica (9th century) in Northern Dalmatia confirmed that profiles inherited by the maternal line differed neither between Ostrovica and Šopot site nor between medieval and modern populations, showing the same haplogroup prevalence (H, J, U) in both medieval and contemporary populations.[31] The 2014 study of a male skeleton found in Split from Late Roman Period (dated 1760±80 YBP) showed that it belonged to haplogroup H.[32]
Contemporary mtDNA[]

Genetically, on the maternal mitochondrial DNA line, a majority (>65%) of Croats from Croatia (mainland and coast) belong to three of the eleven major European mtDNA haplogroups - H (25.5-45%), U (18.85-22%), J (7.5-11%), while a large minority (>35%) belongs to many other smaller haplogroups.[33][34]
In all the studies, haplogroup H is the most frequent (45% in 2014) maternal haplogroup in Croatian mainland (continental) and coast respectively, but in most recent 2020 study is at lower frequencies of 25.5% due to nomenclature differences primarily of R/R0 (7.5%) lineages.[34] The highest frequency in Croatia observed in population of island Korčula (60.2%) and Mljet (73.5%),[33] while lowest frequency in islands Cres (27.7%),[35] and Hvar (27.8%).[36] It is the dominant European haplogroup.[33] The elevated frequency of subhaplogroup H1b in Mljet (30.9%), otherwise rare in other studies, is a typical example of a founder effect - migration from the nearest coastal region and micro-evolutionary expansion in the island.[33]
Haplogroup U (18.85% in 2014,[37] 22% in 2020[34]) is mostly represented by its subclade U5 which is the second most frequent haplogroup, with 11.6% in the mainland and 10.4% in the coast, with similar frequencies in the islands of Brač (8.6%), Krk (11.3%), and Hvar (14.8%), while lowest in Korčula (2%).[36] Overall the haplogroup U, including its subclades like U5, is the most frequent in the city of Dubrovnik (19.9%) and islands Lastovo (23.5%) and Cres (29.4%).[35][33] It is the oldest European haplogroup (coalescence age circa 50,000 YBP) and its subclade U5 makes the majority of the haplogroup diversity in Europe. The high frequency of U4 in Lastovo (11.8%) indicates founder effect.[33]
Haplogroup J is the third most frequent haplogroup (7.5% in 2020[34]), with 11.9% in the mainland but only 3.1% in the coast, however the islands had higher frequencies than the coastal population Korčula (6.1%), Brač (8.6%), Krk (9%), Hvar (9.3%),[36] peak in Žumberak (12.34%)[37] and Lastovo (19.6%),[33] while in Cres is almost totally absent.[35]
Haplogroup T is third or fourth most frequent haplogroup (10% in 2020[34]). Its subclade T2 has similar frequency of 3.1-5.8% in both the coastal and mainland as well insular population, with exceptional peak in island Hvar (12%),[36][35] however the overall haplogroup T has lower frequency in Mljet (1.5%), Lastovo (3.9%) and Dubrovnik (2.3).[33]
Haplogroup K (7.5% in 2020[34]) has average frequency of 3.6% in the mainland and 6.3% in the coast, it is absent in Lastovo[33] and it has lowest frequency in the islands Cres (3.36%)[35] and Hvar (3.7%), while highest in the island Brač (9.5%).[36]
Haplogroup V (under HV > HV0) is a younger sister clade of haplogroup H,[33] and has almost the same minimum and maximum frequency (4-5.7%) in both continental and insular populations, with exception in Korčula (8.2%),[36] as well lower frequency in Mljet (1.5%), Lastovo (2%) and Dubrovnik (3.3%).[33]
Haplogroup W frequency in the mainland and coastal population is between 2.2-4.2%, while between insular populations 1.9-3.1%, with exception in Krk (7.5%),[36] and Cres (12.6%).[35] In islands Mljet and Lastovo is between 4.4-5.9%, while in Dubrovnik is almost absent (0.6%).[33]
Other mtDNA haplogroup with notable local peaks are: HV subclades with low frequencies in the mainland and coast (0.4-2.1%) but average (4.1-4.6) in islands, and high in Dubrovnik (7.7%)[33] and Brač (10.5%).[36] Haplogroup N1a in Cres (9.24%) is the northernmost finding till now of this branch in Europe, and haplotypes indicate a relatively recent founder effect.[35] It is a characteristic haplogroup of the early farmers.[1] Haplogroup F which is almost absent (only 0.2-0.4% in the mainland), but peaks at 8.3% in Hvar.[36][37] Haplogroup I in Krk (11.3%), which subhaplogroups separated around the LGM.[38]
Abstract and data[]
For decades the Croatian insular populations have been studied because of their isolation which can trace micro-evolutionary processes and understand evolutionary forces, like genetic drift (specific genetic expression), founder effect and population bottlenecks (reduction of population size) which shaped the contemporary population. The results until now indicate that the genetic flow and influx of women to the islands was limited.[33] A moderate genetic isolate can also be considered for the continental population of mountainous region Žumberak because they had a loose affinity with Uskoks's proposed region of origin (Bosnians, Herzegovinians, southern Croatians) or to their current closest neighbors (northern Croatians and Slovenians).[37] On the example of population of the island of Krk, the high-resoluton mtDNA analysis showed evidence that settlements Omišalj, Vrbnik, and Dobrinj are related in a joint cluster of early Slavic settlements, while Poljica and Dubašnica regions a separate cluster founded by Slavic and Vlachs or Morlachs migrants from the Velebit hinterland who arrived in the 15th century.[38] On the example of population of the island of Mljet can be perceived demographic and historical events like the island's use for quarantine station, while along Vis and Lastovo consanguinity practice and inbreeding due to lack of genetic diversity, being suitable for genetic-epidemiological research.[33]
In the 2004 mtDNA analysis, one cluster was formed by populations from islands Hvar, Krk and Brač, and second cluster included Croatian mainland and Croatian coast, while the island of Korčula was distinguished due to exceptionally high frequency of haplogroup H.[36] In the 2009 mtDNA interpopulation PCA analysis of subhaplogroups, insular populations from Krk, Ugljan, Korčula, Brač, Hvar were clustered together implying to have close maternal lineages, with Vis close to them, but Cres (prevalence U2, W, N1a) and Rab (U4, H6, J1c) had separate outlying positions from both the cluster and each other.[35] In the 2014 mtDNA PCA analysis, the populations from eastern and southern Croatia clustered together with Bosnia and Herzegovina, while western and northern Croatia with Slovenia. As Slovenian population does not form Southeast Europe cluster it is considered a possible input from different migration waves of Slavs in the Middle Ages.[37]
| Population | Samples | Source | H | HV | J | T | K | U* | U1 | U2 | U3 | U4 | U5 | U6 | U7 | U8 | R | N | I | W | X | Other |
|---|---|---|---|---|---|---|---|---|---|---|---|---|---|---|---|---|---|---|---|---|---|---|
| Croatia | 488 | Šarac et al. (2014) | 45.29 | 4.07 | 9.83 | 5.98 | 4.30 | 0 | 1.23 | 2.66 | 1.43 | 2.66 | 10.06 | 0.20 | 0.41 | 0.20 | 0 | 0.82 | 2.61 | 1.84 | 1.84 | 4.29 |
| East Croatia | 61 | Šarac et al. (2014) | 49.18 | 11.48 | 9.84 | 3.28 | 4.92 | 0 | 0 | 0 | 1.64 | 1.64 | 9.84 | 0 | 0 | 0 | 0 | 1.64 | 0 | 4.92 | 1.64 | 0 |
| North Croatia | 155 | Šarac et al. (2014) | 41.77 | 5.06 | 14.56 | 10.76 | 3.16 | 0 | 0.63 | 1.90 | 0.63 | 3.16 | 11.39 | 0.63 | 0 | 0.63 | 0 | 0 | 1.27 | 2.53 | 0.63 | 0.63 |
| West Croatia | 209 | Šarac et al. (2014) | 46.41 | 11.48 | 6.70 | 2.39 | 5.74 | 0 | 2.39 | 4.31 | 1.91 | 2.39 | 6.22 | 0 | 0.96 | 0 | 0 | 0.96 | 4.78 | 0 | 2.39 | 0 |
| South Croatia | 63 | Šarac et al. (2014) | 49.21 | 3.17 | 7.94 | 9.52 | 3.17 | 0 | 0 | 1.59 | 1.59 | 3.17 | 12.70 | 0 | 0 | 0 | 0 | 1.59 | 1.59 | 1.59 | 3.17 | 0 |
| Croatia | 200 | Barbarić et al. (2020) | 25.5 | 11.5 | 7.5 | 10 | 7.5 | 0 | 2 | 4 | 2.5 | 2.5 | 10 | 0 | 1 | 0 | 7.5 | 2 | 3 | 1 | 2 | 0.5 |
Autosomal DNA[]
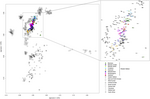
According to 2013 autosomal IBD survey "of recent genealogical ancestry over the past 3,000 years at a continental scale", the speakers of Serbo-Croatian language share a very high number of common ancestors dated to the migration period approximately 1,500 years ago with Poland and Romania-Bulgaria cluster among others in Eastern Europe. It is concluded to be caused by the Hunnic and Slavic expansion, which was a "relatively small population that expanded over a large geographic area", particularly "the expansion of the Slavic populations into regions of low population density beginning in the sixth century" and that it is "highly coincident with the modern distribution of Slavic languages".[39] According to Kushniarevich et al., the Hellenthal et al. 2014 IBD analysis also found "multi-directional admixture events among East Europeans (both Slavic and non-Slavic), dated to around 1,000–1,600 YBP" which coincides with "the proposed time-frame for the Slavic expansion".[40] The 2015 IBD analysis found that the South Slavs have lower proximity to Greeks than with East and West Slavs, and that there's an "even patterns of IBD sharing among East-West Slavs–'inter-Slavic' populations (Hungarians, Romanians and Gagauz)–and South Slavs, i.e. across an area of assumed historic movements of people including Slavs". The slight peak of shared IBD segments between South and East-West Slavs suggests a shared "Slavonic-time ancestry".[40] The 2014 IBD analysis comparison of Western Balkan and Middle Eastern populations also found negligible gene flow between 16th and 19th century during the Islamization of the Balkans.[41]
According to a 2014 autosomal analysis of Western Balkan, the Croatian population shows genetic uniformity with other South Slavic populations. The Croatians and Bosnians were more close to East European populations and largely overlapped with Hungarians from Central Europe.[41] In the 2015 analysis, they formed a western South Slavic cluster with the Bosnians and Slovenians in comparison to eastern cluster formed by Macedonians and Bulgarians with Serbians in the middle. The western cluster has an inclination toward Hungarians, Czechs, and Slovaks, while the eastern cluster toward Romanians and some extent Greeks.[40] In the 2018 analysis of Slovenian population, the Croatian population again clustered with Slovenians, Hungarians and was close to Czech. The population of Croatia mostly shares common ancestry with Eastern, Western, and Southern Europeans, and has almost no relation to isolated populations like the Sardinians and the Basques.[41][42]
According to 2016 whole exome sequencing of 176 individuals from the island of Vis it was confirmed isolate status of the island's population, and revealed the "pattern of loss-of-function mutations, which resembles the trails of adaptive evolution".[43]

Admixture analysis of autosomal SNPs in a global context on the resolution level of 7 assumed ancestral populations per Kovačević et al. (2014)
Principal component (PC) analysis of the variation of autosomal SNPs in Western Balkan populations in Eurasian context per Kovačević et al. (2014)

Admixture analysis on the resolution level of 6 assumed ancestral populations per Kushniarevich et al. (2015)
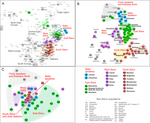
Genetic structure within European context according to three genetic systems atDNA (A), YDNA (B) and mtDNA (C) per Kushniarevich et al. (2015)

PC1vsPC2 plot based on whole genome SNP data per Kushniarevich et al. (2015)


See also[]
- White Croats
- Origin hypotheses of the Croats
- Genetic studies on Serbs
- Genetic studies on Bosniaks
- Genetic studies on Bulgarians
- Y-DNA haplogroups by ethnic group
- Y-DNA haplogroups in populations of Europe
Notes[]
- ^ a b c Szécsényi-Nagy et al. 2015.
- ^ a b Mathieson et al. 2018.
- ^ a b c d e f g h i j k l m Barać et al. 2003.
- ^ a b c d e Rootsi et al. 2004.
- ^ a b c d e f g Peričić et al. 2005.
- ^ a b c d e f g h i j k l m n o p q r s t u v w x y z aa Battaglia et al. 2008.
- ^ a b c d e f g Mršić et al. 2012.
- ^ a b c d e f g h i j k l m n o p q r s t Šarac et al. 2016.
- ^ a b Jurić, Ivan (2006). "Genetičko podrijetlo šokačkih rodova na području Vinkovaca" [Genetic Origin of Šokci Genera in the Area of Vinkovci]. Godišnjak Ogranka Matice Hrvatske Vinkovci (in Croatian). 24: 143–160. Retrieved 13 August 2020.
- ^ a b Jurić, Ivan (2008). "Genetičko podrijetlo šokačkih rodova" [Genetic Origin of Šokci Genera]. Godišnjak Za Kulturu, Umjetnost I Društvena Pitanja (in Croatian). 25: 193–208. Retrieved 13 August 2020.
- ^ a b c "I-PH908 YTree v8.06.01". YFull.com. 27 June 2020. Retrieved 17 July 2020.
- ^ a b c d e f Primorac et al. 2011.
- ^ "I-P37 YTree v6.07.08". YFull.com. 10 November 2018. Retrieved 11 November 2018.
- ^ "I2a Y-Haplogroup - Results: I2a2a-Dinaric". Family Tree DNA. Retrieved 11 November 2018.
Ken Nordtvedt has split I2a2-M423-Dinaric into Din-N and Din-S. Din-N is older than Din-S. N=north of the Danube and S=south of the Danube River ... May 8, 2007: Dinaric I1b1 and DYS 448. DYS448 19 for S and 20 for N.
- ^ Bernie Cullen (22 August 2016). "Link to I-L621 tree showing major STR clusters (Updated)". i2aproject.blogspot.com. Blogger. Retrieved 3 April 2019.
- ^ "Y-DNA Haplogroup I and its Subclades - 2018". ISOGG. 1 November 2018. Retrieved 11 November 2018.
- ^ Zupan et al. 2013.
- ^ a b c Utevska 2017, p. 219–226, 302.
- ^ a b c d Neparáczki, Endre; et al. (2019). "Y-chromosome haplogroups from Hun, Avar and conquering Hungarian period nomadic people of the Carpathian Basin". Scientific Reports. Nature Research. 9 (16569): 16569. Bibcode:2019NatSR...916569N. doi:10.1038/s41598-019-53105-5. PMC 6851379. PMID 31719606.
- ^ Mathieson, Iain (February 21, 2018). "The Genomic History of Southeastern Europe". Nature. 555 (7695): 197–203. Bibcode:2018Natur.555..197M. doi:10.1038/nature25778. PMC 6091220. PMID 29466330.
- ^ Lipson, Mark (2017). "Parallel ancient genomic transects reveal complex population history of early European farmers". Nature. 551 (7680): 368–372. doi:10.1038/nature24476. PMC 5973800. PMID 29144465.
- ^ a b c Fóthi, E.; Gonzalez, A.; Fehér, T.; et al. (2020), "Genetic analysis of male Hungarian Conquerors: European and Asian paternal lineages of the conquering Hungarian tribes", Archaeological and Anthropological Sciences, 12 (1), doi:10.1007/s12520-019-00996-0
- ^ Pamjav, Horolma; Fehér, Tibor; Németh, Endre; Koppány Csáji, László (2019). Genetika és őstörténet (in Hungarian). Napkút Kiadó. p. 58. ISBN 978-963-263-855-3.
Az I2-CTS10228 (köznevén „dinári-kárpáti") alcsoport legkorábbi közös őse 2200 évvel ezelőttre tehető, így esetében nem arról van szó, hogy a mezolit népesség Kelet-Európában ilyen mértékben fennmaradt volna, hanem arról, hogy egy, a mezolit csoportoktól származó szűk család az európai vaskorban sikeresen integrálódott egy olyan társadalomba, amely hamarosan erőteljes demográfiai expanzióba kezdett. Ez is mutatja, hogy nem feltétlenül népek, mintsem családok sikerével, nemzetségek elterjedésével is számolnunk kell, és ezt a jelenlegi etnikai identitással összefüggésbe hozni lehetetlen. A csoport elterjedése alapján valószínűsíthető, hogy a szláv népek migrációjában vett részt, így válva az R1a-t követően a második legdominánsabb csoporttá a mai Kelet-Európában. Nyugat-Európából viszont teljes mértékben hiányzik, kivéve a kora középkorban szláv nyelvet beszélő keletnémet területeket.
- ^ Sikora, Martin; Seguin-Orlando, Andaine; Sousa, Vitor C; Albrechtsen, Anders; Korneliussen, Thorfinn; Ko, Amy; Rasmussen, Simon; Dupanloup, Isabelle; Nigst, Philip R; Bosch, Marjolein D; Renaud, Gabriel; Allentoft, Morten E; Margaryan, Ashot; Vasilyev, Sergey V; Veselovskaya, Elizaveta V; Borutskaya, Svetlana B; Deviese, Thibaut; Comeskey, Dan; Higham, Tom; Manica, Andrea; Foley, Robert; Meltzer, David J; Nielsen, Rasmus; Excoffier, Laurent; Mirazon Lahr, Marta; Orlando, Ludovic; Willerslev, Eske (2017). "Ancient genomes show social and reproductive behavior of early Upper Paleolithic foragers". Science. 358 (6363): 659–662. Bibcode:2017Sci...358..659S. doi:10.1126/science.aao1807. PMID 28982795.
- ^ "I-A16681 YTree v8.06.01". YFull.com. 27 June 2020. Retrieved 17 July 2020.
- ^ Underhill, Peter A. (2015), "The phylogenetic and geographic structure of Y-chromosome haplogroup R1a", European Journal of Human Genetics, 23 (1): 124–131, doi:10.1038/ejhg.2014.50, PMC 4266736, PMID 24667786
- ^ Vitart et al. 2006.
- ^ Šehović et al. 2018.
- ^ Fernandes et al. 2016.
- ^ Ljubković et al. 2011.
- ^ Bašić et al. 2015.
- ^ Sutlović et al. 2014.
- ^ a b c d e f g h i j k l m n o Šarac et al. 2012.
- ^ a b c d e f Barbarić et al. 2020.
- ^ a b c d e f g h Jeran et al. 2009.
- ^ a b c d e f g h i j Cvjetan et al. 2004.
- ^ a b c d e Šarac et al. 2014.
- ^ a b Havaš Auguštin et al. 2012.
- ^ Ralph et al. 2013.
- ^ a b c Kushniarevich et al. 2015.
- ^ a b c Kovačević et al. 2014.
- ^ Delser et al. 2018.
- ^ Jeroncic et al. 2016.
- ^ The SNP I-P37 itself formed approximately 20 thousand YBP and had TMRCA 18 thousand YBP according to YFull,[13] being too old and widespread as an SNP for argumentation of autochthony as well the old research used outdated nomenclature. According to "I-P37 (I2a)" project at Family Tree DNA, the divergence at STR marker DYS448 20 > 19 is reported since 2007,[14] while the SNP which defines the STR Dinaric-South cluster, I-PH908, is reported since 2014.[15] The SNP I-PH908 at ISOGG phylogenetic tree is named as I2a1a2b1a1a1c,[16] while formed and had TMRCA approximately 1,800 YBP according to YFull.[11]
References[]
- Y-DNA
- L. Barać; et al. (2003). "Y chromosomal heritage of Croatian population and its island isolates" (PDF). European Journal of Human Genetics. 11 (7): 535–42. doi:10.1038/sj.ejhg.5200992. PMID 12825075. S2CID 15822710.
- S. Rootsi; et al. (2004). "Phylogeography of Y-Chromosome Haplogroup I Reveals Distinct Domains of Prehistoric Gene Flow in Europe" (PDF). American Journal of Human Genetics. 75 (1): 128–137. doi:10.1086/422196. PMC 1181996. PMID 15162323.
- M. Peričić; et al. (2005). "High-resolution phylogenetic analysis of southeastern Europe traces major episodes of paternal gene flow among Slavic populations". Molecular Biology and Evolution. 22 (10): 1964–75. doi:10.1093/molbev/msi185. PMID 15944443.
- V. Vitart; et al. (2006). "3000 years of solitude: extreme differentiation in the island isolates of Dalmatia, Croatia". European Journal of Human Genetics. 14 (4): 478–487. doi:10.1038/sj.ejhg.5201589. PMID 16493443.
- V. Battaglia; et al. (2008). "Y-chromosomal evidence of the cultural diffusion of agriculture in southeast Europe". European Journal of Human Genetics. 17 (6): 820–830. doi:10.1038/ejhg.2008.249. PMC 2947100. PMID 19107149.
- N. Haliti; et al. (2009). "Evaluation of population variation at 17 autosomal STR and 16 Y-STR haplotype loci in Croatians". Forensic Science International: Genetics. 3 (4): 137–138. doi:10.1016/j.fsigen.2008.11.004. PMID 19647700.
- D. Primorac; et al. (2011). "Croatian genetic heritage: Y-chromosome story". Croatian Medical Journal. 52 (3): 225–234. doi:10.3325/cmj.2011.52.225. PMC 3118711. PMID 21674820.
- G. Mršić; et al. (2012). "Croatian national reference Y-STR haplotype database". Molecular Biology Reports. 39 (7): 7727–41. doi:10.1007/s11033-012-1610-3. PMID 22391654. S2CID 18011987.
- A. Zupan; et al. (2013). "The paternal perspective of the Slovenian population and its relationship with other populations". Annals of Human Biology. 40 (6): 515–526. doi:10.3109/03014460.2013.813584. PMID 23879710. S2CID 34621779.
- A. Szécsényi-Nagy; et al. (2015). "Tracing the genetic origin of Europe's first farmers reveals insights into their social organization". Proceedings of the Royal Society B. 282 (1805): 20150339. doi:10.1098/rspb.2015.0339. PMC 4389623. PMID 25808890.
- J. Šarac; et al. (2016). "Genetic heritage of Croatians in the Southeastern European gene pool—Y chromosome analysis of the Croatian continental and Island population". American Journal of Human Biology. 28 (6): 837–845. doi:10.1002/ajhb.22876. PMID 27279290. S2CID 25873634.
- O.M. Utevska (2017). Генофонд українців за різними системами генетичних маркерів: походження і місце на європейському генетичному просторі [The gene pool of Ukrainians revealed by different systems of genetic markers: the origin and statement in Europe] (PhD) (in Ukrainian). National Research Center for Radiation Medicine of National Academy of Sciences of Ukraine.
- I. Mathieson; et al. (2018). "The genomic history of southeastern Europe". Nature. 555 (7695): 197–203. Bibcode:2018Natur.555..197M. doi:10.1038/nature25778. PMC 6091220. PMID 29466330.
- Šehović, Emir; et al. (2018). "A glance of genetic relations in the Balkan populations utilizing network analysis based on in silico assigned Y-DNA haplogroups". Anthropological Review. 81 (3): 252–268. doi:10.2478/anre-2018-0021.
- mtDNA
- S. Cvjetan; et al. (2004). "Frequencies of mtDNA Haplogroups in Southeastern Europe-Croatians, Bosnians and Herzegovinians, Serbians, Macedonians and Macedonian Romani". Collegium Antropologicum. 28 (1).
- M. Peričić; et al. (2005). "Review of Croatian Genetic Heritage as Revealed by Mitochondrial DNA and Y Chromosomal Lineages". Croatian Medical Journal. 46 (4): 502–513. PMID 16100752.
- N. Jeran; et al. (2011). "Mitochondrial DNA heritage of Cres Islanders - example of Croatian genetic outliers". Collegium Antropologicum. 33 (4): 1323–8. PMID 20102088.
- J. Ljubković; et al. (2011). "Characteristics of early medieval inhabitants of Naklice (Southern Croatia) revealed by mitochondrial DNA analysis" (PDF). Book of Proceedings of the 7th ISABS Conference in Forensic, Anthropologic and Medical Genetics and Mayo Clinic Lectures in Tranlational Medicine: 157.
- J. Šarac; et al. (2012). "Influence of evolutionary forces and demographic processes on the genetic structure of three Croatian populations: A maternal perspective". Annals of Human Biology. 39 (2): 143–155. doi:10.3109/03014460.2012.660194. PMID 22324841. S2CID 4833862.
- D. Havaš Auguštin; et al. (2012). "Maternal Genetic Legacy of the Eastern Adriatic Island of Krk - An Interplay of Evolutionary Forces and Island's Historical Events in Shaping the Genetic Structure of Contemporary Island Population". Collegium Antropologicum. 36 (2).
- J. Šarac; et al. (2014). "Maternal Genetic Heritage of Southeastern Europe Reveals a New Croatian Isolate and a Novel, Local Sub-Branching in the X2 Haplogroup". Annals of Human Genetics. 78 (3): 178–194. doi:10.1111/ahg.12056. PMID 24621318. S2CID 206980447.
- D. Sutlović; et al. (2014). "Skeletal Remains from Late Roman Period: As Old as Diocletian's Palace". Collegium Antropologicum. 38 (2): 749–754. PMID 25145017.
- Ž. Bašić; et al. (2015). "Cultural inter-population differences do not reflect biological distances: an example of interdisciplinary analysis of populations from Eastern Adriatic coast". Croatian Medical Journal. 56 (3): 230–238. doi:10.3325/cmj.2015.56.230. PMC 4500963. PMID 26088847.
- D. Fernandes; et al. (2016). "Preliminary results of a prehistoric human ancient DNA time series from coastal and hinterland Croatia". IUAES. doi:10.13140/RG.2.1.2555.9920. Cite journal requires
|journal=(help) - G. Mršić; et al. (2018). "Expanded Croatian 12 X-STR Loci Database With an Overview of Anomalous Profiles". Forensic Science International: Genetics. 34: 249–256. doi:10.1016/j.fsigen.2018.03.004. PMID 29573605.
- L. Barbarić; et al. (2020). "Maternal perspective of Croatian genetic diversity". Forensic Science International: Genetics. 44: 102190. doi:10.1016/j.fsigen.2019.102190. PMID 31756631.
- atDNA
- P. Ralph; et al. (2013). "The Geography of Recent Genetic Ancestry across Europe". PLOS Biology. 11 (5): e105090. doi:10.1371/journal.pbio.1001555. PMC 3646727. PMID 23667324.
- L. Kovačević; et al. (2014). "Standing at the Gateway to Europe - The Genetic Structure of Western Balkan Populations Based on Autosomal and Haploid Markers". PLOS One. 9 (8): e105090. Bibcode:2014PLoSO...9j5090K. doi:10.1371/journal.pone.0105090. PMC 4141785. PMID 25148043.
- A. Kushniarevich; et al. (2015). "Genetic Heritage of the Balto-Slavic Speaking Populations: A Synthesis of Autosomal, Mitochondrial and Y-Chromosomal Data". PLOS One. 10 (9): e0135820. Bibcode:2015PLoSO..1035820K. doi:10.1371/journal.pone.0135820. PMC 4558026. PMID 26332464.
- A. Jeroncic; et al. (2016). "Whole-exome sequencing in an isolated population from the Dalmatian island of Vis". European Journal of Human Genetics. 24 (10): 1479–1487. doi:10.1038/ejhg.2016.23. PMC 4950961. PMID 27049301.
- P. M. Delser; et al. (2018). "Genetic Landscape of Slovenians: Past Admixture and Natural Selection Pattern". Frontiers in Genetics. 9: 551. doi:10.3389/fgene.2018.00551. PMC 6252347. PMID 30510563.
External links[]
- The Croatian DNA Project at Family Tree DNA
- The 10.001 Dalmatians - Croatian biobank at University of Split School of Medicine
Human genetics | |
|---|---|
| Sub-topics |
|
| Genetic history by region |
|
| Population genetics by group |
|
| |
- Genetic genealogy
- Genetics by country
- Genetic history of Europe
- Genetics by ethnicity