Great Gatsby curve
The "Great Gatsby Curve" highlights differences in mobility across countries. The scatter plot shows the relationship between income inequality and intergenerational income mobility. This chart was introduced by late professor and Chairman of the Council Economic Advisers Alan Krueger during his speech at the Center for American Progress in 2012.[1][2][3] and the President's Economic Report to Congress,[4]
Explanation of the chart[]
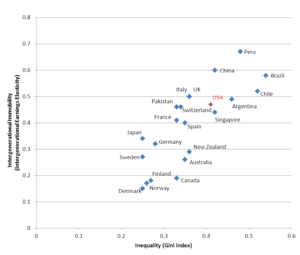
The vertical axis shows the intergenerational elasticities compiled by previous research papers[5] that focus on intergenerational mobility in different countries, the values of Corak's score are between 0 and 1. A lower intergenerational elasticity means that there is higher income mobility in that country. It means that in a country with higher income mobility, children have a better chance to earn more money than their parents. The horizontal axis shows the Gini coefficient using values from World Bank data. A higher value on the horizontal axis means a country has an unequal distribution of income.[6] The Great Gatsby Curve shows how hard it is for children to overcome their parents' income level. The easiest is for children in countries situated in the left-bottom part of the chart, so from countries with low Gini coefficient and low Corak's score. The line in this chart has a positive slope.
The Great Gatsby Curve introduction[]
The name of the curve refers to the novel The Great Gatsby by Francis Scott Fitzgerald. The main character of this story, Jay Gatsby, was born in an impoverished family, but he earned lots of money and dramatically improved their social level during the years. related the story of the birth of the Great Gatsby Curve to in responding to an email he sent him in September 2016:[7]
The short version of the story is: Reid Stevens and I were working with Alan for his speech at the Center for American Progress about the middle class. We got data from your paper and elsewhere and made the figure at Alan’s direction. Alan wanted a name for it; something that spoke about the rich staying rich, etc. We were in a meeting in the chairman’s conference room and he asked us to go brainstorm names. We went back to the room where many of the junior staffers sat together, we called it the bullpen, and after we explained the curve to all the staffers, we each put down one suggestion. Reid may remember the also-rans better than I do but I wrote down the Great Gatsby curve because of Gatsby’s trouble trying to jump social classes in spite of his money. A few of the other staffers teased me for my suggestion. None of the others were too great in my opinion; I remember a lot of the other names playing on white picket fences/silver spoons in their names.We then walked the list back over to Alan and his chief of staff, David Vandivier. Alan read all the names and chose the Great Gatsby curve. During that time in DC, Alan was in the business of promoting New Jersey wines and he gave Reid and me a bottle for our help with the speech that went well a few days later. I think that touches on the major points.
Krueger predicted that "the persistence in the advantages and disadvantages of income passed from parents to the children" will "rise by about a quarter for the next generation as a result of the rise in inequality that the U.S. has seen in the last 25 years."[8]
Journalist Timothy Noah argued the effect results from growing inequality:
you can't really experience ever-growing income inequality without experiencing a decline in Horatio Alger-style upward mobility because (to use a frequently-employed metaphor) it's harder to climb a ladder when the rungs are farther apart.[8]
Another journalist argued that a connection between income inequality and low mobility could be explained by the lack of access for un-affluent children to better (more expensive) schools and if this enabled access to high-paying jobs; or to differences in health care that may limit education and employment.[9]
However, some argue that the apparent connection may arise as an artifact of heterogeneous variance in ability across nations, questioning the need for intervention. It was shown that the manner in which the intergenerational income elasticity is defined, is by design associated with inequality.[10] Harvard economist Greg Mankiw noted that "this correlation is not particularly surprising", showing that comparisons of more diverse groups (like the US) with less diverse groups (like the population of Denmark) will automatically exhibit this phenomenon even when there are in fact no differences in the processes of mobility between these groups, i.e., the curve is an artifact of diversity.[11] His quote:[11]
Germans are richer on average than Greeks, and that difference in income tends to persist from generation to generation. When people look at the Great Gatsby curve, they omit this fact, because the nation is the unit of analysis. But it is not obvious that the political divisions that divide people are the right ones for economic analysis. We combine the persistently rich Connecticut with the persistently poor Mississippi, so why not combine Germany with Greece?
A blog[12] by M.S. at The Economist replied to Mankiw's counter-argument as follows:
The argument over the Great Gatsby curve is an argument about whether America's economy is fair. With his Germany/Greece and Mississippi/Connecticut analogy, Mr Mankiw has stumbled on a very convincing point: whether you are rich or poor in Europe or America depends to a great extent not on your own qualities or efforts, but on where you happen to be born. America is not a meritocracy, Mr Mankiw is saying; not only do those born rich tend to stay rich and vice versa, just being born in one state or another makes a huge difference to your lifelong earnings. Amazingly, he seems completely unaware that this is the case he's just made.
Economist Paul Krugman has also countered Mankiw's arguments in his column.[13]
Carter Price of the suggests "the line to serfdom" as an alternative name on the grounds that it may better convey the meaning of the correlation.[14]
The position of the countries[]
The best score according to the Great Gatsby Curve was achieved by the Nordic countries.[8] Denmark, Norway, and Finland all fell at the bottom-left part of the curve. As another Nordic country, Sweden is situated also near to the rest of the Nordic countries, despite a bit of a bit higher intergenerational income mobility.[15] This means that a child in a low-income family has a better opportunity to move up the economic ladder than a child in a similar situation in a country with higher inequality and higher elasticity. It can be caused by the fact that people in these countries have to pay higher taxes, and the education systems in this are countries are often free of charge. Other countries near the left-bottom corner are Japan and Germany. The majority of European countries have a Gini coefficient between 0.3 and 0.4. These countries, such as Switzerland, Italy, France, and United Kingdom, are situated in the middle of the Great Gatsby Curve.[16] Surprisingly, the United States of America, which is perceived as the country of equal opportunities, is located in the middle of the curve. But in the US, and unequal income distribution and a higher dependency on a parent's income means there is less opportunity for children in different economic classes to move upward than elsewhere.[17] The United States of America achieved an elasticity score of 0.47 from the research of .[18] This score means that slightly under half of what a child is expected to earn depends on their parent's income. In the US, nowadays, there is an increase in the chances of rich children growing up wealthy, and poor children remain poor in adulthood. Countries that are at the top-right of the curve include several developing countries. Countries in Latin America have a Gini coefficient above 0.5 and Corak's scores between 0.5 and 0.6.[19]
Another explanation of the Great Gatsby Curve[]
Income inequality and Income mobility[]

We can see the Great Gatsby curve from another perspective, such as how many generations it takes for a low-income family to reach the average income.[20] The relationship between inequality and mobility can also be seen using the number of generations, as the time, which is necessary to the improvement of low-income family to the social leader.[21] As we can expect in countries with better upward mobility, the process will last fewer generations for low-income families to reach the country's average income. The OECD created a bar chart that compares the number of generations necessary for low-income families to get the average income in countries part of the OECD.[22] As in the classical interpretation of the Great Gatsby Curve, the lowest inequality can be seen in Nordic countries, and it only takes about two to three generations. According to the OECD report, the People's Republic of China is situated on the other side of the curve. Due to the higher inequality and high elasticity, it takes seven generations for a low-income family to reach the average income.
Income inequality and Educational mobility[]

The Great Gatsby Curve can also be modified for educational mobility. Upward academic mobility is expected to be higher in countries with low-income inequality.[23] Suppose we measure the differences between the educational level of parents and the educational level of children. In that case, we find out that countries with less income inequality tend to have higher upward academic mobility, and children have better chances to gain a higher educational level than their parents.[24] Using OECD upward educational mobility data from its 2018 education report, we measured academic mobility upward, on the vertical axis, against income inequality, on the horizontal axis. Unlike the previous charts, higher values along the vertical axis mean more upward mobility. Thus, the line has a negative slope, in contrast to the standard Great Gatsby Curve or Great Gatsby Curve for income inequality and income mobility. As it is shown in the chart below, children from countries with low-income inequality have better chances to earn higher education than their parents. This type of Great Gatsby Curve is used by OECD when their design their educational policies.
References[]
- ^ Krueger, Alan (12 January 2012). "The Rise and Consequences of Inequality in the United States" (PDF).
- ^ Krugman, Paul (15 January 2012). "The Great Gatsby Curve". New York Times.
- ^ "The Great Gatsby Curve - Explained". Bloomberg Visual Data. 6 October 2013.
- ^ "Economic report of the President" (PDF). United States Government Printing Office. February 2012.
- ^ "Here is the source for the “Great Gatsby Curve” in the Alan Krueger speech at the Center for American Progress on January 12", Corak, Miles (12 January 2012)
- ^ "Here’s Where the US Falls on the ‘Great Gatsby Curve’", Hoff, Madison (23 February 2020)
- ^ Corak, Miles (2016-12-04). "How The Great Gatsby Curve got its name".
- ^ a b c Noah, Timothy (13 January 2012). "White House: Here's Why You Have To Care About Inequality".
- ^ DeParle, Jason (4 January 2012). "Harder for Americans to Rise From Lower Rungs".
- ^ Berman, Yonatan (7 Sep 2017). "Understanding the Mechanical Relationship between Inequality and Intergenerational Mobility". SSRN 2796563. Cite journal requires
|journal=(help) - ^ a b Mankiw, Greg (18 July 2013). "Observations on the Great Gatsby Curve".
- ^ S., M. (22 July 2013). "The Great Gatsby curve - Don't worry, old sport". The Economist.
- ^ Krugman, Paul (22 June 2013). "Greg Mankiw and the Gatsby Curve".
- ^ Price, Carter (11 March 2014). "A response to another attack on the Great Gatsby curve—and can we call it the "line to serfdom" instead?". Washington Center for Equitable Growth.
- ^ "Here is the source for the “Great Gatsby Curve” in the Alan Krueger speech at the Center for American Progress on January 12", Corak, Miles (12 January 2012)
- ^ "Here is the source for the “Great Gatsby Curve” in the Alan Krueger speech at the Center for American Progress on January 12", Corak, Miles (12 January 2012)
- ^ "Here’s Where the US Falls on the ‘Great Gatsby Curve’", Hoff, Madison (23 February 2020)
- ^ [1], Corak, Miles (12 January 2012) "Here is the source for the “Great Gatsby Curve” in the Alan Krueger speech at the Center for American Progress on January 12"
- ^ "Here is the source for the “Great Gatsby Curve” in the Alan Krueger speech at the Center for American Progress on January 12", Corak, Miles (12 January 2012)
- ^ "Here’s Where the US Falls on the ‘Great Gatsby Curve’", Hoff, Madison (23 February 2020)
- ^ "Here’s Where the US Falls on the ‘Great Gatsby Curve’", Hoff, Madison (23 February 2020)
- ^ "A Broken Social Elevator? How to Promote Social Mobility", OECD (15 June 2018)
- ^ "Trends in educational mobility: How does China compare to Europe and the United States?", Rob J, Gruijters; Tak Wing Chan; John, Ermisch (19 March 2019)
- ^ "Here’s Where the US Falls on the ‘Great Gatsby Curve’", Hoff, Madison (23 February 2020)
Further reading[]
- Stewart, Matthew (June 2018). "The 9.9 Percent Is the New American Aristocracy". The Atlantic.
- Economic inequality
- Economics curves
- Income in the United States
- Social inequality
- Socio-economic mobility