List of Belgian provinces by GDP
This article lists Belgian provinces and regions (NUTS 2) by gross domestic product (GDP).
By GDP[]
This table reports the gross domestic product (nominal GDP), expressed in billions of euro, of the ten provinces and the Brussels capital region in 2019.[1]
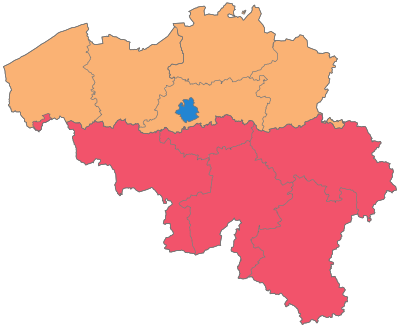
Flemish Region Walloon Region
| Rank | Province | GDP in bn. EUR |
|---|---|---|
| 1 | 92,088 | |
| - | 86,650 | |
| 2 | 57,559 | |
| 3 | 51,750 | |
| 4 | 48,326 | |
| 5 | 35,041 | |
| 6 | 32,720 | |
| 7 | 29,502 | |
| 8 | 21,024 | |
| 9 | 13,906 | |
| 10 | 7,351 | |
| 476,203 |
By GDP per capita[]
This table reports the gross domestic product (adjusted for purchasing power parity), expressed in euro, of the ten provinces and the Brussels capital region in 2018.[2]
Flemish Region Walloon Region
| Rank | Province | GDP per capita in EUR |
|---|---|---|
| - | 71,100 | |
| 1 | 51,800 | |
| 2 | 49,300 | |
| 3 | 44,900 | |
| 4 | 40,300 | |
| 5 | 37,800 | |
| 6 | 33,600 | |
| 7 | 29,400 | |
| 8 | 27,900 | |
| 9 | 26,000 | |
| 10 | 25,500 | |
| 41,400 |
See also[]
References[]
Categories:
- Gross state product
- Provinces of Belgium
- Economy of Belgium-related lists
- Lists of subdivisions of Belgium
- Ranked lists of country subdivisions
