Massachusetts House of Representatives' 1st Hampshire district

The Massachusetts House of Representatives 1st Hampshire District or "1st Hampshire" is an electoral district for the Massachusetts House of Representatives. It consists of the municipalities Northampton, Chesterfield, Cummington, Goshen, Hatfield, Plainfield, Westhampton, Williamsburg, and Worthington.[1] Democrat Lindsay Sabadosa of Northampton has represented the district since 2019.
The current district geographic boundary overlaps with those of the Massachusetts Senate's district and Hampshire, Franklin and Worcester district.[2]
District History[]
The district has existed in its current form since November 4, 2021,[3] but has existed in name since at least 1970.[4]
Former locales[]
The district previously covered:
Representatives[]
- William H. Dickinson, circa 1859 [6]
- William F. Arnold, circa 1859 [6]
- Calvin Coolidge, circa 1908
- Michael Fitzgerald, circa 1918
- William Grant, circa 1920 [7]
- James O'Dea, circa 1923
- Edwin Olander, circa 1935
- Jeremiah Lucey, circa 1945
- John O'Rourke, circa 1953
- Louis Morini, circa 1967
| Representative | Party | Years |
|---|---|---|
| Edward McColgan | Democratic | 1971 to 1975 |
| William Nagle | Democratic | 1975 to 2002 |
| Peter Kocot | Democratic | 2002 to 2018 |
| Lindsay N. Sabadosa | Democratic | 2018 to present |
Elections[]
Election data comes from Massachusetts Election Statistics.
2018[]
| Candidate | Party | Votes | % |
|---|---|---|---|
| Lindsay N. Sabadosa | Democratic | 18,001 | 99.1% |
| Others | 166 | 0.9% | |
| Blank | 3,628 | ||
| Total | 21,795 | 100% | |
2016[]
| Candidate | Party | Votes | % |
|---|---|---|---|
| Peter Kocot | Democratic | 20,145 | 99.6% |
| Others | 89 | 0.4% | |
| Blank | 4,420 | ||
| Total | 24,654 | 100% | |
2014[]
| Candidate | Party | Votes | % |
|---|---|---|---|
| Peter Kocot | Democratic | 13,937 | 99.5% |
| Others | 68 | 0.5% | |
| Blank | 3,155 | ||
| Total | 17,160 | 100% | |
2012[]
| Candidate | Party | Votes | % |
|---|---|---|---|
| Peter Kocot | Democratic | 19,090 | 99.6% |
| Others | 74 | 0.4% | |
| Blank | 4,442 | ||
| Total | 23,606 | 100% | |
2010[]
| Candidate | Party | Votes | % |
|---|---|---|---|
| Peter Kocot | Democratic | 14,284 | 99.4% |
| Others | 83 | 0.6% | |
| Blank | 3,107 | ||
| Total | 17,474 | 100% | |
2008[]
| Candidate | Party | Votes | % |
|---|---|---|---|
| Peter Kocot | Democratic | 19,124 | 99.5% |
| Others | 94 | 0.5% | |
| Blank | 4,302 | ||
| Total | 23,520 | 100% | |
See also[]
- Other Hampshire County districts of the Massachusetts House of Representatives: 2nd, 3rd
- Hampshire County districts of the Massachusett Senate: Berkshire, Hampshire, Franklin, and Hampden; 1st Hampden and Hampshire; 2nd Hampden and Hampshire; Hampshire, Franklin and Worcester
- List of former districts of the Massachusetts House of Representatives
Images[]

Calvin Coolidge

Michael Fitzgerald

James O'Dea

Edwin Olander

Jeremiah Lucey

John O'Rourke

Louis Morini

William Nagle

Peter Kocot


References[]
- ^ "Massachusetts Representative Districts". Retrieved 2018-08-14.
- ^ David Jarman (July 30, 2019), "Upper legislative district ↔ lower legislative district correspondences: MA", How do counties, House districts, and legislative districts all overlap?, Daily Kos,
State House Districts to State Senate Districts
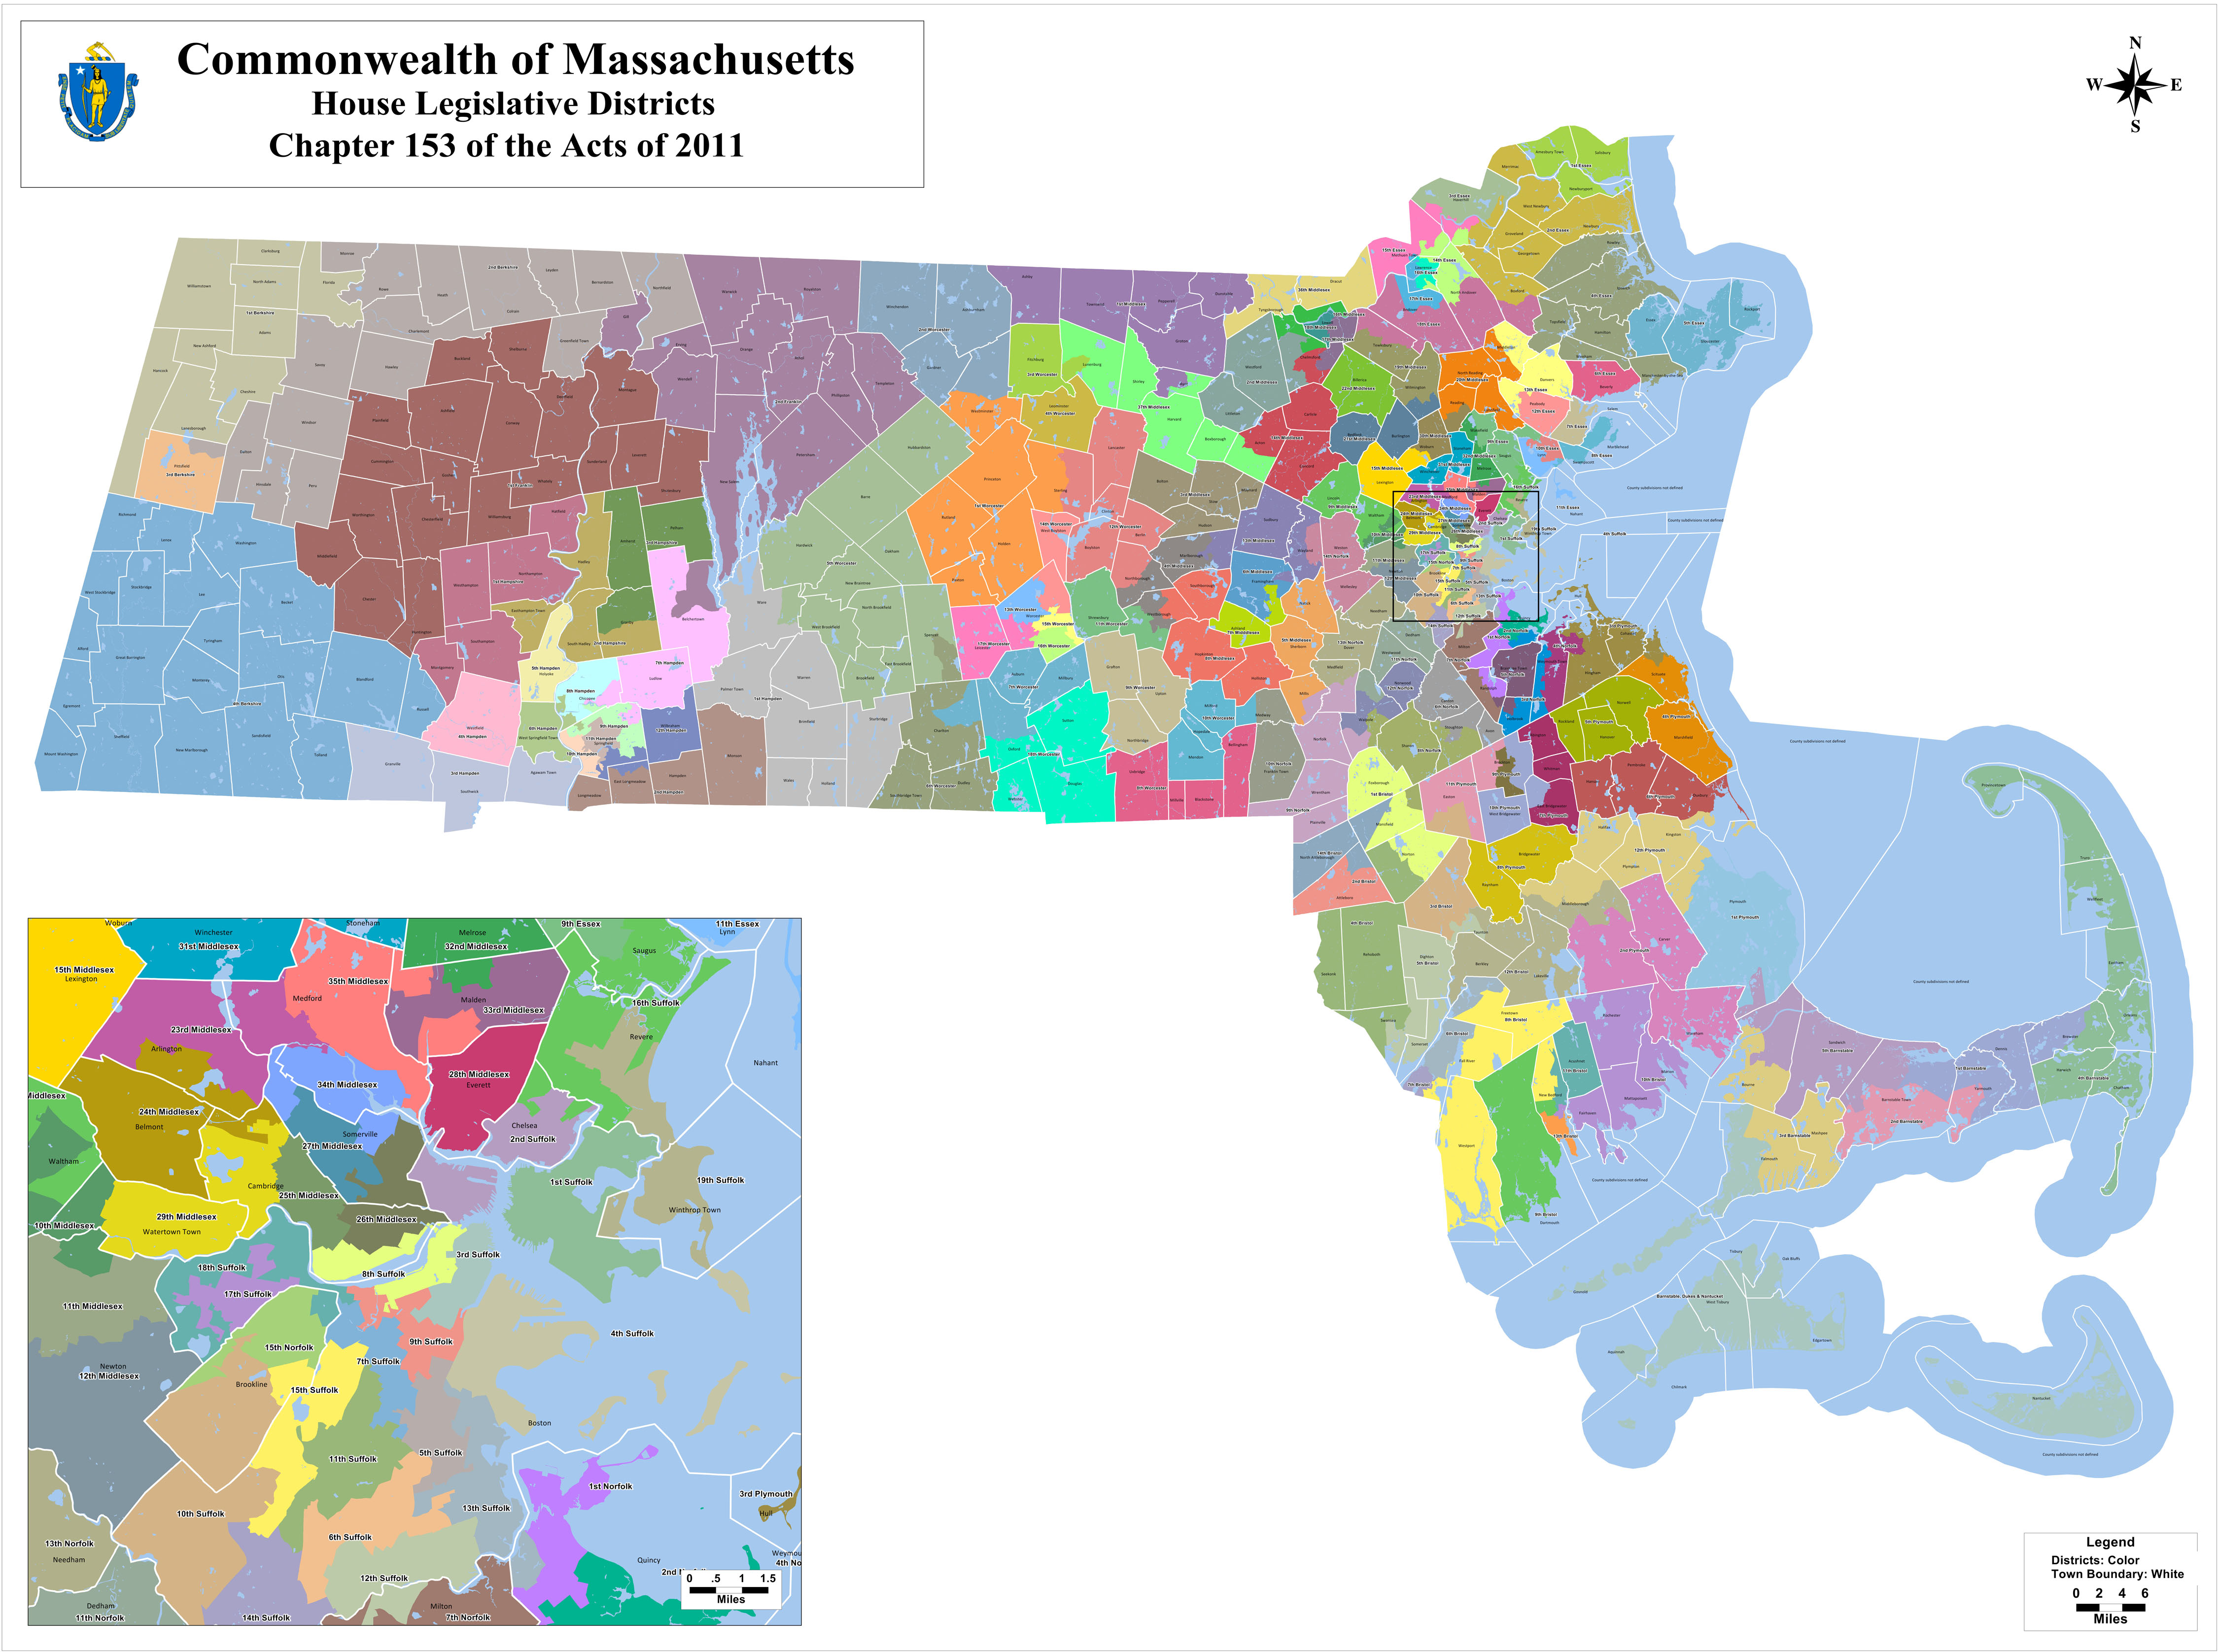
- ^ Commonwealth of Massachusetts House Legislative Districts (Map). 2011. Retrieved 2018-08-14.
- ^ "Massachusetts Election Statistics". Retrieved 2018-08-14.
- ^ a b "Representative Districts". Massachusetts Register. Boston: Sampson, Davenport, & Company. 1872.
- ^ a b Commonwealth of Massachusetts, Manual for the Use of the General Court. Boston. 1859 – via Internet Archive.
- ^ Public Officials of Massachusetts: 1920. Boston Review.
Further reading[]
- "Representative Districts: Hampshire County". Commonwealth of Massachusetts, Manual for the Use of the General Court for 1993-1994. Boston. 1993.
External links[]
| Wikimedia Commons has media related to Massachusetts House of Representatives' 1st Hampshire district. |
Districts of the Massachusetts General Court | |||||||||||||||||||||||||||||
|---|---|---|---|---|---|---|---|---|---|---|---|---|---|---|---|---|---|---|---|---|---|---|---|---|---|---|---|---|---|
| Senate |
| ||||||||||||||||||||||||||||
| House |
| ||||||||||||||||||||||||||||
- Massachusetts General Court districts
- Government of Hampshire County, Massachusetts
- Government of Hampden County, Massachusetts