National Grid (Great Britain)

In the electricity sector in the United Kingdom the National Grid is the high-voltage electric power transmission network serving Great Britain, connecting power stations and major substations and ensuring that electricity generated anywhere on it can be used to satisfy demand elsewhere. The network covers the great majority of Great Britain and several of the surrounding islands. It does not cover Northern Ireland, which is part of a single electricity market with the Republic of Ireland.
The GB grid is connected as a wide area synchronous grid nominally running at 50 hertz. There are also undersea interconnections to other grids in northern France (HVDC Cross-Channel and HVDC IFA-2), Northern Ireland (HVDC Moyle), the Isle of Man (AC Isle of Man to England Interconnector), the Netherlands (HVDC BritNed) and the Republic of Ireland (HVDC EirGrid).
On the breakup of the Central Electricity Generating Board in 1990, the ownership and operation of the National Grid in England and Wales passed to National Grid Company plc, later to become National Grid Transco, and now National Grid plc. In Scotland the grid was already split into two separate entities, one for southern and central Scotland and the other for northern Scotland, with interconnectors. The first is owned and maintained by SP Energy Networks, a subsidiary of Scottish Power, and the other by SSE. However, National Grid plc continues to be the transmission system operator for the whole GB grid.[1]
History[]
This section needs additional citations for verification. (February 2019) |

At the end of the 19th century, Nikola Tesla established the principles of three-phase high-voltage electric power distribution while he was working for Westinghouse in the United States. The first to use this system in the United Kingdom was Charles Merz, of the Merz & McLellan consulting partnership, at his Neptune Bank Power Station near Newcastle upon Tyne. This opened in 1901,[2] and by 1912 had developed into the largest integrated power system in Europe.[3] The rest of the country, however, continued to use a patchwork of small supply networks.
In 1925, the British government asked Lord Weir, a Glaswegian industrialist, to solve the problem of Britain's inefficient and fragmented electricity supply industry. Weir consulted Merz, and the result was the Electricity (Supply) Act 1926, which recommended that a "national gridiron" supply system be created.[4] The 1926 Act created the Central Electricity Board, which set up the UK's first synchronised, nationwide AC grid, running at 132 kV, 50 Hz.

The grid was created with 6,400 kilometres (4,000 mi) of cables – mostly overhead cables – linking the 122 most efficient power stations. The first "grid tower" was erected near Edinburgh on 14 July 1928,[5] and work was completed in September 1933, ahead of schedule and on budget.[6][7] It began operating in 1933 as a series of regional grids with auxiliary interconnections for emergency use. Following the unauthorised but successful short term parallelling of all regional grids by the night-time engineers on 29 October 1937,[8] by 1938 the grid was operating as a national system. The growth by then in the number of electricity users was the fastest in the world, rising from three quarters of a million in 1920 to nine million in 1938.[9] It proved its worth during the Blitz when South Wales provided power to replace lost output from Battersea and Fulham power stations.[9] The grid was nationalised by the Electricity Act 1947, which also created the British Electricity Authority. In 1949, the British Electricity Authority decided to upgrade the grid by adding 275 kV links.
At its inception in 1950, the 275 kV Transmission System was designed to form part of a national supply system with an anticipated total demand of 30,000 MW by 1970. The predicted demand was already exceeded by 1960. The rapid load growth led the Central Electricity Generating Board to carry out a study in 1960 of future transmission needs. The report was completed in September 1960, and its study is described in a paper presented to the Institution of Electrical Engineers by E.S. Booth, D. Clark, J.L. Egginton and J.S. Forrest in 1962.
Considered in the study, together with the increased demand, was the effect on the transmission system of the rapid advances in generator design resulting in projected power stations of 2,000–3,000 MW installed capacity. These new stations were mostly to be sited where advantage could be taken of a surplus of cheap low-grade fuel and adequate supplies of cooling water, but these situations did not coincide with the load centres. West Burton with 4 x 500 MW machines, sited at the Nottinghamshire coalfield near the River Trent, is a typical example. These developments shifted the emphasis on the transmission system, from interconnection to the primary function of bulk power transfers from the generation areas to the load centres, such as the anticipated transfer in 1970 of some 6,000 MW from The Midlands to the home counties.
Continued reinforcement and extension of the existing 275 kV systems was examined as a possible solution. However, in addition to the technical problem of very high fault levels, many more lines would have been required to obtain the estimated transfers at 275 kV. As this was not consistent with the Central Electricity Generating Board's policy of preservation of amenities a further solution was sought. Consideration was given to both a 400 kV and 500 kV scheme as the alternatives, either of which gave a sufficient margin for future expansion. The decision in favour of a 400 kV system was made for two main reasons. Firstly the majority of the 275 kV lines could be uprated to 400 kV, and secondly it was envisaged that the operation at 400 kV could commence in 1965 compared with 1968 for a 500 kV scheme. Design work was started and in order to meet the programme for 1965 it was necessary for the contract engineering for the first projects to run concurrently with the design. One of these projects was the West Burton 400 kV Indoor Substation, the first section of which was commissioned in June 1965. From 1965, the grid was partly upgraded to 400 kV, beginning with a 150-mile (241 km) line from Sundon to West Burton, to become the super grid.
In the 2010 issue of the code that governs the British Grid, the Grid Code,[10] the Supergrid is defined as referring to those parts of the British electricity transmission system that are connected at voltages in excess of 200 kV. British power system planners and operational staff therefore invariably speak of the Supergrid in this context.[citation needed]
In 2013 the construction of the 2.2 GW undersea Western HVDC Link from Scotland to North Wales started, which was completed in 2018.[11] This is the first major non-alternating current grid link within GB, though interconnectors to foreign grids already use HVDC.
Grid description[]

| External image | |
|---|---|
The contiguous synchronous grid covers England (including the Isle of Wight), Scotland (including some of the Scottish islands such as Orkney, Skye[17] and the Western Isles which have limited connectivity[18]), Wales, and the Isle of Man.
Network size[]
The following figures are taken from the 2005 Seven Year Statement (SYS)[19]
- Maximum demand (2005/6): 63 GW (approx.) (81.39% of capacity)
- Annual electrical energy used in the UK is around 360 TWh (1.3 EJ)
- Capacity (2005/6): 79.9 GW (or 80 GW per the 2008 Seven Year Statement)[20][dead link]
- Number of large power stations connected to it: 181
- Length of 400 kV grid: 11,500 km (circuit)
- Length of 275 kV grid: 9,800 km (circuit)
- Length of 132 kV (or lower) grid; 5,250 km (circuit)
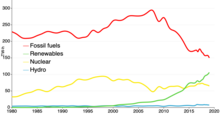
Total generating capacity is supplied roughly equally by renewable, nuclear, coal fired and gas fired power stations. Annual energy used in the UK is around 360 TWh (1.3 EJ), with an average load factor of 72% (i.e. 3.6×10¹¹/(8,760 × 57×106).[needs update]
Decarbonisation[]
The national grid has a stretch target to be carbon neutral or negative by 2033, well ahead of the UK's national target to achieve this by 2050. It also aims to have the capability to be zero carbon as early as 2025; 'zero carbon' meaning that if energy suppliers are able to produce sufficient green power, the grid could theoretically run without any greenhouse gas emissions at all (i.e. no carbon capture or offsetting would be needed as is the case with 'net zero'). In 2020 about 40% of the grid's energy came from burning natural gas, and it's not expected that anywhere close to sufficient green power will be available to run the grid on zero carbon in 2025, except perhaps on the very windiest days. Analysts such as Hartree Solutions consider even getting to 'net zero' by 2050 will be challenging, even more so to reach 'net zero' by 2033. There has however been sustained progress towards carbon neutrality, with carbon intensity falling by 53% in the five years to 2020. The phase out of coal is progressing rapidly with only 1.6% of the UK's electricity coming from coal in 2020, compared with about 25% in 2015. 2020 saw the UK go more than two months without needing to burn any coal for electricity at all, the longest period since the industrial revolution. [21] [22] [23] [24] [25][26][27]
Losses[]
Figures are again from the 2005 SYS.
- Joule heating in cables: 857.8 MW
- Fixed losses: 266 MW (consists of corona and iron loss; can be 100 MW higher in adverse weather)
- Substation transformer heating losses: 142.4 MW
- Generator transformer heating losses: 157.3 MW
- Total losses: 1,423.5 MW (2.29% of peak demand)
Although overall losses in the national grid are low, there are significant further losses in onward electricity distribution to the consumer, causing a total distribution loss of about 7.7%.[28] However losses differ significantly for customers connected at different voltages; connected at high voltage the total losses are about 2.6%, at medium voltage 6.4% and at low voltage 12.2%.[29]
Generated power entering the grid is metered at the high-voltage side of the generator transformer.[30][31] Any power losses in the generator transformer are therefore accounted to the generating company, not to the grid system. The power loss in the generator transformer does not contribute to the grid losses.
Power flow[]
In 2009–10 there was an average power flow of about 11 GW from the north of the UK, particularly from Scotland and northern England, to the south of the UK across the grid. This flow was anticipated to grow to about 12 GW by 2014.[32] Completion of the Western HVDC Link in 2018 added capacity for a flow of 2.2 GW between Western Scotland and North Wales.[33]
Because of the power loss associated with this north to south flow, the effectiveness and efficiency of new generation capacity is significantly affected by its location. For example, new generating capacity on the south coast has about 12% greater effectiveness due to reduced transmission system power losses compared to new generating capacity in north England, and about 20% greater effectiveness than northern Scotland.[34]
Interconnectors[]
The UK grid is connected to adjacent European electrical grids by submarine power cables at an electricity interconnection level (transmission capacity relative to production capacity) which was 6% as of 2014.[35] The connections include direct-current cables to northern France (2 GW HVDC Cross-Channel and 1 GW HVDC IFA-2), the Netherlands (1 GW HVDC BritNed), Northern Ireland (500 MW HVDC Moyle), Republic of Ireland (500 MW HVDC East–West Interconnector) and Belgium (1 GW HVDC Nemo link). There is also the 40 MW AC cable to the Isle of Man (Isle of Man to England Interconnector). There are plans to lay cables to link the UK with Norway (1.4 GW NSN Link), Denmark via the 1.4 GW Viking Link, a third link with France,[36] and Iceland in the future.[37]
Grid storage[]
The UK grid has access to some large pumped storage systems, notably Dinorwig Power Station which can provide 1.7 GW for many hours.
There are also now some grid batteries, and as of June 2019 the UK's grid has 700MW of battery power attached with 70% annual growth.[38]
Reserve services and frequency response[]
National Grid is responsible for contracting short term generating provision to cover demand prediction errors and sudden failures at power stations. This covers a few hours of operation giving time for market contracts to be established to cover longer term balancing.
Frequency-response reserves act to keep the system's AC frequency within ±1% of 50 Hz, except in exceptional circumstances. These are used on a second by second basis to either lower the demand or to provide extra generation.[39]
Reserve services are a group of services each acting within different response times:[39]
- Fast Reserve: rapid delivery (within two minutes) of increased generation or reduced demand, sustainable for a minimum of 15 minutes.
- Fast Start: generation units that start from a standstill and deliver power within five minutes automatically, or within seven minutes of a manual instruction, with generation maintained for a minimum of four hours.
- Demand Management: reduction in demand of at least 25 MW from large power users, for at least an hour.
- Short Term Operating Reserve (STOR): generation of at least 3 MW, from a single or aggregation of sites, within four hours of instruction and maintained for at least two hours.
- BM Start-Up: mainstream major generation units maintained in either an energy readiness or hot standby state.
These reserves are sized according to three factors:[40]
- The largest credible single generation failure event, which is currently either Sizewell B nuclear power station (1,260 MW) or one cable of the HVDC Cross-Channel interconnector (1,000 MW)
- The general anticipated availability of all generation plants
- Anticipated demand prediction errors
Control of the grid[]
The English and Welsh parts of the National Grid are controlled from the National Grid Control Centre which is located in St Catherine's Lodge, Sindlesham, Wokingham in Berkshire.[41][42][43][44] It is sometimes described as being a 'secret' location.[45] As of 2015 the system is under consistent cyber attack.[46]
Although the transmission network in Scotland is owned by separate companies – SP Transmission plc (part of Scottish Power) in the south, and Scottish Hydro Electric Transmission plc (part of Scottish and Southern Electricity Networks) in the north[47] – overall control rests with National Grid Electricity System Operator.[1]
Transmission costs[]
The costs of operating the National Grid System are recouped by National Grid Electricity System Operator (NGESO) through levying of Transmission Network Use of System (TNUoS) charges on the users of the system.[48] The costs are split between the generators and the users of electricity.[49]
Tariffs are set annually by NGET, and are zonal in nature—that is, the country is divided into zones, each with a different tariff for generation and consumption. In general, tariffs are higher for generators in the north and consumers in the south. This is representative of the fact that there is currently a north-south flow of electricity, and the additional stresses on the system increasing demand in areas of currently high demand causes.
Triad demand[]
'Triad demand' is a metric of demand, which reports retrospectively three numbers about peak demand between November and February (inclusive) each winter. In order to encourage usage of the National Grid to be less 'peaky', the triad is used as the basis for extra charges paid by the users (the licensed electricity suppliers) to the National Grid: the users pay less if they can manage their usage so as to be less peaky.
For each year's calculation, historic system demand metrics are analysed to determine three half-hour periods of high average demand; the three periods are known as triads. The periods are (a) the period of peak system demand, and (b) two other periods of highest demand which are separated from peak system demand and from each other by at least ten days.
For power stations, the chargeable demand is only the net site demand (per CUSC rule 14.17.10), so when the site is net exporting (i.e. total metered generation at that site exceeds total separately-metered station demand), that separately-metered station demand shall not be liable for demand TNUoS charges in relation to the station demand at triad.
Triad dates in recent years were:
| Year | Triad 1 | Triad 2 | Triad 3 |
|---|---|---|---|
| 2015/16 [50] | Wednesday 25 November 2015, 17:00 – 17:30 | Tuesday 19 January 2016, 17:00–17:30 | Monday 15 February 2016, 18:00–18:30 |
| 2016/17 [51] | Monday 5 December 2016, 17:00 – 17:30 | Thursday 5 January 2017, 17:00 – 17:30 | Monday 23 January 2017, 17:00 – 17:30 |
| 2017/18 [52] | Monday 11 December 2017, 17:30 – 18:00 | Monday 26 February 2018, 18:30–19:00 | Monday 5 February 2018, 18:00–18:30 |
| 2018/19 | |||
| 2019/20 | |||
| 2020/21 [53] | Monday 7 December 2020, 17:00 - 17:30 | Thursday 7 January 2021, 17:30 - 18:00 | Wednesday 10 February 2021, 18:00 - 18:30 |
In April of each year, each licensed electricity supplier (such as Centrica, BGB, etc.) is charged a yearly fee for the load it imposed on the grid during those three half-hours of the previous winter. Exact charges vary depending on the distance from the centre of the network, but in the South West it is £21,000/MW.[citation needed] The average for the whole country is about £15,000/MW. This is a means for National Grid to recover its charges, and to impose an incentive on users to minimise consumption at peak, thereby easing the need for investment in the system. It is estimated that these charges reduced peak load by about 1 GW out of say 57 GW.[citation needed]
This is the main source of income which National Grid uses to cover its costs for high-voltage long-distance transmission (lower voltage distribution is charged separately). The grid also charges an annual fee to cover the cost of generators, distribution networks and large industrial users connecting.
Triad charges encourage users to cut load at peak periods; this is often achieved by using diesel generators. Such generators are also routinely used by National Grid.[54]
Estimating costs per kW⋅h of transmission[]
If the total TNUoS or Triad receipts (say £15,000/MW·year × 50,000 MW = £750 million/year) is divided by the total number of units delivered by the UK generating system in a year (the total number of units sold – say 360 terawatt-hours (1.3 EJ).[49]), then a crude estimate can be made of transmission costs, and one gets the figure of around 0.2p/kW⋅h. Other estimates also give a figure of 0.2p/kW⋅h.[49]
However, Bernard Quigg notes: "According to the 06/07 annual accounts for NGC UK transmission, NGC carried 350TW⋅h for an income of £2012m in 2007, i. e. NGC receives 0.66p per kW hour. With two years inflation to 2008/9, say 0.71p per kW⋅h.",[55] but this also includes generators' connection fees.
Generation charges[]
This section does not cite any sources. (November 2014) |
In order to be allowed to supply electricity to the transmission system, generators must be licensed (by BEIS) and enter into a connection agreement with NGET which also grants Transmission Entry Capacity (TEC). Generators contribute to the costs of running the system by paying for TEC, at the generation TNUoS tariffs set by NGET. This is charged on a maximum-capacity basis. In other words, a generator with 100 MW of TEC who only generated at a maximum rate of 75 MW during the year would still be charged for the full 100 MW of TEC.
In some cases, there are negative TNUoS tariffs. These generators are paid a sum based on their peak net supply over three proving runs over the course of the year. This represents the reduction in costs caused by having a generator so close to the centre of demand of the country.
Demand charges[]
This section does not cite any sources. (November 2014) |
Consumers of electricity are split into two categories: half-hourly metered (HH) and non-half-hourly metered (NHH). Customers whose peak demand is sufficiently high are obliged to have a HH meter, which, in effect, takes a meter reading every 30 minutes. The rates at which charges are levied on these customers' electricity suppliers therefore varies 17,520 times a (non-leap) year.
The TNUoS charges for a HH metered customer are based on their demand during three half-hour periods of greatest demand between November and February, known as the Triad. Due to the nature of electricity demand in the UK, the three Triad periods always fall in the early evening, and must be separated by at least ten clear working days. The TNUoS charges for a HH customer are simply their average demand during the triad periods multiplied by the tariff for their zone. Therefore, (as of 2007) a customer in London with a 1 MW average demand during the three triad periods would pay £19,430 in TNUoS charges.
TNUoS charges levied on NHH metered customers are much simpler. A supplier is charged for the sum of their total consumption between 16:00 and 19:00 every day over a year, multiplied by the relevant tariff.
Constraint payments[]
Constraint payments are payments to generators above a certain size, where the National Grid gives them dispatch instructions that they are unable to take the electricity that the generators would normally provide. This can be due to a lack of transmission capacity, a shortfall in demand, or unexpected excess generation. A constraint payment is recompense for the reduction in generation.[56]
Major incidents[]
Power cuts due to either problems on the infrastructure of the supergrid (defined in the Grid Code as the transmission system operated by National Grid, which in England and Wales comprises lines energized at 275,000 volts and 400,000 volts), or due to lack of generation to supply it with sufficient energy at each point in time, are exceedingly rare. The nominal standard of security of supply is for power cuts due to lack of generation to occur in nine winters in a hundred.
The overall performance measure for electricity transmission is published on NGET's website[57] and includes a simple high-level figure on transmission availability and reliability of supply. For 2008–9 this was 99.99979%. Issues affecting the low voltage distribution systems – for which National Grid is not responsible – cause almost all the 60 minutes or so per year, on average, of domestic power cuts. Most of these low voltage distribution interruptions are in turn the fault of third parties such as workmen drilling through the street mains (or subterranean higher voltage) cables; this does not happen to major transmission lines, which are for the most part overhead on pylons. For comparison with supergrid availability, Ofgem, the electricity regulator, has published figures on the performance of 14 electricity distributors.[58][59]
Since 1990, there have been three power cuts of high national prominence that were linked to National Grid, two due to generation issues.
August 2003[]
This section does not cite any sources. (November 2014) |
The first case was in 2003, and related to the condition of National Grid's assets. National Grid was implicated in a power cut affecting 10 percent of London in August – see 2003 London blackout. Some news reports accused Grid of under-investment in new assets at the time; it transpired that a transformer oil leak had been left untreated, except for top-ups, for many months, pending a proper fix. It also transpired that there was a significant error in a protection relay setting which became evident, resulting in a power cut, only when the first fault, the oil leak, had a real effect. National Grid took some time to admit to these aspects of the incident.
May 2008[]
The second case was in May 2008, and related to generation issues for which National Grid was not responsible. A power cut took place in which a protective shutdown of parts of the network was undertaken by the distribution network operators, under pre-arranged rules, due to a sudden loss of generating capacity causing a severe drop in system frequency. First, two of Britain's largest power stations, Longannet in Fife and Sizewell B in Suffolk, shut down unexpectedly ('tripped') within five minutes of one another. There was no relationship between the two trips: the first did not cause the second. Such a loss is most unusual; at that time, Grid secured only against the loss of 1320 MW – the "infrequent infeed loss limit" (which rose to 1800 MW from 2014). The two shutdowns caused a sudden 1,510 MW adverse change in the balance of generation and demand on the supergrid, and the frequency dropped to 49.2 Hz. Whilst the frequency was dropping to 49.2 Hz, or just after it reached that point, 40 MW of wind farms and more than 92 MW of other embedded generation (meaning, connected to the distribution system, rather than directly connected to the supergrid), such as landfill plant, tripped on the basis of the rate of change of frequency ('ROCOF') being high, just as it is supposed to do under the G 59/2 connection rules.
The frequency stabilised at 49.2 Hz for a short while. This would have been an acceptable frequency excursion, even though it was below the usual lower limit of 49.5 Hz, and recovery would not have been problematic. The fact that frequency stabilised at this level in spite of a beyond-design-basis event, could be viewed as reassuring. Ireland, which being a smaller system has a more temperamental (and therefore less stable) grid, sees about 10 frequency excursions below 49.5 Hz per year – Its target frequency being 50 Hz, just as in Britain. Consumers would not have noticed the small drop in system frequency; other aspects of their supply, such as voltage, remained perfect. There would, therefore, have been no consumer detriment; all would have been well at this point, had nothing further untoward occurred.
However, further issues affecting smaller generators arose because the frequency remained below 49.5 Hz for more than a few seconds, and because some generators' control settings were wrong. The connection standard G 59/2 for embedded generation states that they must not trip (cease generating) as a result of sustained low frequency, until frequency has fallen below 47 Hz. However, a number of embedded generators used out-of-date control software that is not compliant with G59/2, as it erroneously trips them (as per the previous standard, G/59, in force when they were designed and specified) if frequency falls below 49.5 Hz for a few seconds. For this reason, another 279 MW of embedded generation tripped as a result of the low frequency whilst it was at 49.2 Hz. This was a problem as the Grid had no remaining available fast-acting generation, or demand-response, reserve margins. The frequency fell as a result to 48.792 Hz.
Grid rules state that as frequency falls below 48.8 Hz, distribution network operators must apply compulsory demand control. This should start, if time permits, with voltage reduction, rapidly followed by the compulsory disconnection of, in stages, up to a final total of 60 percent of all distribution-connected customers (a very small number of very large customers are connected directly to the supergrid; for them, other measures apply). There was no time to use voltage reduction (which keeps customers on supply, but subtly reduces their demand through reducing the voltage slightly); as a result, 546 MW of demand was automatically disconnected by distribution network operators. None of the directly supergrid-connected customers were cut off. National Grid had by now taken other measures to increase output at other generation sites (and demand had been reduced at those customer sites where the customer has volunteered for this to happen, in return for reimbursement, under demand-side response contracts with National Grid, or with their supplier). National Grid was then able to restore system frequency. The average duration of loss of supply to the 546 MW of mostly low-voltage-connected (e.g. domestic) demand affected was 20 minutes.
National Grid had time to issue a warning to all users of the supergrid – "demand control imminent" – which is one step away from its most serious warning "demand disconnection warning". During these incidents, the system was at risk to further generation loss which could have resulted in parts of the network being automatically disconnected by the operation of low frequency protection to ensure frequency is maintained within mandatory limits.[60][61][62]
August 2019[]
The third event occurred on 9 August 2019, when around a million customers across Great Britain found themselves without power.[63] Lightning struck a transmission line at 4:52 pm, causing the loss of 500 MW embedded (mostly solar) generation. Almost immediately, Little Barford Power Station and Hornsea Wind Farm tripped within seconds of each other, removing 1.378 GW of generation which was in excess of the 1 GW of backup power the operator maintains.[64] The grid frequency fell to 48.8 Hz before automatic load-shedding disconnected 5% of the local distribution networks (1.1 million customers for 15 to 20 minutes); this action stabilised the remaining 95% of the system and prevented a larger blackout.[65][better source needed] Although power was maintained at all times to the railway network (but not to the signalling system), the reduction in frequency caused 60 Thameslink Class 700 and 717 trains to fail. Half were restarted by the drivers but the others required a technician to come out to the train to restart it.[64] This led to substantial travel disruption for several hours on the East Coast Main Line and Thameslink services. The supply to Newcastle Airport was also disrupted and a weakness was exposed in backup power arrangements at Ipswich Hospital.[64]
An investigation by Ofgem concluded in January 2020. It found that Little Barford and Hornsea One had failed to remain connected to the grid following the lightning strike, and their operators – RWE and Ørsted respectively – agreed to each pay £4.5 million to Ofgem's redress fund. Additionally, Ofgem fined distribution network operator UK Power Networks £1.5M for beginning to reconnect customers before being cleared to do so, although this breach of procedure did not affect the recovery of the system.[66][67]
Minor incidents[]
November 2015[]
On 4 November 2015 National Grid issued an emergency notice asking for voluntary power cuts because of "multiple plant breakdowns". No power cuts occurred but wholesale electricity prices rose dramatically, with the grid paying up to £2,500 per megawatt-hour.[68]
See also[]
- Demand response
- Cost of electricity by source
- Economics of nuclear power plants – for cost comparisons
- Energy security and renewable technology
- Intermittent energy source
- TV pickup
- 2007 switching station flood at Walham, Gloucestershire
- List of energy storage projects
- List of major power outages
- Spark spread – calculating the cost of back-up
- Load management
- Three-phase electric power
- List of HVDC projects
- List of high voltage underground and submarine cables
- National Grid Reserve Service
- Energy in the United Kingdom
- High-voltage substations in the United Kingdom
References[]
- ^ Jump up to: a b "The GB electricity transmission network". Ofgem. Retrieved 25 June 2018.
- ^ Alan Shaw (29 September 2005). "Kelvin to Weir, and on to GB SYS 2005" (PDF). Royal Society of Edinburgh. Archived from the original (PDF) on 4 March 2009. Retrieved 12 November 2006.
- ^ "Survey of Belford 1995". North Northumberland Online.
- ^ "Lighting by electricity". The National Trust. Archived from the original on 29 June 2011.
- ^ Electricity supply in the United Kingdom : a chronology – from the beginnings of the industry to 31 December 1985. Electricity Council. The Council. 1987. ISBN 085188105X. OCLC 17343802.CS1 maint: others (link)
- ^ The Secret Life of the National Grid: Wiring the Nation
- ^ "Power struggle: The National Grid was created to provide energy for all – but that's when the problems really began". The Independent. Retrieved 21 August 2016.
- ^ Cochrane, Rob (1985). Power to the People. ISBN 0600358755.
- ^ Jump up to: a b Gerard Gilbert (22 October 2010). "Power struggle: The National Grid was created to provide energy for all – but that's when the problems really began". The Independent. Retrieved 17 October 2012.
- ^ "the British Grid Code" (PDF). Archived from the original (PDF) on 22 March 2011. Retrieved 3 February 2011.
- ^ "News | Western Link | National Grid & Scottish Power". Westernhvdclink.co.uk. Retrieved 18 June 2019.
- ^ "International Energy Statistics – EIA". Eia.gov. Retrieved 21 August 2016.
- ^ "Archived copy" (PDF). Archived from the original (PDF) on 3 July 2016. Retrieved 2016-08-14.CS1 maint: archived copy as title (link)
- ^ "Archived copy" (PDF). Archived from the original (PDF) on 8 October 2016. Retrieved 2016-08-14.CS1 maint: archived copy as title (link)
- ^ "Energy Trends: UK electricity". GOV.UK.
- ^ "Digest of UK energy statistics: 60th Anniversary Report". Retrieved 16 December 2013.
- ^ "Over the hills to Skye". Over the hills to Skye.
- ^ McCulloch, Scott (8 March 2016). "National Grid connection 'vital' for Scottish islands' renewables development". businessInsider.
- ^ "National Grid - SYS 2005 -". Archived from the original on 8 September 2012. Retrieved 9 January 2006.
- ^ [1][dead link]
- ^ Sarah Green (27 July 2020). "National Grid: UK's electricity system could go carbon-negative from 2033". edie.net. Retrieved 11 February 2021.
- ^ "Zero-carbon explained". April 2020. Retrieved 11 February 2021.
- ^ Rachel Morison (29 December 2020). "U.K. Power Grid Heads for Greenest Year as Renewables Grow". bloomberg. Retrieved 11 February 2021.
- ^ Reuters Staff (11 January 2021). "Britain sees greenest year for electricity in 2020 – National Grid". reuters. Retrieved 11 February 2021.
- ^ Katie Pavid (15 June 2020). "Britain goes two months without burning coal amid lockdown". Natural History Museum, London. Retrieved 11 February 2021.
- ^ Adam Lewis (8 December 2020). "Carbon in UK Power – Part 1: Lower Costs or Least Carbon?". Hartree Solutions. Retrieved 17 February 2021.
- ^ Adam Lewis (22 December 2020). "Carbon in UK Power – Part 2: Is It Time to Prioritise Carbon Over Price?". Hartree Solutions. Retrieved 17 February 2021.
- ^ "Archived copy". Archived from the original on 5 August 2016. Retrieved 2006-09-19.CS1 maint: archived copy as title (link)
- ^ Time to Take a Fresh Look at CHP... Archived 27 February 2008 at the Wayback Machine, Simon Minett, director, DELTA Energy and Environment, October 2005
- ^ Metering Code of Practice 1 (Elexon Ltd)
- ^ Metering Code of Practice 2
- ^ Effect on Power Transfers Archived 28 July 2012 at the Wayback Machine, 2009 Seven Year Statement, National Grid
- ^ "Western Link project". www.westernhvdclink.co.uk. Retrieved 10 February 2019.
- ^ PLC, National Grid Company. "2002 Seven Year Statement". National Grid – UK – Library. National Grid. Archived from the original on 19 December 2005. Retrieved 8 November 2013.
- ^ COM/2015/082 final: "Achieving the 10% electricity interconnection target" Text PDF page 2-5. European Commission, 25 February 2015. Archive Mirror
- ^ "ElecLink: IGC approves start of tests at the converter stations".
- ^ "Interconnectors: Iceland". National Grid. 12 July 2016. Archived from the original on 21 July 2016. Retrieved 21 August 2016.
- ^ "UK battery storage capacity could reach 70% growth in 2019 as business models evolve". Solar Power Portal.
- ^ Jump up to: a b "Appendix D Description of Balancing Services" (PDF), Operating the Electricity Transmission Networks in 2020 – Initial Consultation, National Grid, June 2009, archived from the original (PDF) on 23 December 2011, retrieved 8 January 2011
- ^ Gross, R; Heptonstall, P; Anderson, D; Green, T; Leach, M & Skea, J (March 2006). The Costs and Impacts of Intermittency. UK Energy Research Centre. ISBN 1-903144-04-3. Archived from the original on 21 June 2008. Retrieved 15 July 2008.
- ^ "Agenda 22 May 2007". Archived from the original (PDF) on 14 July 2011. Retrieved 3 November 2010.
- ^ "NETA Despatch Instruction Guide". Archived from the original (PDF) on 14 July 2011. Retrieved 3 November 2010.
- ^ "Wind Turbine Price List Uk". Archived from the original on 3 November 2010. Retrieved 3 November 2010.
- ^ "National Grid Control Centre Visit | Royal Meteorological Society". Rmets.org. 24 September 2012. Retrieved 21 August 2016.
- ^ "Power struggle: The National Grid was created to provide energy for all – but that's when the problems really began". The Independent. Retrieved 21 August 2016.
- ^ Ward, Jillian. "U.K. Power Grid is Under Attack From Hackers Every Minute, Says Parliament" Bloomberg, 9 January 2015. Retrieved: 20 January 2015.
- ^ "Our Transmission Network". SPEnergyNetworks. Retrieved 24 January 2020.
- ^ "Transmission Network Use of System (TNUoS) charges". National Grid ESO. Retrieved 20 September 2018.
- ^ Jump up to: a b c Andrews, Dave. "What is the cost per kWh of bulk transmission / National Grid in the UK (note this excludes distribution costs) | Claverton Group". Claverton-energy.com. Retrieved 21 August 2016.
- ^ Inenco, 2015/16 Triads, published 31 March 2016
- ^ Trident Utilities, 2016/17 Triad Periods Confirmed, published 29 March 2017, accessed 3 April 2018
- ^ Stark, History repeats itself: trends are hard to change, published 26 March 2018, accessed 3 April 2018
- ^ Now Then Energy, Winter 20-21 TRIAD dates announced, published 29 March 2021, accessed 30 April 2021
- ^ Andrews, Dave. "Commercial Opportunities for Back-Up Generation and Load Reduction via National Grid, the National Electricity Transmission System Operator (NETSO) for England, Scotland, Wales and Offshore". Claverton-energy.com. Retrieved 21 August 2016.
- ^ "Grid Operations | Claverton Group". Claverton-energy.com. Retrieved 21 August 2016.
- ^ http://ireland2050.ie/questions/what-are-constraint-payments/ What are constraint payments? Energy Institute
- ^ "Transmission Performance Report". National Grid. Archived from the original on 11 January 2011. Retrieved 21 August 2016.
- ^ http://www.ofgem.gov.uk/NETWORKS/ELECDIST/QUALOFSERV/QOSINCENT/Documents1/200809%20Electricity%20Distribution%20Quality%20of%20Service%20report.doc.pdf
- ^ "Information for Consumers". Ofgem.gov.uk. Archived from the original on 19 July 2012. Retrieved 21 August 2016.
- ^ Murad Ahmed, Steve Hawkes (28 May 2008). "Blackouts hit thousands as generators fail". The Times.CS1 maint: uses authors parameter (link)
- ^ Mark Milner, Graeme Wearden (28 May 2008). "Q&A: Blackout Britain". The Guardian.CS1 maint: uses authors parameter (link)
- ^ George South (28 May 2008). "iPM: Blackout Britain?". BBC. Retrieved 21 August 2016.
- ^ "Major power failure affects homes and transport". BBC. 9 August 2019. Retrieved 9 August 2019.
- ^ Jump up to: a b c https://www.nationalgrideso.com/document/151081/download Interim Report into the Low Frequency Demand Disconnection (LFDD) following Generator Trips and Frequency Excursion on 9 Aug 2019 - 16 August 2019
- ^ @enappsys (9 August 2019). "GB : Frequency drops off the chart to..." (Tweet) – via Twitter.
- ^ Stoker, Liam (3 January 2020). "Blackout investigation: Power firms fined as Ofgem 'accelerates' ESO review". Current News. Retrieved 8 January 2020.
- ^ "Companies pay £10.5 million over 9 August power cut". Ofgem. 3 January 2020.
- ^ Stacey, Kiran; Adams, Christopher (5 November 2015). "National Grid in emergency plea for heavy users to power down". Financial Times. pp. front page.
Further reading[]
- Hannah, Leslie (1979). Electricity Before Nationalisation, A Study in the Development of the Electricity Supply Industry in Britain to 1948. London & Basingstoke: Macmillan Publishers for the Electricity Council. ISBN 0-8018-2145-2.
External links[]
| Wikimedia Commons has media related to National Grid (Great Britain). |
- The Transmission System, National Grid's Seven Year Statement (2008)
- The Statement of the Use of System Charging Methodology[permanent dead link], National Grid
- Useful Information, National Grid
- National Grid live data, ELEXON
- UK National Grid Status
- UK Electricity Networks: The nature of UK electricity transmission and distribution networks in an intermittent renewable and embedded electricity generation future, Scott Butler
- The electricity supply industry and the Central Electricity Generating Board, UK Competition Commission Report 1987
- Map of GB power stations and national grid, BBC website, but map revised by Deloitte & Touche, 2003. Archive
- Carbon-intensity variations in the GB grid
- National Grid (Great Britain)
- 1933 establishments in the United Kingdom
- Wide area synchronous grids