New Jersey's 2nd congressional district
| New Jersey's 2nd congressional district | |||
|---|---|---|---|
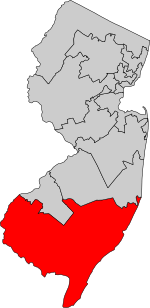 District map as of 2013 | |||
| Representative |
| ||
| Distribution |
| ||
| Population (2019) | 707,255 | ||
| Median household income | $68,127[1] | ||
| Ethnicity |
| ||
| Cook PVI | R+4[2] | ||
New Jersey's 2nd congressional district, based in Southern New Jersey, is represented by Republican Jeff Van Drew. He was first elected as a Democrat in 2018, but announced on December 19, 2019 that he would be switching parties. The district, which is New Jersey's largest geographically, is a swing seat with a history of supporting different parties at the presidential and congressional level.
Demographics[]
According to the APM Research Lab's Voter Profile Tools[3] (featuring the U.S. Census Bureau's 2019 American Community Survey), the district contained about 528,000 potential voters (citizens, age 18+). Of these, 72% are White, 13% Black, and 11% Latino. Immigrants make up 7% of the district's potential voters. Median income among households (with one or more potential voter) in the district is about $68,127, while 9% of households live below the poverty line. As for the educational attainment of potential voters in the district, 10% of those 25 and older have not earned a high school degree, while 27% hold a bachelor's or higher degree.

Counties and municipalities in the district[]
For the 113th and successive Congresses (based on redistricting following the 2010 Census), the congressional district contains all or portions of eight counties and 92 municipalities:[4]
Atlantic County:
- all 23 municipalities
Burlington County:
- Bass River Township and Washington Township
Camden County:
Cape May County:
- all 16 municipalities
- all 14 municipalities
Gloucester County:
- Clayton, East Greenwich Township (part), Elk Township, Franklin Township, Harrison Township, Mantua Township, Newfield, Pitman, South Harrison Township, Swedesboro and Woolwich Township
Ocean County:
- Barnegat Light, Beach Haven, Eagleswood, Harvey Cedars, Little Egg Harbor Township, Long Beach Township, Ship Bottom, Stafford Township (part), Surf City, Tuckerton
- all 15 municipalities
Recent results from statewide elections[]
| Year | Office | Results |
|---|---|---|
| 1992 | President | Clinton 41 – 39% |
| 1996 | President | Clinton 50 – 36% |
| 2000 | President | Gore 54 – 43% |
| 2004 | President | Bush 50 – 49% |
| 2008 | President | Obama 53 – 45% |
| 2012 | President | Obama 53.5 – 45.4%[5] |
| 2016 | President | Trump 50.6 – 46.0%[5] |
| 2020 | President | Trump 50.8 – 47.9%[5] |
List of members representing the district[]
District organized in 1799.
1799–1801: One seat[]
| Member (District home) |
Party | Years | Cong ress |
Electoral history | Counties in the District |
|---|---|---|---|---|---|
| Aaron Kitchell (Hanover) |
Democratic-Republican | March 4, 1799 – March 3, 1801 |
6th | Elected in 1798. Retired. |
Morris and Sussex |
District organized to the at-large district in 1801
1813–1815: Two seats[]
For the 13th Congress, elected in 1813, two seats were apportioned, elected at-large on a general ticket.
| Years | Cong ress |
Seat A | Seat B | Counties in the District | |||||||
|---|---|---|---|---|---|---|---|---|---|---|---|
| Member (District home) |
Party | Electoral history | Member (District home) |
Party | Electoral history | ||||||
| March 4, 1813 – March 3, 1815 |
13th |  James Schureman (New Brunswick) |
Federalist | Elected in 1813. Retired. |
 Richard Stockton (Princeton) |
Federalist | Elected in 1813. Retired. |
Hunterdon, Middlesex, Monmouth, and Somerset Counties | |||
The District was merged into the at-large district in 1815.
1843–present: One seat[]
| Member (District home) |
Party | Years | Cong ress |
Electoral history | Counties/Towns in the District |
|---|---|---|---|---|---|
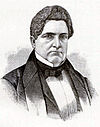 George Sykes (Mount Holly) |
Democratic | March 4, 1843 – March 3, 1845 |
28th | Elected in 1842. Retired. |
1843–1845: Burlington, Mercer, and Monmouth |
| Samuel G. Wright (Imlaystown) |
Whig | March 4, 1845 – July 30, 1845 |
29th | Elected in 1844. Died. |
1845–1847: Burlington and Monmouth |
| Vacant | July 30, 1845 – November 4, 1845 | ||||
George Sykes (Mount Holly) |
Democratic | November 4, 1845 – March 3, 1847 |
Elected to finish Wright's term. Retired. | ||
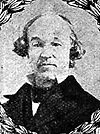
 William A. Newell (Allentown) |
Whig | March 4, 1847 – March 3, 1851 |
30th 31st |
Elected in 1846. Re-elected in 1848. Retired. |
1847–1851: Burlington, Mercer, and Monmouth |
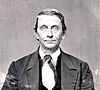
 Charles Skelton (Trenton) |
Democratic | March 4, 1851 – March 3, 1855 |
32nd 33rd |
Elected in 1850. Re-elected in 1852. Retired. |
1851–1873: Burlington, Mercer, Monmouth, and Ocean |
 George R. Robbins (Hamilton Square) |
Opposition | March 4, 1855 – March 3, 1857 |
34th 35th |
Elected in 1854. Re-elected in 1856. Retired. | |
| Republican | March 4, 1857 – March 3, 1859 | ||||
 John L.N. Stratton (Mount Holly) |
Republican | March 4, 1859 – March 3, 1863 |
36th 37th |
Elected in 1858. Re-elected in 1860. Retired. | |
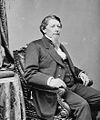
 George Middleton (Allentown) |
Democratic | March 4, 1863 – March 3, 1865 |
38th | Elected in 1862. Lost re-election. | |
William A. Newell (Allentown) |
Republican | March 4, 1865 – March 3, 1867 |
39th | Elected in 1864. Lost re-election. | |
| Charles Haight ([data unknown/missing]) |
Democratic | March 4, 1867 – March 3, 1871 |
40th 41st |
Elected in 1866. Re-elected in 1868. Retired. | |
 Samuel C. Forker ([data unknown/missing]) |
Democratic | March 4, 1871 – March 3, 1873 |
42nd | Elected in 1870. Lost re-election. | |
 Samuel A. Dobbins (Mount Holly) |
Republican | March 4, 1873 – March 3, 1877 |
43rd 44th |
Elected in 1872. Re-elected in 1874. Retired. |
1873–1903: Atlantic, Burlington, Mercer, and Ocean |
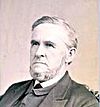
| John H. Pugh (Burlington) |
Republican | March 4, 1877 – March 3, 1879 |
45th | Elected in 1876. Lost re-election. | |
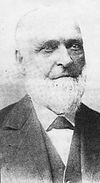 Hezekiah B. Smith (Smithville) |
Democratic | March 4, 1879 – March 3, 1881 |
46th | Elected in 1878. Lost re-election. | |
 J. Hart Brewer (Trenton) |
Republican | March 4, 1881 – March 3, 1885 |
47th 48th |
Elected in 1880. Re-elected in 1882. Retired. | |
 James Buchanan (Trenton) |
Republican | March 4, 1885 – March 3, 1893 |
49th 50th 51st 52nd |
Elected in 1884. Re-elected in 1886. Re-elected in 1888. Re-elected in 1890. Retired. | |
 John J. Gardner (Indian Mills) |
Republican | March 4, 1893 – March 3, 1913 |
53rd 54th 55th 56th 57th 58th 59th 60th 61st 62nd |
Elected in 1892. Re-elected in 1894. Re-elected in 1896. Re-elected in 1898. Re-elected in 1900. Re-elected in 1902. Re-elected in 1904. Re-elected in 1906. Re-elected in 1908. Re-elected in 1910. Lost re-election. | |
| 1903–1933: Atlantic, Burlington, Cape May, and Cumberland | |||||
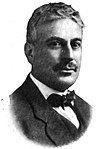
 J. Thompson Baker (Wildwood) |
Democratic | March 4, 1913 – March 3, 1915 |
63rd | Elected in 1912. Lost re-election. | |
 Isaac Bacharach (Atlantic City) |
Republican | March 4, 1915 – January 3, 1937 |
64th 65th 66th 67th 68th 69th 70th 71st 72nd 73rd 74th |
Elected in 1914. Re-elected in 1916. Re-elected in 1918. Re-elected in 1920. Re-elected in 1922. Re-elected in 1924. Re-elected in 1926. Re-elected in 1928. Re-elected in 1930. Re-elected in 1932. Re-elected in 1934. Lost re-election. | |
| 1933–1967: Atlantic, Cape May, and Cumberland | |||||
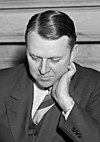 Elmer H. Wene (Vineland) |
Democratic | January 3, 1937 – January 3, 1939 |
75th | Elected in 1936. Lost re-election. | |
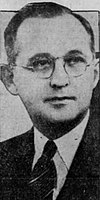 Walter S. Jeffries (Margate City) |
Republican | January 3, 1939 – January 3, 1941 |
76th | Elected in 1938. Lost re-election. | |
Elmer H. Wene (Vineland) |
Democratic | January 3, 1941 – January 3, 1945 |
77th 78th |
Elected in 1940. Re-elected in 1942. Retired to run for U.S. senator. | |
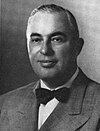 T. Millet Hand (Cape May) |
Republican | January 3, 1945 – December 26, 1956 |
79th 80th 81st 82nd 83rd 84th |
Elected in 1944. Re-elected in 1946. Re-elected in 1948. Re-elected in 1950. Re-elected in 1952. Re-elected in 1954. Died. | |
| Vacant | December 26, 1956 – November 5, 1957 |
84th 85th | |||
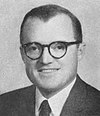
 Milton W. Glenn (Margate City) |
Republican | November 5, 1957 – January 3, 1965 |
85th 86th 87th 88th |
Elected to finish Hand's term. Also elected to the next full term. Re-elected in 1958. Re-elected in 1960. Re-elected in 1962. Lost re-election. | |
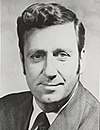
 Thomas C. McGrath Jr. (Margate City) |
Democratic | January 3, 1965 – January 3, 1967 |
89th | Elected in 1964. Lost re-election. | |
 Charles W. Sandman Jr. (Cape May Court House) |
Republican | January 3, 1967 – January 3, 1975 |
90th 91st 92nd 93rd |
Elected in 1966. Re-elected in 1968. Re-elected in 1970. Re-elected in 1972. Lost re-election. |
1967–1969: Atlantic, Cape May, Cumberland, and Salem |
| 1969–1973: [data unknown/missing] | |||||
| 1971–1983: Atlantic, Cape May, Cumberland, Salem, and parts of Burlington and Ocean | |||||
 William J. Hughes (Ocean City) |
Democratic | January 3, 1975 – January 3, 1995 |
94th 95th 96th 97th 98th 99th 100th 101st 102nd 103rd |
Elected in 1974. Re-elected in 1976. Re-elected in 1978. Re-elected in 1980. Re-elected in 1982. Re-elected in 1984. Re-elected in 1986. Re-elected in 1988. Re-elected in 1990. Re-elected in 1992. Retired. | |
| 1983–1985: Atlantic, Cape May, Cumberland, Salem, and parts of Burlington and Ocean | |||||
| 1985–1993: Atlantic, Cape May, Cumberland, Salem, and parts of Gloucester | |||||
| 1993–2003: Atlantic, Cape May, Cumberland, Salem, and parts of Burlington and Gloucester | |||||
 Frank LoBiondo (Ventnor) |
Republican | January 3, 1995 – January 3, 2019 |
104th 105th 106th 107th 108th 109th 110th 111th 112th 113th 114th 115th |
Elected in 1994. Re-elected in 1996. Re-elected in 1998. Re-elected in 2000. Re-elected in 2002. Re-elected in 2004. Re-elected in 2006. Re-elected in 2008. Re-elected in 2010. Re-elected in 2012. Re-elected in 2014. Re-elected in 2016. Retired. | |
2003–2013: Atlantic, Cape May, Cumberland, Salem, and parts of Burlington, Camden, and Gloucester | |||||
2013–present: Atlantic, Cape May, Cumberland, Salem, and parts of Burlington, Camden, Gloucester, and Ocean | |||||
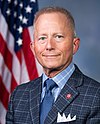 Jeff Van Drew (Dennis Township) |
Democratic | January 3, 2019 – January 7, 2020 |
116th 117th |
Elected in 2018. Re-elected in 2020. | |
| Republican | January 7, 2020 – present | ||||
Recent electoral history[]
This list is incomplete; you can help by . (August 2008) |
Results 1844–2018[6][7][8][9][10][11][12][13][14][15][16]
| Democratic | Votes | Pct | Republican | Votes | Pct | Other candidate | Votes | Pct | Other candidate | Votes | Pct | Other candidate | Votes | Pct | Other candidate | Votes | Pct | Other candidate | Votes | Pct | ||||||||
|---|---|---|---|---|---|---|---|---|---|---|---|---|---|---|---|---|---|---|---|---|---|---|---|---|---|---|---|---|
| 1844 | 7,573 | 51.9% | William Irick | 6,995 | 48.0% | |||||||||||||||||||||||
| 1844 | George Sykes | 6,503 | 48.5% | 6,919 | 51.5% | |||||||||||||||||||||||
| 1846 | Thomas E. Combes | 5,959 | 43.3% | 7,531 | 54.7% | (FNU) Ridson (Know Nothing) |
280 | 2.0% | ||||||||||||||||||||
| 1848 | Stacy G. Potts | 8,382 | 45.9% | 9,877 | 54.1% | |||||||||||||||||||||||
| 1852 | 10,229 | 52.2% | William Brown | 9,238 | 47.1% | Daniel Busby (Know Nothing) |
134 | 0.7% | ||||||||||||||||||||
| 1854 | Nathaniel S. Rue | 7,769 | 42.4% | 10,539 | 57.6% | |||||||||||||||||||||||
| 1856 | James W. Wall | 10,692 | 47.7% | 11,723 | 52.3% | |||||||||||||||||||||||
| 1858 | James W. Wall | 8,767 | 43.3% | 11,471 | 56.7% | |||||||||||||||||||||||
| 1860 | Augustus Green | 12,154 | 47.2% | 13,582 | 52.8% | |||||||||||||||||||||||
| 1862 | 12,182 | 52.9% | William Brown | 10,864 | 47.1% | |||||||||||||||||||||||
| 1864 | George Middleton | 13,091 | 48.4% | 13,953 | 51.6% | |||||||||||||||||||||||
| 1866 | 13,825 | 50.6% | William A. Newell | 13,476 | 49.4% | |||||||||||||||||||||||
| 1868 | 16,309 | 51.3% | James F. Rusling | 15,494 | 48.7% | |||||||||||||||||||||||
| 1870 | 15,899 | 50.7% | William A. Newell | 15,452 | 49.3% | |||||||||||||||||||||||
| 1872 | Samuel C. Forker | 11,787 | 45.4% | 14,192 | 54.6% | |||||||||||||||||||||||
| 1874 | Andrew J. Smith | 13,011 | 48.2% | 13,977 | 51.8% | |||||||||||||||||||||||
| 1876 | Hezekiah B. Smith | 15,485 | 49.2% | 16,015 | 50.8% | |||||||||||||||||||||||
| 1878 | 14,610 | 50.6% | John Howard Pugh | 18,580 | 47.4% | Charles E. Baker (National Prohibition) |
568 | 2.0% | ||||||||||||||||||||
| 1880 | Hezekiah B. Smith | 16,536 | 46.6% | 18,580 | 52.4% | Samuel A. Dobbins (Greenback) |
342 | 1.0% | ||||||||||||||||||||
| 1882 | Lewis Parker | 14,535 | 47.8% | 15,604 | 51.3% | Edward T. Howland (Greenback) |
270 | 0.9% | ||||||||||||||||||||
| 1884 | Franklin Gauntt | 16,853 | 45.4% | 19,144 | 51.5% | Henry B. Howell (National Prohibition) |
898 | 2.4% | Samuel A. Dobbins (Greenback) |
271 | 0.7% | |||||||||||||||||
| 1886 | Elias S. Reed | 15,065 | 42.6% | 17,767 | 50.2% | Leonard Brown (National Prohibition) |
2,547 | 7.2% | ||||||||||||||||||||
| 1888 | Chauncey H. Beasley | 19,104 | 44.6% | 22,407 | 52.4% | Minot C. Morgan (National Prohibition) |
1,292 | 3.0% | ||||||||||||||||||||
| 1890 | Wilson D. Haven | 16,352 | 46.6% | 17,515 | 50.0% | Leonard Brown (National Prohibition) |
1,200 | 3.4% | ||||||||||||||||||||
| 1892 | George D. Wetherill | 20,592 | 45.9% | 22,716 | 50.6% | F. French (National Prohibition) |
1,348 | 3.0% | D. Duroe (People's) |
169 | 0.4 | |||||||||||||||||
| 1894 | Martin L. Haines | 12,900 | 34.45% | 22,641 | 60.5% | Jacob D. Joslin (National Prohibition) |
1,278 | 3.4% | William B. Ellis (People's) |
630 | 1.7 | |||||||||||||||||
| 1896 | Abraham E. Conrow | 13,969 | 29.3% | 31,418 | 66.0% | R. Lowber Temple (National Democratic) |
1,076 | 2.3% | J. Bailie Adams (National Prohibition) |
1,036 | 2.2% | George Yardley (Socialist Labor) |
115 | 0.2 | ||||||||||||||
| 1898 | John F. Hall | 17,367 | 40.5% | 24,035 | 56.1% | Joseph J. Currie (National Prohibition) |
1,294 | 3.0% | John P. Weigel (Socialist Labor) |
153 | 0.4 | |||||||||||||||||
| 1900 | Thomas J. Prickett | 17,351 | 34.3% | 31,359 | 61.9% | Harry S. Powell (National Prohibition) |
1,419 | 2.8% | J. Louis Pancoast (Social Democratic) |
418 | 0.8% | Emil F. Wegener (Socialist Labor) |
75 | 0.1% | ||||||||||||||
| 1902 | Thomas A. Gash | 9,465 | 29.6% | 19,966 | 62.5% | Marion R. Owen (National Prohibition) |
2,323 | 7.3% | Daniel W. Davis (Socialist Labor) |
199 | 0.6% | |||||||||||||||||
| 1904 | Samuel E. Perry | 13,035 | 34.2% | 26,296 | 59.7% | Thomas H. Landon (National Prohibition) |
1,406 | 4.0% | Robert W. Buckley (Socialist) |
254 | 2.1% | Marion R. Owen (People's Dem.) |
209 | 2.1% | ||||||||||||||
| 1906 | Samuel E. Perry | 8,921 | 28.6% | 19,637 | 63.0% | William Riddle (Labor & Lincoln) |
1,249 | 4.0% | W. F. Tower (National Prohibition) |
900 | 2.9% | Morris Korshet (Socialist) |
380 | 1.2% | Marion R. Owen (Home Rule) |
105 | 0.3% | |||||||||||
| 1908 | Edward Burd Grubb | 20,506 | 44.8% | 23,906 | 52.2% | James E. Steelman (National Prohibition) |
1,012 | 2.2% | John B. Leeds (Socialist) |
347 | 0.8% | |||||||||||||||||
| 1910 | George Hampton | 16,915 | 38.2% | 22,861 | 51.6% | William Riddle (Independent Labor) |
3,508 | 7.9% | John W. Hughes (National Prohibition) |
738 | 1.7% | George S. Rawcliffe (Socialist) |
295 | 0.7% | ||||||||||||||
| 1912 | 16,130 | 45.0% | John J. Gardner | 12,330 | 34.4% | Francis D. Potter (Progressive) |
7,384 | 20.6% | ||||||||||||||||||||
| 1914 | J. Thompson Baker | 14,352 | 35.2% | 21,448 | 52.6% | William H. Bright (Progressive Roosevelt) |
3,508 | 8.6% | James Chapman (National Prohibition) |
775 | 1.9% | G. A. McKeon (Socialist) |
673 | 1.7% | ||||||||||||||
| 1916 | William Myers | 14,220 | 34.2% | 24,865 | 59.7% | J. Ward Gamble (National Prohibition) |
1,654 | 4.0% | Abraham Warren (Socialist) |
880 | 2.1% | |||||||||||||||||
| 1918 | John T. French | 8,610 | 28.2% | 20,744 | 67.9% | Levi B. Sharp (National Prohibition) |
1,206 | 3.9% | ||||||||||||||||||||
| 1920 | William E. Jonah | 21,511 | 29.5% | 51,006 | 70.0% | George E. Strother (Socialist) |
331 | 0.5% | ||||||||||||||||||||
| 1922 | Charles S. Stevens | 22,001 | 30.2% | 50,925 | 69.8% | |||||||||||||||||||||||
| 1924 | Charles S. Stevens | 21,185 | 23.8% | 67,668 | 76.2% | |||||||||||||||||||||||
| 1926 | Frank Melville | 12,775 | 19.4% | 53,174 | 80.6% | |||||||||||||||||||||||
| 1928 | George R. Greis | 30,856 | 23.7% | 99,109 | 76.3% | |||||||||||||||||||||||
| 1930 | Hans Froelicher Jr. | 17,125 | 20.1% | 67,729 | 79.7% | Florian Ambroseh (Communist) |
155 | 0.2% | ||||||||||||||||||||
| 1932 | Harry R. Coulomb | 35,257 | 36.4% | 60,963 | 62.9% | Albert H. Schreiber (Socialist-Labor) |
413 | 0.4% | Walter L. Yerkes (Prohibition) |
292 | 0.3% | |||||||||||||||||
| 1934 | Charles W. Ackley | 48,743 | 49.3% | 49,824 | 50.4% | Franklin L. Watkins (Socialist-Labor) |
226 | 0.2% | ||||||||||||||||||||
| 1936 | 55,580 | 50.0% | Isaac Bacharach | 50,958 | 45.8% | Ted Lenore (Townsend Nonpartisan) |
3,241 | 2.9% | U. G. Robinson (Prop. Home Protection) |
1,206 | 1.1% | Franklin L. Watkins (Socialist) |
97 | 0.1% | Frank A. Yacovelli (Townsend Social Justice) |
86 | 0.1% | (End Poverty Const) |
18 | <0.1% | ||||||||
| 1938 | Elmer H. Wene | 55,344 | 49.1% | 57,090 | 50.1% | Isaac Stalberg (Roosevelt Liberal Independent) |
222 | 0.2% | Margaret V. Moody (National Prohibition) |
91 | 0.1% | Anthon B. Ferretti (Independent Peoples) |
47 | <0.1% | Frank B. Hubin (Roosevelt Independent) |
23 | <0.1% | |||||||||||
| 1940 | 60,392 | 52.4% | Walter S. Jeffries | 54,897 | 47.6% | Joseph B. Sharp (Prohibition) |
35 | <0.1% | ||||||||||||||||||||
| 1942 | 40,478 | 53.0% | Benjamin D. Foulois | 35,930 | 47.0% | |||||||||||||||||||||||
| 1944 | Edison Hedges | 42,862 | 45.6% | 51,194 | 54.4% | |||||||||||||||||||||||
| 1946 | Edward T. Keeley | 26,740 | 32.9% | 54,511 | 67.1% | |||||||||||||||||||||||
| 1948 | William E. Stringer | 38,194 | 37.5% | 62,804 | 61.7% | (Progressive) |
764 | 0.8% | ||||||||||||||||||||
| 1952 | Charles Edward Rupp | 46,174 | 36.6% | 79,955 | 63.4% | |||||||||||||||||||||||
| 1954 | Clayton E. Burdick | 37,541 | 36.4% | 65,551 | 63.6% | Morris Karp (Socialist-Labor) |
56 | 0.1% | ||||||||||||||||||||
| 1956 | Thomas C. Stewart | 39,383 | 32.0% | 83,433 | 67.8% | Morris Karp (Socialist-Labor) |
151 | 0.1% | ||||||||||||||||||||
| 1958 | Joseph G. Hancock | 50,558 | 46.1% | 58,621 | 53.4% | Morris Karp (Socialist-Labor) |
547 | 0.5% | ||||||||||||||||||||
| 1960 | John A. Miller | 59,520 | 43.2% | 77,894 | 56.5% | Morris Karp (Socialist-Labor) |
338 | 0.2% | ||||||||||||||||||||
| 1962 | Paul R. Porreca | 54,317 | 46.7% | 61,285 | 52.7% | Elwin Baker (Socialist Labor) |
625 | 0.5% | ||||||||||||||||||||
| 1964 | 73,264 | 50.8% | Milton W. Glenn | 70,997 | 49.2% | |||||||||||||||||||||||
| 1966 | Thomas C. McGrath Jr. | 65,494 | 46.9% | 72,014 | 51.5% | Albert Ronis (Socialist Labor) |
1,259 | 0.9% | Lindwood W. Erickson Jr. (Conservative) |
991 | 0.7% | |||||||||||||||||
| 1968 | David Dichter | 73,361 | 44.4% | 91,218 | 55.3% | Albert Ronis (Socialist Labor) |
505 | 0.3% | ||||||||||||||||||||
| 1970 | William J. Hughes | 64,882 | 48.3% | 69,392 | 51.7% | |||||||||||||||||||||||
| 1972 | John D. Rose | 69,374 | 34.3% | 133,096 | 65.7% | |||||||||||||||||||||||
| 1974 | 109,763 | 57.3% | Charles W. Sandman Jr. | 79,064 | 41.3% | Andrew Wenger (Independent) |
2,693 | 1.4% | ||||||||||||||||||||
| 1976 | 141,753 | 61.7% | James R. Hurley | 87,915 | 38.3% | |||||||||||||||||||||||
| 1978 | 112,768 | 66.4% | James H. Biggs | 56,997 | 33.6% | |||||||||||||||||||||||
| 1980 | 135,437 | 57.5% | Beech N. Fox | 97,072 | 41.2% | Robert C. Rothhouse (Libertarian) |
2,262 | 1.0% | Adele Frisch (Socialist Labor) |
939 | 0.4% | |||||||||||||||||
| 1982 | 102,826 | 68.0% | John J. Mahoney | 47,069 | 31.1% | Bruce Powers (Libertarian) |
1,233 | 0.8% | ||||||||||||||||||||
| 1984 | 132,841 | 63.2% | Raymond G. Massie | 77,231 | 36.8% | |||||||||||||||||||||||
| 1986 | 83,821 | 68.3% | Alfred J. Bennington Jr. | 35,167 | 28.6% | Len Smith (Pro Life, Anti-Abortion) |
3,812 | 3.1% | ||||||||||||||||||||
| 1988 | 134,505 | 65.7% | Kirk W. Conover | 67,759 | 33.1% | Richard A. Schindewolf Jr. (Pro-Life Conservative) |
2,372 | 1.2% | ||||||||||||||||||||
| 1990 | 97,698 | 88.2% | (no candidate) | William A. Kanengiser (Populist) |
13,120 | 11.8% | ||||||||||||||||||||||
| 1992 | 132,465 | 55.9% | Frank A. LoBiondo | 98,315 | 41.5% | Roger W. Bacon (Libertarian) |
2,575 | 1.1% | Joseph Ponczek (Anti-Tax) |
2,067 | 0.9% | Andrea Lippi (Freedom, Equality, Prosperity) |
1,605 | 0.7% | ||||||||||||||
| 1994 | Louis N. Magazzu | 56,151 | 35.4% | 102,566 | 64.6% | |||||||||||||||||||||||
| 1996 | Ruth Katz | 83,890 | 38.0% | 133,131 | 60.3% | David Rodger Headrick (Independent) |
1,439 | 0.7% | Judith Lee Azaren (Independent) |
1,174 | 0.5% | Andrea Lippi (Independent) |
1,084 | 0.5% | ||||||||||||||
| 1998 | Derek Hunsberger | 43,563 | 30.8% | 93,248 | 65.9% | Glenn Campbell (Independent) |
2,955 | 2.1% | Mary A. Whittam (Independent) |
1,748 | 1.2% | |||||||||||||||||
| 2000 | Edward G. Janosik | 74,632 | 31.9% | 155,187 | 66.4% | Robert Gabrielsky (Independent) |
3,252 | 1.4% | Constantino Rozzo (Independent) |
788 | 0.3% | |||||||||||||||||
| 2002 | Steven A. Farkas | 47,735 | 28.3% | 116,834 | 69.2% | Roger Merle (Green) |
1,739 | 1.0% | Michael J. Matthews Jr. (Libertarian) |
1,720 | 1.0% | Costantino Rozzo (Socialist Party USA) |
771 | 0.5% | ||||||||||||||
| 2004 | Timothy J. Robb | 86,792 | 32.7% | 172,779 | 65.1% | Willie Norwood (Jobs Equality Business) |
1,993 | 0.8% | Michael J. Matthews Jr. (Libertarian) |
1,767 | 0.7% | Jose David Alcantara (Green) |
1,516 | 0.6% | Costantino Rozzo (Socialist Party USA) |
595 | 0.2% | |||||||||||
| 2006 | Viola Thomas-Hughes | 64,277 | 35.6% | 111,245 | 61.6% | Robert E. Mullock (Preserve Green Space) |
3,071 | 1.7% | Lynn Merle (A New Direction) |
992 | 0.5% | Thomas Fanslau (We The People) |
603 | 0.3% | Willie Norwood (Socialist) |
385 | 0.2% | |||||||||||
| 2008 | David C. Kurkowski | 110,990 | 39.1% | 167,701 | 59.1% | Jason M. Grover (Green) |
1,763 | 0.6% | Peter Frank Boyce (Constitution) |
1,551 | 0.5% | Gary Stein (Rock the Boat) |
1,312 | 0.5% | Costantino Rozzo (Socialist Party USA) |
648 | 0.2% | |||||||||||
| 2010 | Gary Stein | 51,690 | 30.9% | 109,460 | 65.5% | Peter Frank Boyce (Constitution) |
4,120 | 2.5% | Mark Lovett (marklovett.us) |
1,123 | 0.7% | Vitov Valdes-Munoz (American Labor) |
727 | 0.4% | ||||||||||||||
| 2012 | Cassandra Shober | 116,463 | 40.3% | 166,679 | 57.7% | John Ordille (Libertarian) |
2,699 | 0.9% | Charles Lukens (Constitutional Conservative) |
1,329 | 0.5% | David W. Bowen Sr. (The People's Agenda) |
1,010 | 0.3% | Frank Faralli Jr. (Conservative, Compassionate, Creative) |
892 | 0.3% | |||||||||||
| 2014 | Bill Hughes Jr. | 62,986 | 37.0% | 104,958 | 61.7% | Alexander H. Spano (Democratic-Republican (New)) |
637 | 0.4% | Gary Stein (Various slogans) |
575 | 0.3% | Costantino Rozzo (American Labor (New)) |
473 | 0.3% | Bayode Olabisi (Making Us Better) |
447 | 0.3% | |||||||||||
| 2016 | David Cole | 110,838 | 37.2% | 176,338 | 59.2% | John Ordille (Libertarian) |
3,773 | 1.3% | James Keenan (Make Government Work) |
2,653 | 0.9% | Steven Fenichel (Representing the 99%) |
1,574 | 0.5% | Eric Beechwood (People's Independent Progressive) |
1,387 | 0.5% | Gabriel Brian Franco (For Political Revolution) |
1,232 | 0.4% | ||||||||
| 2018 | 125,755 | 52.3% | Seth Grossman | 110,491 | 45.9 | John Ordille (Libertarian) |
1,631 | 0.6% | Steven Fenichel (Time for Truth) |
1,046 | 0.4% | Anthony Parisi Sanchez (Cannot Be Bought) |
964 | 0.4% | William R. Benfer (Independent) |
816 | 0.4% | |||||||||||
| 2020 | Amy Kennedy | 173,849 | 46.2% | 195,526 | 51.9% | Jenna Harvey (Independent) |
4,136 | 1.1% | Jesse Ehrnstrom (Libertarian) |
3,036 | 0.8% | |||||||||||||||||
References[]
- ^ Center for New Media & Promotion (CNMP), US Census Bureau. "My Congressional District". www.census.gov. Retrieved October 29, 2020.
- ^ "Introducing the 2021 Cook Political Report Partisan Voter Index". The Cook Political Report. April 15, 2021. Retrieved April 15, 2021.
- ^ "Representing US: 2020 Voter Profiles". APM Research Lab. Retrieved October 22, 2020.
- ^ "Plan Components Report" (PDF). New Jersey Redistricting Commission. December 23, 2011.
- ^ a b c Nir, David. "Daily Kos Elections' presidential results by congressional district for the 2016 and 2012 elections", Daily Kos, November 19, 2012. Accessed November 12, 2017.
- ^ "Election Statistics". Office of the Clerk of the House of Representatives. Retrieved September 20, 2013.
- ^ 2012 Official General Election Results, House of Representatives, New Jersey Department of State, for 2012 results
- ^ Lundy, F. L.; Fitzgerald, Thomas F.; Gosson, Louis C.; Fitzgerald, Josephine A.; Dullard, John P.; Gribbins, J. Joseph (January 1, 1907). Fitzgerald's Legislative Manual, State of New Jersey. J.A. Fitzgerald.
- ^ Lundy, F. L.; Fitzgerald, Thomas F.; Gosson, Louis C.; Fitzgerald, Josephine A.; Dullard, John P.; Gribbins, J. Joseph (January 1, 1905). Manual of the Legislature of New Jersey. J.A. Fitzgerald.
- ^ Fitzgerald, Thomas F. (January 1, 1911). Fitzgerald's Legislative Manual, State of New Jersey. J.A. Fitzgerald.
- ^ Langland, James (January 1, 1914). The Troy Record Almanac and Year-book. The Troy record Co.
- ^ Lundy, F. L.; Fitzgerald, Thomas F.; Gosson, Louis C.; Fitzgerald, Josephine A.; Dullard, John P.; Gribbins, J. Joseph (January 1, 1915). Manual of the Legislature of New Jersey. J.A. Fitzgerald.
- ^ Lundy, F. L.; Fitzgerald, Thomas F.; Gosson, Louis C.; Fitzgerald, Josephine A.; Dullard, John P.; Gribbins, J. Joseph (January 1, 1917). Manual of the Legislature of New Jersey. J.A. Fitzgerald.
- ^ Lundy, F. L.; Fitzgerald, Thomas F.; Gosson, Louis C.; Fitzgerald, Josephine A.; Dullard, John P.; Gribbins, J. Joseph (January 1, 1919). Manual of the Legislature of New Jersey. J.A. Fitzgerald.
- ^ Greeley, Horace (January 1, 1910). The Tribune Almanac and Political Register. The Tribune Association.
- ^ The Tribune Almanac and Political Register for ... Greeley & McElrath. January 1, 1903.
- Martis, Kenneth C. (1989). The Historical Atlas of Political Parties in the United States Congress. New York: Macmillan Publishing Company.
- Martis, Kenneth C. (1982). The Historical Atlas of United States Congressional Districts. New York: Macmillan Publishing Company.
- Congressional Biographical Directory of the United States 1774–present
Further reading[]
- Amber Phillips (September 25, 2020), "The House seats most likely to flip in November", Washingtonpost.com
- Congressional districts of New Jersey
- Atlantic County, New Jersey
- Burlington County, New Jersey
- Camden County, New Jersey
- Cape May County, New Jersey
- Cumberland County, New Jersey
- Gloucester County, New Jersey
- Salem County, New Jersey
- Constituencies established in 1799
- 1799 establishments in New Jersey
- Constituencies disestablished in 1801
- 1801 disestablishments in New Jersey
- Constituencies established in 1813
- 1813 establishments in New Jersey
- Constituencies disestablished in 1815
- 1815 disestablishments in New Jersey
- Constituencies established in 1843
- 1843 establishments in New Jersey