Particulates

| Part of a series on |
| Pollution |
|---|
 |
| WikiProject Environment WikiProject Ecology |
|
Category (By country)
|
Particulates – also known as atmospheric aerosol particles, atmospheric particulate matter, particulate matter (PM), or suspended particulate matter (SPM) – are microscopic particles of solid or liquid matter suspended in the air. The term aerosol commonly refers to the particulate/air mixture, as opposed to the particulate matter alone.[1] Sources of particulate matter can be natural or anthropogenic.[2] They have impacts on climate and precipitation that adversely affect human health, in ways additional to direct inhalation.
Types of atmospheric particles include suspended particulate matter; thoracic and respirable particles;[3] inhalable coarse particles, designated PM10, which are coarse particles with a diameter of 10 micrometers (μm) or less; fine particles, designated PM2.5, with a diameter of 2.5 μm or less;[4] ultrafine particles, with a diameter of 100 nm or less; and soot.
The IARC and WHO designate airborne particulates as a Group 1 carcinogen.[5] Particulates are the most harmful form of air pollution[6] due to their ability to penetrate deep into the lungs, blood streams and brain, causing health problems including heart attacks, respiratory disease, and premature death.[7] In 2013, a study involving 312,944 people in nine European countries revealed that there was no safe level of particulates and that for every increase of 10 μg/m3 in PM10, the lung cancer rate rose 22% (95% CI [1.03–1.45]). The smaller PM2.5 were particularly deadly, with an 18% increase in lung cancer per 5 μg/m3 (95% CI [0.96–1.46]) as it can penetrate deeper into the lungs.[8] Worldwide exposure to PM2.5 contributed to 4.1 million deaths from heart disease and stroke, lung cancer, chronic lung disease, and respiratory infections in 2016.[9] Overall, ambient particulate matter ranks as the sixth leading risk factor for premature death globally.[10]
Atmospheric sources[]
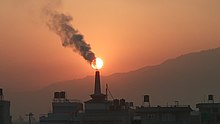
Some particulates occur naturally, originating from volcanoes, dust storms, forest and grassland fires, living vegetation and sea spray. Human activities, such as the burning of fossil fuels in vehicles,[11] stubble burning, power plants, road dust, wet cooling towers in cooling systems and various industrial processes, also generate significant amounts of particulates. Coal combustion in developing countries is the primary method for heating homes and supplying energy. Because salt spray over the oceans is the overwhelmingly most common form of particulate in the atmosphere, anthropogenic aerosols—those made by human activities—currently account for about 10 percent of the total mass of aerosols in our atmosphere.[12]
Composition[]
The composition and toxicity of aerosols, including particles, depends on their source and atmospheric chemistry and varies widely. Wind-blown mineral dust[13] tends to be made of mineral oxides and other material blown from the Earth's crust; this particulate is light-absorbing.[14] Sea salt[15] is considered the second-largest contributor in the global aerosol budget, and consists mainly of sodium chloride originated from sea spray; other constituents of atmospheric sea salt reflect the composition of sea water, and thus include magnesium, sulfate, calcium, potassium, etc. In addition, sea spray aerosols may contain organic compounds, which influence their chemistry.
Some secondary particles derive from the oxidation of primary gases such as sulfur and nitrogen oxides into sulfuric acid (liquid) and nitric acid (gaseous) or from biogenic emissions. The precursors for these aerosols—i.e. the gases from which they originate—may have an anthropogenic origin (from any fossil fuel combustion) and a natural biogenic origin. In the presence of ammonia, secondary aerosols often take the form of ammonium salts; i.e. ammonium sulfate and ammonium nitrate (both can be dry or in aqueous solution); in the absence of ammonia, secondary compounds take an acidic form as sulfuric acid (liquid aerosol droplets) and nitric acid (atmospheric gas), all of which probably contribute to the health effects of particulates.[16]
Secondary sulfate and nitrate aerosols are strong light-scatterers.[17] This is mainly because the presence of sulfate and nitrate causes the aerosols to increase to a size that scatters light effectively.
Organic matter (OM) found in aerosols can be either primary or secondary, the latter part deriving from the oxidation of volatile organic compounds (VOCs); organic material in the atmosphere may either be biogenic or anthropogenic. Organic matter influences the atmospheric radiation field by both scattering and absorption. Some aerosols are predicted to include strongly light-absorbing material and are thought to yield large positive radiative forcing. Some secondary organic aerosols (SOAs) resulting from combustion products of internal combustion engines, have been identified as a danger to health.[18] Particulate toxicity has been found to vary by region and source contribution which affects the particles chemical composition.
The chemical composition of the aerosol directly affects how it interacts with solar radiation. The chemical constituents within the aerosol change the overall refractive index. The refractive index will determine how much light is scattered and absorbed.
The composition of particulate matter that generally causes visual effects, haze, consists of sulfur dioxide, nitrogen oxides, carbon monoxide, mineral dust, and organic matter. The particles are hygroscopic due to the presence of sulfur, and SO2 is converted to sulfate when high humidity and low temperatures are present. This causes reduced visibility and yellow color.[19]
Size distribution[]

The false-color maps in the map of distribution of aerosol particles on this page show where there are natural aerosols, human pollution, or a mixture of both, monthly.
Among the most obvious patterns that the size distribution time series shows is that in the planet's most southerly latitudes, nearly all the aerosols are large, but in the high northern latitudes, smaller aerosols are very abundant. Most of the Southern Hemisphere is covered by the ocean, where the largest source of aerosols is natural sea salt from dried sea spray. Because the land is concentrated in the Northern Hemisphere, the amount of small aerosols from fires and human activities is greater there than in the Southern Hemisphere. Overland, patches of large-radius aerosols appear over deserts and arid regions, most prominently, the Sahara Desert in North Africa and the Arabian Peninsula, where dust storms are common. Places where human-triggered or natural fire activity is common (land-clearing fires in the Amazon from August–October, for example, or lightning-triggered fires in the forests of northern Canada in Northern Hemisphere summer) are dominated by smaller aerosols. Human-produced (fossil fuel) pollution is largely responsible for the areas of small aerosols overdeveloped areas such as the eastern United States and Europe, especially in their summer.[20][better source needed]
Satellite measurements of aerosols, called aerosol optical thickness, are based on the fact that the particles change the way the atmosphere reflects and absorbs visible and infrared light. As shown in the seventh image on this page, an optical thickness of less than 0.1 (palest yellow) indicates a crystal clear sky with maximum visibility, whereas a value of 1 (reddish-brown) indicates very hazy conditions.[21][better source needed]
Deposition processes[]
In general, the smaller and lighter a particle is, the longer it will stay in the air. Larger particles (greater than 10 micrometers in diameter) tend to settle to the ground by gravity in a matter of hours whereas the smallest particles (less than 1 micrometer) can stay in the atmosphere for weeks and are mostly removed by precipitation. Diesel particulate matter is highest near the source of emission.[22] Any information regarding DPM and the atmosphere, flora, height, and distance from major sources is useful to determine health effects.
Controlling technologies[]
A complicated blend of solid and liquid particles result in particulate matter and these particulate matter emissions are highly regulated in most industrialized countries. Due to environmental concerns, most industries are required to operate some kind of dust collection system to control particulate emissions.[23] These systems include inertial collectors (cyclonic separators), fabric filter collectors (baghouses), electrostatic filters used in facemasks,[24] wet scrubbers, and electrostatic precipitators.
Cyclonic separators are useful for removing large, coarse particles and are often employed as a first step or "pre-cleaner" to other more efficient collectors. Well-designed cyclonic separators can be very efficient in removing even fine particulates, and may be operated continuously without requiring frequent shutdowns for maintenance.
Fabric filters or baghouses are the most commonly employed in general industry.[25] They work by forcing dust-laden air through a bag-shaped fabric filter leaving the particulate to collect on the outer surface of the bag and allowing the now clean air to pass through to either be exhausted into the atmosphere or in some cases recirculated into the facility. Common fabrics include polyester and fiberglass and common fabric coatings include PTFE (commonly known as Teflon). The excess dust buildup is then cleaned from the bags and removed from the collector.
Wet scrubbers pass the dirty air through a scrubbing solution (usually a mixture of water and other compounds) allowing the particulate to attach to the liquid molecules. Electrostatic precipitators electrically charge the dirty air as it passes through. The now charged air then passes through large electrostatic plates which attract the charged particle in the airstream collecting them and leaving the now clean air to be exhausted or recirculated.
Besides removing particulates from the source of pollution, it can also be cleaned in the open air.
Climate effects[]

Atmospheric aerosols affect the climate of the earth by changing the amount of incoming solar radiation and outgoing terrestrial longwave radiation retained in the earth's system. This occurs through several distinct mechanisms which are split into direct, indirect[26][27] and semi-direct aerosol effects. The aerosol climate effects are the biggest source of uncertainty in future climate predictions.[28] The Intergovernmental Panel on Climate Change, Third Assessment Report, says: While the radiative forcing due to greenhouse gases may be determined to a reasonably high degree of accuracy... the uncertainties relating to aerosol radiative forcings remain large, and rely to a large extent on the estimates from global modeling studies that are difficult to verify at the present time.[29]
Aerosol radiative[]


Direct[]


The direct aerosol effect consists of any direct interaction of radiation with atmospheric aerosols, such as absorption or scattering. It affects both short and longwave radiation to produce a net negative radiative forcing.[30] The magnitude of the resultant radiative forcing due to the direct effect of an aerosol is dependent on the albedo of the underlying surface, as this affects the net amount of radiation absorbed or scattered to space. e.g. if a highly scattering aerosol is above a surface of low albedo it has a greater radiative forcing than if it was above a surface of high albedo. The converse is true of absorbing aerosol, with the greatest radiative forcing arising from a highly absorbing aerosol over a surface of high albedo.[26] The direct aerosol effect is a first-order effect and is therefore classified as a radiative forcing by the IPCC.[28] The interaction of an aerosol with radiation is quantified by the single-scattering albedo (SSA), the ratio of scattering alone to scattering plus absorption (extinction) of radiation by a particle. The SSA tends to unity if scattering dominates, with relatively little absorption, and decreases as absorption increases, becoming zero for infinite absorption. For example, the sea-salt aerosol has an SSA of 1, as a sea-salt particle only scatters, whereas soot has an SSA of 0.23, showing that it is a major atmospheric aerosol absorber.
Indirect[]
The Indirect aerosol effect consists of any change to the earth's radiative budget due to the modification of clouds by atmospheric aerosols and consists of several distinct effects. Cloud droplets form onto pre-existing aerosol particles, known as cloud condensation nuclei (CCN). Droplets condensing around human-produced aerosols such as found in particulate pollution tend to be smaller and more numerous than those forming around aerosol particles of natural origin (such as windblown dust).[12]
For any given meteorological conditions, an increase in CCN leads to an increase in the number of cloud droplets. This leads to more scattering of shortwave radiation i.e. an increase in the albedo of the cloud, known as the Cloud albedo effect, First indirect effect or Twomey effect.[27] Evidence supporting the cloud albedo effect has been observed from the effects of ship exhaust plumes[31] and biomass burning[32] on cloud albedo compared to ambient clouds. The Cloud albedo aerosol effect is a first order effect and therefore classified as a radiative forcing by the IPCC.[28]
An increase in cloud droplet number due to the introduction of aerosol acts to reduce the cloud droplet size, as the same amount of water is divided into more droplets. This has the effect of suppressing precipitation, increasing the cloud lifetime, known as the cloud lifetime aerosol effect, second indirect effect or Albrecht effect.[28] This has been observed as the suppression of drizzle in ship exhaust plume compared to ambient clouds,[33] and inhibited precipitation in biomass burning plumes.[34] This cloud lifetime effect is classified as a climate feedback (rather than a radiative forcing) by the IPCC due to the interdependence between it and the hydrological cycle.[28] However, it has previously been classified as a negative radiative forcing.[35]
Semi-direct[]
The Semi-direct effect concerns any radiative effect caused by absorbing atmospheric aerosol such as soot, apart from direct scattering and absorption, which is classified as the direct effect. It encompasses many individual mechanisms, and in general is more poorly defined and understood than the direct and indirect aerosol effects. For instance, if absorbing aerosols are present in a layer aloft in the atmosphere, they can heat surrounding air which inhibits the condensation of water vapour, resulting in less cloud formation.[36] Additionally, heating a layer of the atmosphere relative to the surface results in a more stable atmosphere due to the inhibition of atmospheric convection. This inhibits the convective uplift of moisture,[37] which in turn reduces cloud formation. The heating of the atmosphere aloft also leads to a cooling of the surface, resulting in less evaporation of surface water. The effects described here all lead to a reduction in cloud cover i.e. an increase in planetary albedo. The semi-direct effect classified as a climate feedback) by the IPCC due to the interdependence between it and the hydrological cycle.[28] However, it has previously been classified as a negative radiative forcing.[35]
Specific aerosol roles[]
Sulfate[]
Sulfate aerosol has two main effects, direct and indirect. The direct effect, via albedo, is a cooling effect that slows the overall rate of global warming: the IPCC's best estimate of the radiative forcing is −0.4 watts per square meter with a range of −0.2 to −0.8 W/m2.[38] However there are substantial uncertainties. The effect varies strongly geographically, with most cooling believed to be at and downwind of major industrial centers. Modern climate models addressing the attribution of recent climate change take into account sulfate forcing, which appears to account (at least partly) for the slight drop in global temperature in the middle of the 20th century. The indirect effect via the aerosol acting as cloud condensation nuclei (CCN) and thereby modifying the cloud properties (albedo and lifetime) is more uncertain but is believed to be cooling.
Black carbon[]
Black carbon (BC), or carbon black, or elemental carbon (EC), often called soot, is composed of pure carbon clusters, skeleton balls and fullerenes, and is one of the most important absorbing aerosol species in the atmosphere. It should be distinguished from organic carbon (OC): clustered or aggregated organic molecules on their own or permeating an EC buckyball. Black carbon from fossil fuels is estimated by the IPCC in the Fourth Assessment Report of the IPCC, 4AR, to contribute a global mean radiative forcing of +0.2 W/m2 (was +0.1 W/m2 in the Second Assessment Report of the IPCC, SAR), with a range +0.1 to +0.4 W/m2. A study published in 2013 however, states that "the best estimate for the industrial-era (1750 to 2005) direct radiative forcing of atmospheric black carbon is +0.71 W/m2 with 90% uncertainty bounds of (+0.08, +1.27) W/m2" with "total direct forcing by all-black carbon sources, without subtracting the preindustrial background, is estimated as +0.88 (+0.17, +1.48) W/m2".[39]
Instances[]
Volcanoes are a large natural source of aerosol and have been linked to changes in the earth's climate often with consequences for the human population. Eruptions linked to changes in climate include the 1600 eruption of Huaynaputina which was linked to the Russian famine of 1601 - 1603,[40][41][42] leading to the deaths of two million, and the 1991 eruption of Mount Pinatubo which caused a global cooling of approximately 0.5 °C lasting several years.[43][44] Research tracking the effect of light-scattering aerosols in the stratosphere during 2000 and 2010 and comparing its pattern to volcanic activity show a close correlation. Simulations of the effect of anthropogenic particles showed little influence at present levels.[45][46]
Aerosols are also thought to affect weather and climate on a regional scale. The failure of the Indian monsoon has been linked to the suppression of evaporation of water from the Indian Ocean due to the semi-direct effect of anthropogenic aerosol.[47]
Recent studies of the Sahel drought[48] and major increases since 1967 in rainfall in Australia over the Northern Territory, Kimberley, Pilbara and around the Nullarbor Plain have led some scientists to conclude that the aerosol haze over South and East Asia has been steadily shifting tropical rainfall in both hemispheres southward.[47][49]
Health effects[]

Size, shape and solubility matter[]
The size of the particle is the main determinant of where in the respiratory tract the particle will come to rest when inhaled. Larger particles are generally filtered in the nose and throat via cilia and mucus, but particulate matter smaller than about 10 micrometers, can settle in the bronchi and lungs and cause health problems. The 10-micrometer size does not represent a strict boundary between respirable and non-respirable particles but has been agreed upon for monitoring of airborne particulate matter by most regulatory agencies. Because of their small size, particles on the order of 10 micrometers or less (coarse particulate matter, PM10) can penetrate the deepest part of the lungs such as the bronchioles or alveoli.[50] When asthmatics are exposed to these conditions it can trigger bronchoconstriction.[51]
Similarly, so called fine particulate matter (PM2.5), tends to penetrate into the gas exchange regions of the lung (alveolus), and very small particles (ultrafine particulate matter, PM0.1) may pass through the lungs to affect other organs. Penetration of particles is not wholly dependent on their size; shape and chemical composition also play a part. To avoid this complication, simple nomenclature is used to indicate the different degrees of relative penetration of a PM particle into the cardiovascular system. Inhalable particles penetrate no further than the bronchi as they are filtered out by the cilia. Thoracic particles can penetrate right into terminal bronchioles whereas PM0.1, which can penetrate to alveoli, the gas exchange area, and hence the circulatory system are termed respirable particles. In analogy, the inhalable dust fraction is the fraction of dust entering the nose and mouth which may be deposited anywhere in the respiratory tract. The thoracic fraction is the fraction that enters the thorax and is deposited within the lung's airways. The respirable fraction is what is deposited in the gas exchange regions (alveoli).[52]
The smallest particles, less than 100 nanometers (nanoparticles), may be even more damaging to the cardiovascular system.[53] Nanoparticles can pass through cell membranes and migrate into other organs, including the brain. Particles emitted from modern diesel engines (commonly referred to as Diesel Particulate Matter, or DPM) are typically in the size range of 100 nanometers (0.1 micrometers). These soot particles also carry carcinogens like benzopyrenes adsorbed on their surface. Particulate mass is not a proper measure of the health hazard, because one particle of 10 μm diameter has approximately the same mass as 1 million particles of 100 nm diameter, but is much less hazardous, as it is unlikely to enter the alveoli. Legislative limits for engine emissions based on mass are therefore not protective. Proposals for new regulations exist in some countries,[which?] with suggestions to limit the particle surface area or the particle count (numerical quantity) instead.[citation needed]
The site and extent of absorption of inhaled gases and vapors are determined by their solubility in water. Absorption is also dependent upon air flow rates and the partial pressure of the gases in the inspired air. The fate of a specific contaminant is dependent upon the form in which it exists (aerosol or particulate). Inhalation also depends upon the breathing rate of the subject.[54]
Another complexity not entirely documented is how the shape of PM can affect health, except for the needle-like shape of asbestos which can lodge itself in the lungs. Geometrically angular shapes have more surface area than rounder shapes, which in turn affects the binding capacity of the particle to other, possibly more dangerous substances.
Health problems[]

The effects of inhaling particulate matter that have been widely studied in humans and animals include asthma, lung cancer, respiratory diseases, cardiovascular disease, premature delivery, birth defects, low birth weight, and premature death. Outdoor fine particulates with diameter less than 2.5 microns accounts for 4.2 million annual deaths worldwide, and more than 103 million disability-adjusted life-years lost, making it the fifth leading risk factor for death. Particulates may cause tissue damage by entering organs directly, or indirectly by systemic inflammation. Adverse impacts may obtain even at exposure levels lower than published air quality standards deemed safe.[55][56]
Anthropogenic fine particulates as main hazard[]
Increased levels of fine particles in the air as a result of anthropogenic particulate air pollution "is consistently and independently related to the most serious effects, including lung cancer[8] and other cardiopulmonary mortality."[57] The association between a large number of deaths[58] and other health problems and particulate pollution was first demonstrated in the early 1970s[59] and has been reproduced many times since. PM pollution is estimated to cause 22,000–52,000 deaths per year in the United States (from 2000)[60] contributed to ~370,000 premature deaths in Europe during 2005.[61] and 3.22 million deaths globally in 2010 per the global burden of disease collaboration.[62]
A study in 2000 conducted in the U.S. explored how fine particulate matter may be more harmful than coarse particulate matter. The study was based on six different cities. They found that deaths and hospital visits that were caused by particulate matter in the air were primarily due fine particulate matter.[63] Similarly, a 1987 study of American air pollution data found that fine particles and sulfates, as opposed to coarser particles, most consistently and significantly correlated to total annual mortality rates in standard metropolitan statistical areas.[64]
Pregnancy, fetuses and birth effects[]
Higher rates of infertility have been correlated with exposure to particulates.[65]
In addition, inhalation of PM2.5 – PM10 is associated with elevated risk of adverse pregnancy outcomes, such as low birth weight.[66] Maternal PM2.5 exposure during pregnancy is also associated with high blood pressure in children.[67] Exposure to PM2.5 has been associated with greater reductions in birth weight than exposure to PM10.[68] PM exposure can cause inflammation, oxidative stress, endocrine disruption, and impaired oxygen transport access to the placenta,[69] all of which are mechanisms for heightening the risk of low birth weight.[70] Overall epidemiologic and toxicological evidence suggests that a causal relationship exists between long-term exposures to PM2.5 and developmental outcomes (i.e. low birth weight).[68] However, studies investigating the significance of trimester-specific exposure have proven to be inconclusive,[71] and results of international studies have been inconsistent in drawing associations of prenatal particulate matter exposure and low birth weight.[68] As perinatal outcomes have been associated with lifelong health[72][73] and exposure to particulate matter is widespread, this issue is of critical public health importance and additional research will be essential to inform public policy on the matter.
Cardiovascular and respiratory disease[]
A 2002 study indicated that PM2.5 leads to high plaque deposits in arteries, causing vascular inflammation and atherosclerosis – a hardening of the arteries that reduces elasticity, which can lead to heart attacks and other cardiovascular problems.[74] A 2014 meta analysis reported that long term exposure to particulate matter is linked to coronary events. The study included 11 cohorts participating in the European Study of Cohorts for Air Pollution Effects (ESCAPE) with 100,166 participants, followed for an average of 11.5 years. An increase in estimated annual exposure to PM 2.5 of just 5 μg/m3 was linked with a 13% increased risk of heart attacks.[75] In 2017 a study revealed that PM not only affects human cells and tissues, but also impacts bacteria which cause disease in humans.[76] This study concluded that biofilm formation, antibiotic tolerance, and colonisation of both Staphylococcus aureus and Streptococcus pneumoniae was altered by black carbon exposure.
The largest US study on acute health effects of coarse particle pollution between 2.5 and 10 micrometers in diameter was published 2008 and found an association with hospital admissions for cardiovascular diseases but no evidence of an association with the number of hospital admissions for respiratory diseases.[77] After taking into account fine particle levels (PM2.5 and less), the association with coarse particles remained but was no longer statistically significant, which means the effect is due to the subsection of fine particles.
The Mongolian government agency recorded a 45% increase in the rate of respiratory illness in the past five years (reported in September 2014). Bronchial asthma, chronic obstructive pulmonary disease, and interstitial pneumonia were the most common ailments treated by area hospitals. Levels of premature death, chronic bronchitis, and cardiovascular disease are increasing at a rapid rate.[19]
Cognitive hazards[]
The effects of air pollution and particulate matter on cognitive performance has become an active area of research. A recent longitudinal study in China comparing air pollution and particulate exposure with verbal and mathematics test scores found that accumulative exposure impeded verbal test scores of men and women significantly more than the math scores. The negative impact in verbal reasoning as a result of particulate exposure was more pronounced as people aged and affected men more than women. The level of cognitive decline in verbal reasoning scores was more pronounced in less educated (middle school diploma or lower) subjects.[78] Short term exposure to particulate matter has been linked to short term cognitive decline in otherwise healthy adults.[79]
Particulates also appear to have a role in the pathogenesis of Alzheimer's disease and premature brain aging[80]
Increased death[]
The World Health Organization (WHO) estimated in 2005 that "... fine particulate air pollution (PM(2.5)), causes about 3% of mortality from cardiopulmonary disease, about 5% of mortality from cancer of the trachea, bronchus, and lung, and about 1% of mortality from acute respiratory infections in children under 5 years, worldwide.".[81] A 2011 study concluded that traffic exhaust is the single most serious preventable cause of heart attack in the general public, the cause of 7.4% of all attacks.[82]
Particulate matter studies in Bangkok, Thailand from 2008 indicated a 1.9% increased risk of dying from cardiovascular disease, and 1.0% risk of all disease for every 10 micrograms per cubic meter. Levels averaged 65 in 1996, 68 in 2002, and 52 in 2004. Decreasing levels may be attributed to conversions of diesel to natural gas combustion as well as improved regulations.[83]
Racial disparities[]
There have been many studies linking race to increased proximity to particulate matter, and thus susceptibility to adverse health effects that go in tandem with long term exposure. In a study analyzing the effects of air pollution on racially segregated neighborhoods in the United States, results show that “the proportions of Black residents in a tract was linked to higher asthma rates”.[84] Many scholars link this disproportionality to racial housing segregation and their respective inequalities in “toxic exposures”.[84] This reality is made worse by the finding that “health care occurs in the context of broader historic and contemporary social and economic inequality and persistent racial and ethnic discrimination in many sectors of American life”.[85] Residential proximity to particulate emitting facilities increases exposure to PM 2.5 which is linked to increased morbidity and mortality rates.[86] Multiple studies confirm the burden of PM emissions is higher among non-White and poverty ridden populations,[86] though some say that income does not drive these differences.[87] This correlation between race and housing related health repercussions stems from a longstanding environmental justice problem linked to the practice of historic redlining. An example of these factors contextualized is an area of Southeastern Louisiana, colloquially dubbed ‘Cancer Alley’ for its high concentration of cancer related deaths due to neighboring chemical plants.[88] Cancer Alley being a majority African American community, with the neighborhood nearest to the plant being 90% Black,[88] perpetuates the scientific narrative that Black populations are located disproportionately closer to areas of high PM output than White populations. A 2020 article relates the long term health effects of living in high PM concentrations to increased risk, spread, and mortality rates from the SARS-CoV-2 or COVID-19, and faults a history of racism for this outcome.[88]
Wildfire smoke risk[]
There is an increased risk of particulate exposure in regions where wildfires are persistent. Smoke from wildfires may impact sensitive groups such as the elderly, children, pregnant women, and people with lung, and cardiovascular disease.[89] A study found that in the 2008 wildfire season in California, the particulate matter was much more toxic to human lungs, as increased neutrophil infiltrate, cell influx and edema was observed versus particulate matter from ambient air.[90] Furthermore, particulate matter from wildfires have been linked to be a triggering factor of acute coronary events such as ischemic heart disease.[91] Wildfires also have been associated with increased emergency department visits due to particulate matter exposure, as well as an increased risk of asthma related events.[92][93] Furthermore, a link between PM2.5 from wildfires and increased risk of hospitalizations for cardiopulmonary diseases has been discovered.[94]
Energy industry knowledge and response to adverse health effects[]
Major energy companies understood at least since the 1960s that use of their products causes widespread adverse health effects and death but continued aggressive political lobbying in the United States and elsewhere against clean air regulation and launched major corporate propaganda campaigns to sow doubt regarding the causative link between the burning of fossil fuels and major risks to human life. Internal company memoranda reveal that energy industry scientists and executives knew that air pollutants created by fossil fuels lodge deep in human lung tissue, and cause birth defects in children of oil industry workers. The industry memos acknowledge that automobiles “are by far the greatest sources of air pollution” and also that air pollution causes adverse health effects and lodges toxins, including carcinogens, “deep into the lungs which would otherwise be removed in the throat.”[95]
In response to mounting public concern, the industry eventually created the Global Climate Coalition, an industry lobby group, to derail governments' attempts to regulate air pollution and to create confusion in the public mind about the necessity of such regulation. Similar lobbying and corporate public relations efforts were undertaken by the American Petroleum Institute, a trade association of the oil and gas industry, and the climate change denier private think tank, The Heartland Institute. “The response from fossil-fuel interests has been from the same playbook – first they know, then they scheme, then they deny and then they delay. They’ve fallen back on delay, subtle forms of propaganda and the undermining of regulation,” said Geoffrey Supran, a Harvard University researcher of the history of fossil-fuel companies and climate change. These efforts have been compared, by policy analysts such as Carroll Muffett of the Center for International Environmental Law, to the tobacco industry strategy of lobbying and corporate propaganda campaigns to create doubt regarding the causal connection between cigarette smoking and cancer and to forestall its regulation. In addition, industry-funded advocates, when appointed to senior government positions in the United States, have revised scientific findings showing the deadly effects of air pollution and have rolled back its regulation.[96][97][98]
Effects on vegetation[]
Particulate matter can clog stomatal openings of plants and interfere with photosynthesis functions.[99] In this manner, high particulate matter concentrations in the atmosphere can lead to growth stunting or mortality in some plant species.
Regulation[]
Due to the highly toxic health effects of particulate matter, most governments have created regulations both for the emissions allowed from certain types of pollution sources (motor vehicles, industrial emissions etc.) and for the ambient concentration of particulates. The IARC and WHO designate particulates a Group 1 carcinogen. Particulates are the deadliest form of air pollution due to their ability to penetrate deep into the lungs and blood streams unfiltered, causing respiratory diseases, heart attacks, and premature death.[7] In 2013, the ESCAPE study involving 312,944 people in nine European countries revealed that there was no safe level of particulates and that for every increase of 10 μg/m3 in PM10, the lung cancer rate rose 22%. For PM2.5 there was a 36% increase in lung cancer per 10 μg/m3.[8] In a 2014 meta-analysis of 18 studies globally including the ESCAPE data, for every increase of 10 μg/m3 in PM2.5, the lung cancer rate rose 9%.[100]
Australia[]
| PM10 | PM2.5 | |
|---|---|---|
| Yearly average | 25 μg/m3 | 8 μg/m3 |
| Daily average (24-hour)
Allowed number of exceedences per year |
50 μg/m3
None |
25 μg/m3
None |
Australia has set limits for particulates in the air:[101]
Canada[]
In Canada the standard for particulate matter is set nationally by the federal-provincial Canadian Council of Ministers of the Environment (CCME). Jurisdictions (provinces and territories) may set more stringent standards. The CCME standard for particulate matter 2.5 (PM2.5) as of 2015 is 28 μg/m3 (calculated using the 3-year average of the annual 98th percentile of the daily 24-hr average concentrations) and 10 μg/m3 (3-year average of annual mean). PM2.5 standards will increase in stringency in 2020.[102]
China[]
| PM10 | PM2.5 | |
|---|---|---|
| Yearly average | 70 μg/m3 | 35 μg/m3 |
| Daily average (24-hour)
Allowed number of exceedences per year |
150 μg/m3
None |
75 μg/m3
None |
China has set limits for particulates in the air:[103]
European Union[]
| PM10[a] | PM2.5[b] | |
|---|---|---|
| Yearly average | 40 μg/m3 | 25 μg/m3 |
| Daily average (24-hour)
Allowed number of exceedences per year |
50 μg/m3
35 |
None
None |
The European Union has established the European emission standards, which include limits for particulates in the air:[104]
| European Air Quality Index | Good | Fair | Moderate | Poor | Very poor | Extremely poor |
|---|---|---|---|---|---|---|
| Particles less than 2.5μm (PM2,5) | 0-10 μg/m3 | 10-20 μg/m3 | 20-25 μg/m3 | 25-50 μg/m3 | 50-75 μg/m3 | 75-800 μg/m3 |
| Particles less than 10μm (PM10) | 0-20 μg/m3 | 20-40 μg/m3 | 40-50 μg/m3 | 50-100 μg/m3 | 100-150 μg/m3 | 150-1200 μg/m3 |
Hong Kong[]
| PM10[c] | PM2.5[d] | |
|---|---|---|
| Yearly average | 50 μg/m3 | 35 μg/m3 |
| Daily average (24-hour)
Allowed number of exceedences per year |
100 μg/m3
9 |
75 μg/m3
9 |
Hong Kong has set limits for particulates in the air:[105]
Japan[]
| PM10[106] | PM2.5[e] | |
|---|---|---|
| Yearly average | None | 15 μg/m3 |
| Daily average (24-hour)
Allowed number of exceedences per year |
100 μg/m3
None |
35 μg/m3
None |
Japan has set limits for particulates in the air:[107][108]
South Korea[]
| PM10[f] | PM2.5[g] | |
|---|---|---|
| Yearly average | 50 μg/m3 | 15 μg/m3 |
| Daily average (24-hour)
Allowed number of exceedences per year |
100 μg/m3
None |
35 μg/m3
None |
South Korea has set limits for particulates in the air:[109][110]
Taiwan[]
| PM10 | PM2.5 | |
|---|---|---|
| Yearly average | 65 μg/m3 | 15 μg/m3 |
| Daily average (24-hour)
Allowed number of exceedences per year |
125 μg/m3
None |
35 μg/m3
None |
Taiwan has set limits for particulates in the air:[111][112]
United States[]
| PM10[h][i] | PM2.5[j][k] | |
|---|---|---|
| Yearly average | None | 12 μg/m3 |
| Daily average (24-hour)
Allowed number of exceedences per year |
150 μg/m3
1 |
35 μg/m3
Not applicable [l] |
The United States Environmental Protection Agency (EPA) has set standards for PM10 and PM2.5 concentrations.[114] (See National Ambient Air Quality Standards)

California[]
This section needs to be updated. (September 2016) |

In October 2008, the Department of Toxic Substances Control (DTSC), within the California Environmental Protection Agency, announced its intent to request information regarding analytical test methods, fate and transport in the environment, and other relevant information from manufacturers of carbon nanotubes.[115] DTSC is exercising its authority under the California Health and Safety Code, Chapter 699, sections 57018-57020.[116] These sections were added as a result of the adoption of Assembly Bill AB 289 (2006).[116] They are intended to make information on the fate and transport, detection and analysis, and other information on chemicals more available. The law places the responsibility to provide this information to the Department on those who manufacture or import the chemicals.
On 22 January 2009, a formal information request letter[117] was sent to manufacturers who produce or import carbon nanotubes in California, or who may export carbon nanotubes into the State.[118] This letter constitutes the first formal implementation of the authorities placed into statute by AB 289 and is directed to manufacturers of carbon nanotubes, both industry, and academia within the State, and to manufacturers outside California who export carbon nanotubes to California. This request for information must be met by the manufacturers within one year. DTSC is waiting for the upcoming 22 January 2010 deadline for responses to the data call-in.
The California Nano Industry Network and DTSC hosted a full-day symposium on 16 November 2009 in Sacramento, CA. This symposium provided an opportunity to hear from nanotechnology industry experts and discuss future regulatory considerations in California.[119]
DTSC is expanding the Specific Chemical Information Call-in to members of the nanometal oxides, the latest information can be found on their website.[120]
Colorado[]

This section does not cite any sources. (August 2012) |
Key points in the Colorado Plan include reducing emission levels and solutions by sector. Agriculture, transportation, green electricity, and renewable energy research are the main concepts and goals in this plan. Political programs such as mandatory vehicle emissions testing and the prohibition of smoking indoors are actions taken by local government to create public awareness and participation in cleaner air. The location of Denver next to the Rocky Mountains and wide expanse of plains makes the metro area of Colorado's capital city a likely place for smog and visible air pollution.
Affected areas[]


The most concentrated particulate matter pollution resulting from the burning of fossil fuels by transportation and industrial sources tends to be in densely populated metropolitan areas in developing countries, such as Delhi and Beijing.
Australia[]
PM10 pollution in coal mining areas in Australia such as the Latrobe Valley in Victoria and the Hunter Region in New South Wales significantly increased during 2004 to 2014. Although the increase did not significantly add to non-attainment statistics the rate of increase has risen each year during 2010 to 2014.[121]
China[]
Some cities in Northern China and South Asia have had concentrations above 200 μg/m3 up to a few years ago[when?].[citation needed] The PM levels in Chinese cities have been extreme in recent years[when?], reaching an all-time high in Beijing on 12 January 2013, of 993 μg/m3.[19]
To monitor the air quality of south China, the U.S. Consulate Guangzhou set a PM 2.5 monitor on Shamian Island in Guangzhou and displays readings on its official website and social platforms.[122]
Ulaanbaatar[]
Mongolia's capital city Ulaanbaatar has an annual average mean temperature of about 0 °C, making it the world's coldest capital city. About 40% of the population lives in apartments, 80% of which are supplied with central heating systems from 3 combined heat and power plants. In 2007, the power plants consumed almost 3.4 million tons of coal. The pollution control technology is in poor condition.[citation needed]
The other 60% of the population reside in shantytowns (Ger districts), which have developed due to the country's new market economy and the very cold winter seasons. The poor in these districts cook and heat their wood houses with indoor stoves fueled by wood or coal. The resulting air pollution is characterized by raised sulfur dioxide and nitrogen oxide levels and very high concentrations of airborne particles and particulate matter (PM).[19] Annual seasonal average particulate matter concentrations have been recorded as high as 279 μg/m3 (micrograms per cubic meter).[citation needed] The World Health Organization's recommended annual mean PM10 level is 20 μg/m3,[123] which means that Ulaanbaatar's PM10 annual mean levels are 14 times higher than recommended.[citation needed]
During the winter months, in particular, the air pollution obscures the air, affecting the visibility in the city to such an extent that airplanes on some occasions are prevented from landing at the airport.[124]
In addition to stack emissions, another source unaccounted for in the emission inventory is fly ash from ash ponds, the final disposal place for fly ash that has been collected in settling tanks. Ash ponds are continually eroded by wind during the dry season.[125]
See also[]
- Air quality index
- Air quality law
- Bioaerosol
- Criteria air contaminants
- Environmental impact of the coal industry
- Exercise-induced bronchoconstriction
- Fog
- Global dimming
- List of most polluted cities by particulate matter concentration
- Microplastics
- National Ambient Air Quality Standards
- Non-exhaust emissions
- Pea soup fog
- Respirator
- Scrubber
Notes[]
- ^ since 1 January 2005
- ^ since 1 January 2015
- ^ Since 1 January 2014
- ^ Since 1 January 2014
- ^ since 21 September 2009
- ^ since 4 December 2006
- ^ since 27 March 2018
- ^ daily limit since 1987[113]
- ^ annual limit removed in 2006
- ^ daily limit since 2007
- ^ annual limit since 2012
- ^ 3-year average of annual 98th percentile
References[]
- ^ Seinfeld J, Pandis S (1998). Atmospheric Chemistry and Physics: From Air Pollution to Climate Change (2nd ed.). Hoboken, New Jersey: John Wiley & Sons. p. 97. ISBN 978-0-471-17816-3.
- ^ Plainiotis S, Pericleous KA, Fisher BE, Shier L (January 2010). "Application of Lagrangian particle dispersion models to air quality assessment in the Trans-Manche region of Nord-Pas-de-Calais (France) and Kent (Great Britain)" (PDF). International Journal of Environment and Pollution. 40 (1/2/3): 160–74. doi:10.1504/IJEP.2010.030891.
- ^ Brown JS, Gordon T, Price O, Asgharian B (April 2013). "Thoracic and respirable particle definitions for human health risk assessment". Particle and Fibre Toxicology. 10: 12. doi:10.1186/1743-8977-10-12. PMC 3640939. PMID 23575443.
- ^ US EPA, OAR (19 April 2016). "Particulate Matter (PM) Basics". US EPA. Retrieved 5 October 2019.
- ^ "EHP – Outdoor Particulate Matter Exposure and Lung Cancer: A Systematic Review and Meta-Analysis". ehp.niehs.nih.gov. Archived from the original on 29 May 2016. Retrieved 29 December 2016.
- ^ Wasley A, Heal A, Harvey F, Lainio M (13 June 2019). "Revealed: UK government failing to tackle rise of serious air pollutant". The Guardian. ISSN 0261-3077. Retrieved 14 June 2019.
PM2.5 is probably responsible for somewhere between half and three-quarters of the total harm we derive as humans from air pollution
- ^ Jump up to: a b US EPA, OAR (26 April 2016). "Health and Environmental Effects of Particulate Matter (PM)". US EPA. Retrieved 5 October 2019.
- ^ Jump up to: a b c Raaschou-Nielsen O, Andersen ZJ, Beelen R, Samoli E, Stafoggia M, Weinmayr G, et al. (August 2013). "Air pollution and lung cancer incidence in 17 European cohorts: prospective analyses from the European Study of Cohorts for Air Pollution Effects (ESCAPE)". The Lancet. Oncology. 14 (9): 813–22. doi:10.1016/S1470-2045(13)70279-1. PMID 23849838. Retrieved 10 July 2013.
Particulate matter air pollution contributes to lung cancer incidence in Europe.
- ^ "STATE OF GLOBAL AIR/2018 A SPECIAL REPORT ON GLOBAL EXPOSURE TO AIR POLLUTION AND ITS DISEASE BURDEN" (PDF). Health Effects Institute. 2018.
- ^ "The Weight of Numbers: Air Pollution and PM2.5". Undark. Retrieved 6 September 2018.
- ^ Omidvarborna; et al. (2015). "Recent studies on soot modeling for diesel combustion". Renewable and Sustainable Energy Reviews. 48: 635–647. doi:10.1016/j.rser.2015.04.019.
- ^ Jump up to: a b Hardin M, Kahn R (2 November 2010). "Aerosols and Climate Change".
- ^ "Primary and Secondary Sources of Aerosols: Soil dust". Climate Change 2001: Working Group 1. UNEP. 2001. Archived from the original on 28 February 2008. Retrieved 6 February 2008.
- ^ Perraud V, Bruns EA, Ezell MJ, Johnson SN, Yu Y, Alexander ML, et al. (February 2012). "Nonequilibrium atmospheric secondary organic aerosol formation and growth". Proceedings of the National Academy of Sciences of the United States of America. 109 (8): 2836–41. Bibcode:2012PNAS..109.2836P. doi:10.1073/pnas.1119909109. PMC 3286997. PMID 22308444.
- ^ "Primary and Secondary Sources of Aerosols: Sea salt". Climate Change 2001: Working Group 1. UNEP. 2001. Archived from the original on 28 February 2008. Retrieved 6 February 2008.
- ^ Int Panis LL (2008). "The Effect of Changing Background Emissions on External Cost Estimates for Secondary Particulates". Open Environmental Sciences. 2: 47–53. doi:10.2174/1876325100802010047.
- ^ "Primary and Secondary Sources of Aerosols: Primary biogenic aerosols". Climate Change 2001: Working Group 1. UNEP. 2001. Archived from the original on 28 February 2008. Retrieved 6 February 2008.
- ^ Felicity Barringer (18 February 2012). "Scientists Find New Dangers in Tiny but Pervasive Particles in Air Pollution". The New York Times. Retrieved 19 February 2012.
- ^ Jump up to: a b c d "Mongolia: Air Pollution in Ulaanbaatar – Initial Assessment of Current Situations and Effects of Abatement Measures" (PDF). The World Bank. 2010. Archived from the original (PDF) on 19 September 2016.
- ^ Click for more detail.
- ^ Click for more detail.
- ^ Goswami A, Barman J, Rajput K, Lakhlani HN (2013). "Behaviour Study of Particulate Matter and Chemical Composition with Different Combustion Strategies". SAE Technical Paper Series. 1. doi:10.4271/2013-01-2741. Retrieved 17 June 2016.
- ^ "Effect Of Particulate Matter On Plants Climate, Ecosystem and Human Health" (PDF). www.ijates.com. April 2014. Retrieved 3 February 2016.
- ^ "Learn about electrostatic pm2.5 filters used with reusable cloth masks". www.purakamasks.com. Retrieved 4 January 2021.
- ^ Dominick DalSanto (February 2011). "The Encyclopedia of Dust Collection".
- ^ Jump up to: a b Haywood J, Olivier B (2000). "Estimates of the direct and indirect radiative forcing due to tropospheric aerosols: A review". Reviews of Geophysics. 38 (4): 513. Bibcode:2000RvGeo..38..513H. doi:10.1029/1999RG000078. Archived from the original on 23 February 2013. Retrieved 11 August 2012.
- ^ Jump up to: a b Twomey S (1977). "The influence of pollution on the shortwave albedo of clouds". Journal of the Atmospheric Sciences. 34 (7): 1149–1152. Bibcode:1977JAtS...34.1149T. doi:10.1175/1520-0469(1977)034<1149:TIOPOT>2.0.CO;2.
- ^ Jump up to: a b c d e f Forster P, Ramaswamy V, Artaxo P, Berntsen T, Betts R, Fahey DW, Haywood J, et al. (October 2007). "Contribution of Working Group I to the Fourth Assessment Report of the Intergovernmental Panel on Climate Change in Climate Change 2007: The Physical Science Basis". In Solomon S, Qin D, Manning M, Chen Z, Marquis M, Averyt KB, Tignor M, Miller HL (eds.). Changes in Atmospheric Constituents and in Radiative Forcing. Cambridge, United Kingdom and New York, NY, USA: Cambridge University Press. pp. 129–234.
- ^ "6.7.8 Discussion of Uncertainties". IPCC Third Assessment Report – Climate Change 2001. Archived from the original on 28 February 2002. Retrieved 14 July 2012.
- ^ Charlson RJ, Schwartz SE, Hales JM, Cess RD, Coakley JA, Hansen JE, Hofmann DJ (January 1992). "Climate forcing by anthropogenic aerosols". Science. 255 (5043): 423–30. Bibcode:1992Sci...255..423C. doi:10.1126/science.255.5043.423. PMID 17842894. S2CID 26740611.
- ^ Ackerman AS, Toon OB, Taylor JP, Johnson DW, Hobbs PV, Ferek RJ (2000). "Effects of Aerosols on Cloud Albedo : Evaluation of Twomey's Parameterization of Cloud Susceptibility Using Measurements of Ship Tracks". Journal of the Atmospheric Sciences. 57 (16): 2684–2695. Bibcode:2000JAtS...57.2684A. doi:10.1175/1520-0469(2000)057<2684:EOAOCA>2.0.CO;2. ISSN 1520-0469.
- ^ Kaufman YJ, Fraser RS (1997). "The Effect of Smoke Particles on Clouds and Climate Forcing". Science. 277 (5332): 1636–1639. doi:10.1126/science.277.5332.1636.
- ^ Ferek RJ, Garrett T, Hobbs PV, Strader S, Johnson D, Taylor JP, Nielsen K, Ackerman AS, Kogan Y, Liu Q, Albrecht BA, et al. (2000). "Drizzle Suppression in Ship Tracks". Journal of the Atmospheric Sciences. 57 (16): 2707–2728. Bibcode:2000JAtS...57.2707F. doi:10.1175/1520-0469(2000)057<2707:DSIST>2.0.CO;2. hdl:10945/46780.
- ^ Rosenfeld D (1999). "TRMM observed first direct evidence of smoke from forest fires inhibiting rainfall". Geophysical Research Letters. 26 (20): 3105–3108. Bibcode:1999GeoRL..26.3105R. doi:10.1029/1999GL006066.
- ^ Jump up to: a b Hansen J, Sato M, Ruedy R (1997). "Radiative forcing and climate response". Journal of Geophysical Research. 102 (D6): 6831–6864. Bibcode:1997JGR...102.6831H. doi:10.1029/96JD03436.
- ^ Ackerman AS, Toon OB, Stevens DE, Heymsfield AJ, Ramanathan V, Welton EJ (May 2000). "Reduction of tropical cloudiness by soot". Science (Submitted manuscript). 288 (5468): 1042–7. Bibcode:2000Sci...288.1042A. doi:10.1126/science.288.5468.1042. PMID 10807573.
- ^ Koren I, Kaufman YJ, Remer LA, Martins JV (February 2004). "Measurement of the effect of Amazon smoke on inhibition of cloud formation". Science. 303 (5662): 1342–5. Bibcode:2004Sci...303.1342K. doi:10.1126/science.1089424. PMID 14988557. S2CID 37347993.
- ^ "6.7.2 Sulphate Aerosol". IPCC Third Assessment Report, Working Group I: The Scientific Basis. IPPCC. 2001. Archived from the original on 20 June 2002. Retrieved 10 August 2012.
- ^ Bond, T. C. (2013). "Bounding the role of black carbon in the climate system: A scientific assessment". Journal of Geophysical Research: Atmospheres. 118 (11): 5380–5552. Bibcode:2013JGRD..118.5380B. doi:10.1002/jgrd.50171.
- ^ "1600 Eruption Caused Global Disruption" Archived 15 February 2011 at the Wayback Machine, Geology Times, 25 April 2008, accessed 13 November 2010
- ^ Andrea Thompson, "Volcano in 1600 caused global disruption", NBC News, 5 May 2008, accessed 13 November 2010
- ^ "The 1600 eruption of Huaynaputina in Peru caused global disruption" Archived 28 April 2010 at the Wayback Machine, Science Centric
- ^ McCormick MP, Thomason LW, Trepte CR (1995). "Atmospheric effects of the Mt Pinatubo eruption" (PDF). Nature. 373 (6513): 399–404. Bibcode:1995Natur.373..399M. doi:10.1038/373399a0. S2CID 46437912. Archived from the original (PDF) on 15 February 2010.
- ^ Stowe LL, Carey RM, Pellegrino PP (1992). "Monitoring the Mt. Pinatubo aerosol layer with NOAA/11 AVHRR data". Geophysical Research Letters (Submitted manuscript). 19 (2): 159–162. Bibcode:1992GeoRL..19..159S. doi:10.1029/91GL02958.
- ^ Sid Perkins (4 March 2013). "Earth Not So Hot Thanks to Volcanoes". Science Now. Archived from the original on 7 March 2013. Retrieved 5 March 2013.
- ^ Neely III RR, Toon OB, Solomon S, Vernier JP, Alvarez C, English JM, Rosenlof KH, Mills MJ, Bardeen CG, Daniel JS, Thayer JP (2013). "Recent anthropogenic increases in SO2 from Asia have minimal impact on stratospheric aerosol". Geophysical Research Letters. 40 (5): 999–1004. Bibcode:2013GeoRL..40..999N. doi:10.1002/grl.50263. hdl:1721.1/85851.
moderate volcanic eruptions, rather than anthropogenic influences, are the primary source of the observed increases in stratospheric aerosol.
- ^ Jump up to: a b Chung CE, Ramanathan V (2006). "Weakening of North Indian SST Gradients and the Monsoon Rainfall in India and the Sahel". Journal of Climate. 19 (10): 2036–2045. Bibcode:2006JCli...19.2036C. doi:10.1175/JCLI3820.1. S2CID 10435613.
- ^ Pollutants and Their Effect on the Water and Radiation Budgets Archived 16 December 2008 at the Wayback Machine
- ^ Australian rainfall and Asian aerosols Archived 16 June 2012 at the Wayback Machine
- ^ Region 4: Laboratory and Field Operations – PM 2.5 (2008).PM 2.5 Objectives and History. U.S. Environmental Protection Agency.
- ^ J.R. Balmes, J.M. Fine, D. Sheppard Symptomatic bronchoconstriction after short-term inhalation of sulfur dioxide Am. Rev. Respir. Dis., 136 (1987), p. 1117
- ^ Nieuwenhuijsen, M.J. (2003). Exposure Assessment in Occupational and Environmental Epidemiology. London: Oxford University Press.
- ^ "Pollution Particles Lead to Higher Heart Attack Risk". Bloomberg L.P. 17 January 2008. Archived from the original on 29 June 2011.
- ^ Lippmann, M., Cohen, B.S., Schlesinger, R.S. (2003). Environmental Health Science. New York: Oxford University Press
- ^ Chest Journal, 1 Feb. 2019, "Air Pollution and Noncommunicable Diseases, A Review by the Forum of International Respiratory Societies’ Environmental Committee, Part 1: The Damaging Effects of Air Pollution", vol. 155, issue 2, pp. 409-416
- ^ The Guardian, 17 May 2019, [https://www.theguardian.com/environment/ng-interactive/2019/may/17/air-pollution-may-be-damaging-every-organ-and-cell-in-the-body-finds-global-review# "Revealed: Air Pollution May Be Damaging ‘Every Organ in The Body’ Exclusive: Comprehensive Analysis Finds Harm from Head to Toe, Including Dementia, Heart and Lung Disease, Fertility Problems and Reduced Intelligence"]
- ^ Cohen AJ, Ross Anderson H, Ostro B, Pandey KD, Krzyzanowski M, Künzli N, et al. (2005). "The global burden of disease due to outdoor air pollution". Journal of Toxicology and Environmental Health. Part A. 68 (13–14): 1301–7. doi:10.1080/15287390590936166. PMID 16024504. S2CID 23814778.
- ^ "Air Pollution & Cardiovascular Disease". National Institute of Environmental Health Sciences. Archived from the original on 14 May 2011.
- ^ Lave LB, Seskin EP (1973). "An Analysis of the Association Between U.S. Mortality and Air Pollution". Journal of the American Statistical Association. 68 (342): 342. doi:10.1080/01621459.1973.10482421.
- ^ Mokdad AH, Marks JS, Stroup DF, Gerberding JL (March 2004). "Actual causes of death in the United States, 2000". JAMA. 291 (10): 1238–45. doi:10.1001/jama.291.10.1238. PMID 15010446. S2CID 14589790.
- ^ Jump up to: a b European Environment Agency (2005). "Spatial assessment of PM10 and ozone concentrations in Europe". EEA Technical Report. European Environment Agency (EEA). doi:10.2800/165.
- ^ Lim SS, Vos T, Flaxman AD, Danaei G, Shibuya K, Adair-Rohani H, et al. (December 2012). "A comparative risk assessment of burden of disease and injury attributable to 67 risk factors and risk factor clusters in 21 regions, 1990-2010: a systematic analysis for the Global Burden of Disease Study 2010". Lancet. 380 (9859): 2224–60. doi:10.1016/s0140-6736(12)61766-8. PMC 4156511. PMID 23245609.
- ^ Laden, F., Neas, L.M., Dockery, D.W. and Schwartz, J., 2000. Association of fine particulate matter from different sources with daily mortality in six US cities. Environmental health perspectives, 108(10), p.941.
- ^ National Library of Medicine, National Center for Biotechnology Information, H. Ozkaynak, G. D. Thurston "Associations between 1980 U.S. Mortality Rates and Alternative Measures of Airborne Particle Concentration", Risk Anal. 1987 Dec; 7(4):449-61
- ^ The Guardian, 17 Feb. 2021, "Air Pollution Significantly Raises Risk of Infertility, Study Finds; Exclusive: With 30% of Infertility Unexplained, Pollution Could Be an ‘Unignorable’ Risk Factor, Scientists Say"
- ^ Sapkota A, Chelikowsky AP, Nachman KE, Cohen AJ, Ritz B (1 December 2012). "Exposure to particulate matter and adverse birth outcomes: a comprehensive review and meta-analysis". Air Quality, Atmosphere & Health. 5 (4): 369–381. doi:10.1007/s11869-010-0106-3. ISSN 1873-9318. S2CID 95781433.
- ^ Zhang M, Mueller NT, Wang H, Hong X, Appel LJ, Wang X (July 2018). "Maternal Exposure to Ambient Particulate Matter ≤2.5 μm During Pregnancy and the Risk for High Blood Pressure in Childhood". Hypertension. 72 (1): 194–201. doi:10.1161/HYPERTENSIONAHA.117.10944. PMC 6002908. PMID 29760154.
- ^ Jump up to: a b c Sacks J. "2009 Final Report: Integrated Science Assessment for Particulate Matter". US EPA National Center for Environmental Assessment, Research Triangle Park Nc, Environmental Media Assessment Group. Retrieved 31 March 2017.
- ^ Erickson AC, Arbour L (26 November 2014). "The shared pathoetiological effects of particulate air pollution and the social environment on fetal-placental development". Journal of Environmental and Public Health. 2014: 901017. doi:10.1155/2014/901017. PMC 4276595. PMID 25574176.
- ^ Lee PC, Talbott EO, Roberts JM, Catov JM, Bilonick RA, Stone RA, et al. (August 2012). "Ambient air pollution exposure and blood pressure changes during pregnancy". Environmental Research. 117: 46–53. Bibcode:2012ER....117...46L. doi:10.1016/j.envres.2012.05.011. PMC 3656658. PMID 22835955.
- ^ Woodruff TJ, Parker JD, Darrow LA, Slama R, Bell ML, Choi H, et al. (April 2009). "Methodological issues in studies of air pollution and reproductive health". Environmental Research. 109 (3): 311–20. Bibcode:2009ER....109..311W. doi:10.1016/j.envres.2008.12.012. PMC 6615486. PMID 19215915.
- ^ Byrne CD, Phillips DI (November 2000). "Fetal origins of adult disease: epidemiology and mechanisms". Journal of Clinical Pathology. 53 (11): 822–8. doi:10.1136/jcp.53.11.822. PMC 1731115. PMID 11127263.
- ^ Barker DJ (November 1990). "The fetal and infant origins of adult disease". BMJ. 301 (6761): 1111. doi:10.1136/bmj.301.6761.1111. PMC 1664286. PMID 2252919.
- ^ Pope CA, Burnett RT, Thun MJ, Calle EE, Krewski D, Ito K, Thurston GD (March 2002). "Lung cancer, cardiopulmonary mortality, and long-term exposure to fine particulate air pollution". JAMA. 287 (9): 1132–41. doi:10.1001/jama.287.9.1132. PMC 4037163. PMID 11879110.
- ^ EU's PM2.5 Limit Festering: New Study Linked PM with Heart Attack Cesaroni G, Forastiere F, Stafoggia M, Andersen ZJ, Badaloni C, Beelen R, et al. (January 2014). "Long term exposure to ambient air pollution and incidence of acute coronary events: prospective cohort study and meta-analysis in 11 European cohorts from the ESCAPE Project". BMJ. 348: f7412. doi:10.1136/bmj.f7412. PMC 3898420. PMID 24452269.
- ^ Hussey SJ, Purves J, Allcock N, Fernandes VE, Monks PS, Ketley JM, et al. (May 2017). "Air pollution alters Staphylococcus aureus and Streptococcus pneumoniae biofilms, antibiotic tolerance and colonisation" (PDF). Environmental Microbiology. 19 (5): 1868–1880. doi:10.1111/1462-2920.13686. PMC 6849702. PMID 28195384.
- ^ Newswise: National Study Examines Health Risks of Coarse Particle Pollution
- ^ Zhang X, Chen X, Zhang X (September 2018). "The impact of exposure to air pollution on cognitive performance". Proceedings of the National Academy of Sciences of the United States of America. 115 (37): 9193–9197. doi:10.1073/pnas.1809474115. PMC 6140474. PMID 30150383.
- ^ Shehab MA, Pope FD (June 2019). "Effects of short-term exposure to particulate matter air pollution on cognitive performance". Scientific Reports. 9 (1): 8237. Bibcode:2019NatSR...9.8237S. doi:10.1038/s41598-019-44561-0. PMC 6546704. PMID 31160655.
- ^ Translational Psychiatry, 31 Jan. 2017, Cacciottolo, M., Wang, X., Driscoll, I. et al. Particulate Air Pollutants, APOE Alleles and Their Contributions to Cognitive Impairment in Older Women and to Amyloidogenesis in Experimental Models" Transl Psychiatry 7, e1022 (2017)
- ^ Cohen AJ, Ross Anderson H, Ostro B, Pandey KD, Krzyzanowski M, Künzli N, et al. (2005). "The global burden of disease due to outdoor air pollution". Journal of Toxicology and Environmental Health. Part A. 68 (13–14): 1301–7. doi:10.1080/15287390590936166. PMID 16024504. S2CID 23814778.
- ^ Nawrot TS, Perez L, Künzli N, Munters E, Nemery B (February 2011). "Public health importance of triggers of myocardial infarction: a comparative risk assessment". Lancet. 377 (9767): 732–40. doi:10.1016/S0140-6736(10)62296-9. PMID 21353301. S2CID 20168936. "Taking into account the OR and the prevalences of exposure, the highest PAF was estimated for traffic exposure (7.4%)... " :"... [O]dds ratios and frequencies of each trigger were used to compute population-attributable fractions (PAFs), which estimate the proportion of cases that could be avoided if a risk factor were removed. PAFs depend not only on the risk factor strength at the individual level but also on its frequency in the community. ... [T]he exposure prevalence for triggers in the relevant control time window ranged from 0.04% for cocaine use to 100% for air pollution. ... Taking into account the OR and the prevalences of exposure, the highest PAF was estimated for traffic exposure (7.4%) ...
- ^ Health Effects of Air Pollution in Bangkok Archived 17 December 2008 at the Wayback Machine
- ^ Jump up to: a b Smiley, Kevin T. (2019). "Racial and Environmental Inequalities in Spatial Patterns in Asthma Prevalence in the US South". Southeastern Geographer. 59 (4): 389–402. doi:10.1353/sgo.2019.0031. ISSN 1549-6929.
- ^ "Erratum: Eur. Phys. J. C.22, 695–705 (2002) – DOI 10.1007/s100520100827 Published online: 7 December 2001". The European Physical Journal C. 24 (4): 665–666. August 2002. Bibcode:2002EPJC...24..665.. doi:10.1007/s10052-002-0987-x. ISSN 1434-6044.
- ^ Jump up to: a b Mikati, Ihab; Benson, Adam F.; Luben, Thomas J.; Sacks, Jason D.; Richmond-Bryant, Jennifer (22 February 2018). "Disparities in Distribution of Particulate Matter Emission Sources by Race and Poverty Status". American Journal of Public Health. 108 (4): 480–485. doi:10.2105/AJPH.2017.304297. ISSN 0090-0036. PMC 5844406. PMID 29470121.
- ^ "Urban Air Pollution and Health Inequities: A Workshop Report". Environmental Health Perspectives. 109 (s3): 357–374. 1 June 2001. doi:10.1289/ehp.01109s3357. ISSN 0091-6765.
- ^ Jump up to: a b c "Racism turned their neighborhood into 'Cancer Alley.' Now they're dying from COVID-19". www.usatoday.com. Retrieved 11 February 2021.
- ^ US EPA, OAR (12 November 2018). "How Smoke from Fires Can Affect Your Health". US EPA. Retrieved 26 November 2020.
- ^ Wegesser TC, Pinkerton KE, Last JA (June 2009). "California wildfires of 2008: coarse and fine particulate matter toxicity". Environmental Health Perspectives. 117 (6): 893–7. doi:10.1289/ehp.0800166. PMC 2702402. PMID 19590679.
- ^ Haikerwal A, Akram M, Del Monaco A, Smith K, Sim MR, Meyer M, et al. (July 2015). "Impact of Fine Particulate Matter (PM2.5) Exposure During Wildfires on Cardiovascular Health Outcomes". Journal of the American Heart Association. 4 (7): e001653. doi:10.1161/JAHA.114.001653. PMC 4608063. PMID 26178402.
- ^ Reid CE, Considine EM, Watson GL, Telesca D, Pfister GG, Jerrett M (August 2019). "Associations between respiratory health and ozone and fine particulate matter during a wildfire event". Environment International. 129: 291–298. doi:10.1016/j.envint.2019.04.033. PMID 31146163.
- ^ Haikerwal A, Akram M, Sim MR, Meyer M, Abramson MJ, Dennekamp M (January 2016). "Fine particulate matter (PM2.5 ) exposure during a prolonged wildfire period and emergency department visits for asthma". Respirology. 21 (1): 88–94. doi:10.1111/resp.12613. PMID 26346113. S2CID 22910313.
- ^ DeFlorio-Barker S, Crooks J, Reyes J, Rappold AG (March 2019). "Cardiopulmonary Effects of Fine Particulate Matter Exposure among Older Adults, during Wildfire and Non-Wildfire Periods, in the United States 2008-2010". Environmental Health Perspectives. 127 (3): 37006. doi:10.1289/EHP3860. PMC 6768318. PMID 30875246.
- ^ The Guardian, 18 Mar. 2021 "Oil Firms Knew Decades Ago Fossil Fuels Posed Grave Health Risks, Riles Reveal; Exclusive: Documents Seen by Guardian Show Companies Fought Clean-Air Rules Despite Being Aware of Harm Caused by Air Pollution"
- ^ The Guardian, 18 Mar. 2021 "Oil Firms Knew Decades Ago Fossil Fuels Posed Grave Health Risks, Riles Reveal; Exclusive: Documents Seen by Guardian Show Companies Fought Clean-Air Rules Despite Being Aware of Harm Caused by Air Pollution"
- ^ The Guardian "75 Ways Trump Made America Dirtier and the Planet Warmer: In the Past Four Years, Trump has Shredded Environmental Protections for American Lands, Animals and People"
- ^ Union of Concerned Scientists, 27 Apr. 2020 "Oil Industry Ghostwrites Trump's Deadly Anti-Environmental Policies"
- ^ Hogan CM (2010). Emily Monosson and C. Cleveland (ed.). "Abiotic factor". Encyclopedia of Earth. National Council for Science and the Environment.
- ^ Hamra GB, Guha N, Cohen A, Laden F, Raaschou-Nielsen O, Samet JM, et al. (September 2014). "Outdoor particulate matter exposure and lung cancer: a systematic review and meta-analysis". Environmental Health Perspectives. 122 (9): 906–11. doi:10.1289/ehp.1408092. PMC 4154221. PMID 24911630.
- ^ Department of the Environment (25 February 2016). "National Environment Protection (Ambient Air Quality) Measure". Federal Register of Legislation. Retrieved 16 November 2018.
- ^ "Canadian Ambient Air Quality Standards (CAAQS) for Fine Particulate Matter (PM2.5) and Ozone" (PDF).
- ^ http://kjs.mep.gov.cn/hjbhbz/bzwb/dqhjbh/dqhjzlbz/201203/W020120410330232398521.pdf
- ^ "Air Quality Standards – Environment – European Commission". Ec.europa.eu. Retrieved 1 February 2015.
- ^ "Air Quality Objectives". Environmental Protection Department, Hong Kong. 19 December 2012. Retrieved 27 July 2013.
- ^ Referred to as Suspended Particulate Matter
- ^ "微小粒子状物質(PM2.5)対策|東京都環境局 大気・騒音・振動・悪臭対策". Kankyo.metro.tokyo.jp. Archived from the original on 28 February 2015. Retrieved 1 February 2015.
- ^ "Air Quality Standards" (PDF).
- ^ http://www.airkorea.or.kr/
- ^ "미세먼지 환경기준 선진국 수준 강화...'나쁨' 4배 늘 듯".
- ^ "細���浮微粒管制". Environmental Protection Administration, ROC. Retrieved 16 November 2015.
- ^ FEATURE: Air pollution reason for concern: groups – Taipei Times
- ^ "Environmental Protection Agency – Particulate Matter (PM-10)". Epa.gov. 28 June 2006. Retrieved 1 February 2015.
- ^ "Pm Naaqs | Us Epa". Epa.gov. Retrieved 1 February 2015.
- ^ "Nanotechnology web page". Department of Toxic Substances Control. 2008. Archived from the original on 1 January 2010.
- ^ Jump up to: a b "Chemical Information Call-In web page". Department of Toxic Substances Control. 2008. Archived from the original on 18 March 2010. Retrieved 28 December 2009.
- ^ Wong J (22 January 2009), Call in letter (PDF), archived from the original (PDF) on 27 January 2017, retrieved 28 December 2009
- ^ "Contact List for CNT January 22 & 26 2009 Document" (PDF). Archived from the original (PDF) on 31 January 2017. Retrieved 28 December 2009.
- ^ "Archived DTSC Nanotechnology Symposia". Department of Toxic Substances Control. Archived from the original on 1 January 2010.
- ^ dtsc.ca.gov Archived 1 January 2010 at the Wayback Machine
- ^ Oliver Milman (1 April 2015). "Call for action on pollution as emissions linked to respiratory illnesses double". The Guardian. Retrieved 3 April 2015.
emissions of a key pollutant linked to respiratory illness have doubled over the past five years
- ^ Consulate General of the United States of America Guangzhou, China (n.d.). "U.S. Consulate Air Quality Monitor and StateAir". U.S. Department of State. Archived from the original on 1 July 2011. Retrieved 24 December 2014.
- ^ WHO | Ambient (outdoor) air quality and health
- ^ https://www.environmental-protection.org.uk/policy-areas/air-quality/air-pollution-and-transport/aviation-pollution/
- ^ https://www.fhwa.dot.gov/pavement/recycling/fach01.cfm
Further reading[]
- Voiland, Adam. "Aerosols: Tiny Particles, Big Impact." NASA, 2 Nov. 2010, https://earthobservatory.nasa.gov/features/Aerosols
- The Intergovernmental Panel on Climate Change (the principal international scientific body on climate change) chapter on atmospheric aerosols and their radiative effects
- InsideEPA.com, Study Links Air Toxics To Heart Disease In Mice Amid EPA Controversy[dead link]
- Preining, Othmar and E. James Davis (eds.), "History of Aerosol Science," Österreichische Akademie der Wissenschaften, ISBN 3-7001-2915-7 (Pbk.)
- G Invernizzi et al., Particulate matter from tobacco versus diesel car exhaust: an educational perspective. Tobacco Control 13, S.219–221 (2004)
- "The Weight of Numbers: Air Pollution and PM2.5". Undark Magazine. Retrieved 27 September 2019.
- JEFF CHARLTON Pandemic planning: a review of respirator and mask protection levels.
- Hinds, William C., Aerosol Technology: Properties, Behavior, and Measurement of Airborne Particles, Wiley-Interscience, ISBN 0-471-19410-7
- Zangari, Shelby et al., Air quality changes in New York City during the COVID-19 pandemic. Science of The Total Environment 742 (2020)
- NARSTO (2004) Particulate Matter Science for Policy Makers: A NARSTO Assessment. P. McMurry, M. Shepherd, and J. Vickery, eds. Cambridge University Press, Cambridge, England. ISBN 0 52 184287 5.
External links[]
| Look up particulates in Wiktionary, the free dictionary. |
- Current global map of PM1 distribution
- Current global map of PM1 and PM2.5 distribution
- Current global map of PM1, PM2.5 and PM10 distribution
| show Authority control |
|---|
| hide Pollution | |
|---|---|
| Air |
|
| Electromagnetic |
|
| Natural |
|
| Noise |
|
| Radiation |
|
| Soil |
|
| Soild waste |
|
| Space |
|
| Thermal |
|
| Visual |
|
| Water |
|
| Topics |
|
| Responses |
|
| Treaties |
|
| Lists | |
| show Anthropogenic effects on the environment |
|---|
- Particulates
- Aerosols
- Pollutants
- Visibility
- Air pollution
- Climate forcing
- Pollution