Plymouth City Council elections
Plymouth is a unitary authority in Devon, England. Until 1 April 1998 it was a non-metropolitan district.
Political control[]
Since the first election to the council in 1973 political control of the council has been held by the following parties:[1][2]
Non-metropolitan district[]
| Election | Labour | Conservatives | SDP–Liberal Alliance | Independent Conservative | Party in control | |
|---|---|---|---|---|---|---|
| 1973 | 29 | 37 | Conservative | |||
| 1976 | 27 | 39 | ||||
| 1979 | 26 | 33 | 1 | |||
| 1983 | 23 | 34 | 3 | |||
| 1987 | 19 | 31 | 10 | |||
| 1991 | 41 | 19 | Labour | |||
| 1995 | 54 | 6 | ||||
Unitary authority[]
Election summary[]
After 2003, the council was elected in thirds. The number of councillors for each party following each election is listed in the table.
| Election | Labour | Conservatives | Liberal Democrats | UKIP | Independent |
|---|---|---|---|---|---|
| 1997 | 47 | 13 | |||
| 2000 | 38 | 22 | |||
| 2003 | 36 | 18 | 3 | ||
| 2004 | 35 | 19 | 2 | ||
| 2006 | 28 | 25 | 3 | 1 | |
| 2007 | 26 | 31 | |||
| 2008 | 20 | 37 | |||
| 2010 | 20 | 36 | 1 | ||
| 2011 | 25 | 31 | 1 | ||
| 2012 | 31 | 26 | |||
| 2014 | 30 | 24 | 3 | ||
| 2015 | 28 | 26 | 3 | ||
| 2016 | 27 | 27 | 3 | ||
| 2018 | 31 | 26 | |||
| 2019 | 31 | 25 | 1 | ||
| 2021 | 24 | 26 | 7 |
Party control[]
| Party in control | Years | |
|---|---|---|
| Labour | 1997—2000 | |
| Conservative | 2000—2003 | |
| Labour | 2003—2006 | |
| No overall control[3][4] | 2006 (4 May - 22 June) | |
| Labour | 2006—2007 | |
| Conservative | 2007—2012 | |
| Labour | 2012—2015 | |
| No overall control | 2015—2017 | |
| Conservative[5] | 2017—2018 | |
| Labour | 2018—2021 | |
| No overall control | 2021–present | |
Council elections[]
Non-metropolitan district elections[]
- 1973 Plymouth City Council election
- 1976 Plymouth City Council election
- 1979 Plymouth City Council election (New ward boundaries)[6]
- 1983 Plymouth City Council election
- 1987 Plymouth City Council election (City boundary changes took place but the number of seats remained the same)[7]
- 1991 Plymouth City Council election
- 1995 Plymouth City Council election
Unitary authority elections[]
- 1997 Plymouth City Council election
- 2000 Plymouth City Council election
- 2003 Plymouth City Council election (New ward boundaries reduced the number of seats by 3)[8][9][10]
- 2004 Plymouth City Council election
- 2006 Plymouth City Council election
- 2007 Plymouth City Council election
- 2008 Plymouth City Council election
- 2010 Plymouth City Council election
- 2011 Plymouth City Council election
- 2012 Plymouth City Council election
- 2014 Plymouth City Council election
- 2015 Plymouth City Council election
- 2016 Plymouth City Council election[11][12]
- 2018 Plymouth City Council election
- 2019 Plymouth City Council election
- 2021 Plymouth City Council election
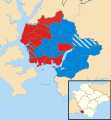
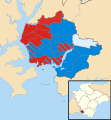
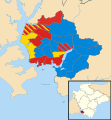
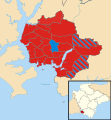
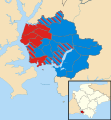
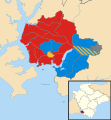
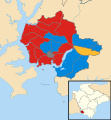
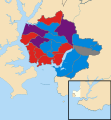
Result maps[]
1979 results map
1983 results map
1987 results map

1991 results map
1995 results map

1997 results map
2000 results map
2003 results map
2004 results map

2006 results map

2007 results map

2008 results map

2010 results map

2011 results map

2012 results map
2014 results map

2015 results map

2016 results map

2018 results map

2019 results map

2021 results map
Changes between elections[]
Unitary authority[]
| Party | Candidate | Votes | % | ±% | |
|---|---|---|---|---|---|
| Labour | 1,328 | 61.1 | -11.3 | ||
| Conservative | 420 | 19.3 | -8.3 | ||
| Liberal Democrats | 344 | 15.8 | +15.8 | ||
| Independent | 67 | 3.1 | +3.1 | ||
| Independent Democrat | 14 | 0.6 | +0.6 | ||
| Majority | 908 | 41.8 | |||
| Turnout | 2,173 | 23.0 | |||
| Labour hold | Swing | ||||
| Party | Candidate | Votes | % | ±% | |
|---|---|---|---|---|---|
| Labour | 1,017 | 65.5 | +4.8 | ||
| Conservative | 307 | 19.8 | -2.3 | ||
| Liberal Democrats | 173 | 11.1 | +11.1 | ||
| Independent Democrat | 56 | 3.6 | -13.6 | ||
| Majority | 710 | 45.7 | |||
| Turnout | 1,553 | ||||
| Labour hold | Swing | ||||
| Party | Candidate | Votes | % | ±% | |
|---|---|---|---|---|---|
| Labour | 1,179 | ||||
| Labour | 1,101 | ||||
| Liberal Democrats | 590 | ||||
| Liberal Democrats | 566 | ||||
| Conservative | 464 | ||||
| Conservative | 449 | ||||
| Green | 120 | ||||
| Green | 119 | ||||
| UKIP | 51 | ||||
| Turnout | 4,639 | 29.9 | |||
| Labour hold | Swing | ||||
| Labour gain from Conservative | Swing | ||||
| Party | Candidate | Votes | % | ±% | |
|---|---|---|---|---|---|
| Labour | 1,253 | 55.7 | +8.9 | ||
| Conservative | 715 | 31.8 | -6.7 | ||
| Liberal Democrats | 282 | 12.5 | +0.0 | ||
| Majority | 538 | 23.9 | |||
| Turnout | 2,250 | 25.5 | |||
| Labour hold | Swing | ||||
2003 boundaries[]
| Party | Candidate | Votes | % | ±% | |
|---|---|---|---|---|---|
| Labour | James Kirk | 1,624 | 43.3 | +3.9 | |
| Conservative | Brenda Brookshaw | 1,517 | 40.5 | +0.3 | |
| Liberal Democrats | Terrance O'Connor | 214 | 5.7 | -14.7 | |
| BNP | Liam Birch | 200 | 5.3 | +5.3 | |
| UKIP | Thomas Williams | 139 | 3.7 | +3.7 | |
| Green | Raymond Tuohy | 53 | 1.4 | +1.4 | |
| Majority | 107 | 2.8 | |||
| Turnout | 3,747 | 40.4 | |||
| Labour hold | Swing | ||||
| Party | Candidate | Votes | % | ±% | |
|---|---|---|---|---|---|
| Labour | Tina Tuohy | 1,243 | 44.0 | +2.7 | |
| Conservative | Nigel Churchill | 676 | 23.9 | -15.7 | |
| UKIP | Andrew Leigh | 442 | 15.6 | +15.6 | |
| Independent | Margaret Storer | 204 | 7.2 | +7.2 | |
| Liberal Democrats | Rebecca Trimnell | 181 | 6.4 | -6.8 | |
| BNP | Adrian Romilly | 82 | 2.9 | +2.9 | |
| Majority | 567 | 20.1 | |||
| Turnout | 2,828 | 29.0 | |||
| Labour hold | Swing | ||||
In September 2017, the three UKIP councillors elected in 2014, Christopher Storer (Ham), John Riley (Honicknowle) and Maddie Bridgeman (Moor View), moved to the Conservatives.[19]
| Party | Candidate | Votes | % | ±% | |
|---|---|---|---|---|---|
| Labour | Jonny Morris | 1,247 | 43.1 | -8.2 | |
| UKIP | Peter David Berrow | 764 | 26.4 | +4.6 | |
| Conservative | David Alexander Downie | 487 | 16.8 | -10.0 | |
| Independent | Dennis Law Silverwood | 290 | 10.0 | +10.0 | |
| Liberal Democrats | Justin Dominic Stafford | 82 | 2.8 | +2.8 | |
| TUSC | Ryan Aldred | 22 | 22 0.8 | +0.8 | |
| Majority | 483 | ||||
| Turnout | 29.24 | ||||
| Labour hold | Swing | ||||
| Party | Candidate | Votes | % | ±% | |
|---|---|---|---|---|---|
| Labour | Jemima Laing | 1,427 | 52.8% | +0.2% | |
| Conservative | Kathy Watkin | 981 | 36.3% | +2.8% | |
| Liberal Democrats | Connor Clarke | 174 | 6.4% | +1.4% | |
| Active for Plymouth | Iuliu Popescue | 123 | 4.5% | +4.5% | |
| Majority | |||||
| Turnout | |||||
| Labour hold | Swing | ||||
References[]
- ^ "Council compositions". The Elections Centre. Retrieved 3 May 2016.
- ^ "Plymouth". BBC News Online. 19 April 2008. Retrieved 22 September 2009.
- ^ "Labour loses control in Plymouth". BBC News. 5 May 2006.
- ^ "Labour regains control of Plymouth city council". The Guardian. 23 June 2006.
- ^ All three of Plymouth's Ukip councillors have just quit the party and joined the Tories
- ^ The City of Plymouth (Electoral Arrangements) Order 1978
- ^ The Devon (District Boundaries) Order 1985
- ^ legislation.gov.uk - The City of Plymouth (Electoral Changes) Order 2002. Retrieved on 4 October 2015.
- ^ "Local elections". BBC News Online. Retrieved 22 September 2009.
- ^ "Council and democracy". Plymouth City Council. Retrieved 22 September 2009.
- ^ "Labour lose their majority hold over Plymouth City Council". The Herald. 8 May 2015. Archived from the original on 30 September 2015. Retrieved 2 December 2015.
- ^ "About Plymouth City Council". Plymouth City Council. Retrieved 2 December 2015.
- ^ "Local Authority Byelecion Results - August 1997". Retrieved 19 November 2019.
- ^ "Local Authority Byelecion Results - September 1997". Retrieved 19 November 2019.
- ^ "Local Authority Byelecion Results - May 2002". Retrieved 19 November 2019.
- ^ "Local Authority Byelecion Results - May 2002". Retrieved 19 November 2019.
- ^ "Labour regains control of Plymouth city council". guardian.co.uk. London. 23 June 2006. Retrieved 22 September 2009.
- ^ "Ham by-election". Plymouth City Council. Archived from the original on 9 June 2011. Retrieved 22 September 2009.
- ^ O'Leary, Miles (10 September 2017). "All three of Plymouth's Ukip councillors have just quit the party". plymouthherald. Retrieved 10 April 2018.
- ^ "Local Authority Byelecion Results - June 2013". Retrieved 19 November 2019.
- ^ "Past election results". Plymouth City Council. Retrieved 19 November 2019.
- ^ "Labour hold Stoke ward seat in Plymouth by-election". Plymouth Herald. 27 July 2018.
- ^ "Local Authority Byelecion Results - July 2018". Retrieved 19 November 2019.
External links[]

- Plymouth City Council elections
- Council elections in Devon
- Politics of Plymouth, Devon
- Unitary authority elections in England