Portsmouth City Council elections
Portsmouth is a unitary authority in Hampshire, England. Until 1 April 1997 it was a non-metropolitan district.
Political control[]
Since the first election to the council in 1973 political control of the council has been held by the following parties:[1]
Non-metropolitan district
| Election | Overall Control | Conservative | Labour | Alliance/Liberal Democrats | Independent | |
|---|---|---|---|---|---|---|
| 1973 | Conservative | 28 | 17 | 0 | 3 | 48 |
| 1976 | 31 | 14 | 0 | 3 | ||
| 1979 | 31 | 14 | 0 | 3 | ||
| 1983 | 25 | 11 | 1 | 2 | 39 | |
| 1984 | 25 | 11 | 1 | 2 | ||
| 1986 | 23 | 10 | 5 | 1 | ||
| 1987 | 24 | 9 | 5 | 1 | ||
| 1988 | 25 | 8 | 5 | 1 | ||
| 1990 | 21 | 12 | 5 | 1 | ||
| 1991 | No Overall Control (Conservative Administration) |
19 | 13 | 6 | 1 | |
| 1992 | 17 | 14 | 7 | 1 | ||
| 1994 | No Overall Control (Labour Administration) |
15 | 14 | 9 | 1 | |
| 1995 | 11 | 18 | 10 | 0 |
Unitary authority
| Party in control | Years | Leader | |
|---|---|---|---|
| Labour | 1996-2000[2] | Leo Madden | |
| No overall control (Labour Administration) | 2000–2002 | ||
| No overall control (Conservative Administration) | 2002–2004 | Frank Worley | |
| No overall control (Liberal Democrat Administration) | 2004–2009 | Gerald Vernon-Jackson | |
| Liberal Democrats | 2009-2014[3] | ||
| No overall control (Conservative Administration) | 2014–2018 | Donna Jones | |
| No overall control (Liberal Democrat Administration) | 2018–present | Gerald Vernon-Jackson | |
Council elections[]
Non-metropolitan district elections[]
- 1973 Portsmouth City Council election
- (New ward boundaries)[4]
Unitary authority elections[]
- 1998 Portsmouth City Council election
- 1999 Portsmouth City Council election
- 2000 Portsmouth City Council election
- 2002 Portsmouth City Council election (New ward boundaries increased the number of seats by 3)[5][6]
- 2003 Portsmouth City Council election
- 2004 Portsmouth City Council election
- 2006 Portsmouth City Council election
- 2007 Portsmouth City Council election
- 2008 Portsmouth City Council election
- 2010 Portsmouth City Council election
- 2011 Portsmouth City Council election
- 2012 Portsmouth City Council election
- 2014 Portsmouth City Council election
- 2015 Portsmouth City Council election
- 2016 Portsmouth City Council election
- 2018 Portsmouth City Council election
- 2019 Portsmouth City Council election
- 2021 Portsmouth City Council election
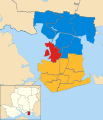
City result maps[]

2002 results map

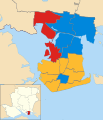
2003 results map
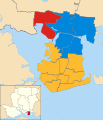
2004 results map

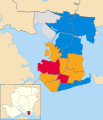
2006 results map
2007 results map

2008 results map

2010 results map
2011 results map

2012 results map

2014 results map

2015 results map

2016 results map

2018 results map

2019 results map
2021 results map


By-election results[]
| Party | Candidate | Votes | % | ±% | |
|---|---|---|---|---|---|
| Conservative | Stephen Wemyss | 2,148 | 50.9 | +4.2 | |
| Liberal Democrats | Patrict Whittle | 1,973 | 46.7 | +4.3 | |
| English Democrat | David Knight | 102 | 2.4 | +2.4 | |
| Majority | 175 | 4.2 | |||
| Turnout | 4,223 | 43.0 | |||
| Conservative hold | Swing | ||||
| Party | Candidate | Votes | % | ±% | |
|---|---|---|---|---|---|
| Liberal Democrats | David Fuller | 1,196 | 58.6 | +2.6 | |
| Conservative | Gerry Oldfield | 496 | 24.3 | +1.3 | |
| Labour | Simon Payne | 144 | 7.1 | -5.4 | |
| English Democrat | David Knight | 131 | 6.4 | -2.1 | |
| Green | Sean Sanders | 56 | 2.7 | +2.7 | |
| Independent | Mark Austin | 17 | 0.8 | +0.8 | |
| Majority | 700 | 34.3 | +1.3 | ||
| Turnout | 2,040 | 20.7 | |||
| Liberal Democrats hold | Swing | ||||
| Party | Candidate | Votes | % | ±% | |
|---|---|---|---|---|---|
| Labour | Sarah Cook | 791 | 35.0 | +3.2 | |
| Conservative | Jim Fleming | 682 | 30.2 | +3.3 | |
| Liberal Democrats | Alex Naylor | 548 | 24.2 | -2.9 | |
| UKIP | Michelle Essery | 90 | 4.0 | +4.0 | |
| Green | Calum Kennedy | 78 | 3.5 | -2.9 | |
| English Democrat | Clive Percy | 71 | 3.1 | -4.4 | |
| Majority | 109 | 4.8 | |||
| Turnout | 2,260 | 22.4 | |||
| Labour hold | Swing | ||||
| Party | Candidate | Votes | % | ±% | |
|---|---|---|---|---|---|
| Liberal Democrats | Andy Fraser | 1,835 | 55.8 | +38.4 | |
| Conservative | Jim Fleming | 904 | 27.5 | -18.6 | |
| Labour | Terry O'Brien | 349 | 10.6 | -8.2 | |
| English Democrat | David Knight | 117 | 3.6 | -13.6 | |
| UKIP | Michelle Essery | 57 | 1.7 | +1.7 | |
| Independent | Mark Austin | 28 | 0.9 | +0.9 | |
| Majority | 931 | 28.3 | |||
| Turnout | 3,290 | 33.9 | |||
| Liberal Democrats gain from Conservative | Swing | ||||
References[]
- ^ "Council compositions". The Elections Centre. Retrieved 3 May 2016.
- ^ "Portsmouth". BBC News Online. 2008-04-19. Retrieved 2009-08-31.
- ^ "Lib Dems claim fourth defection". BBC News Online. 2009-01-27. Retrieved 2009-08-31.
- ^ legislation.gov.uk - The City of Portsmouth (Electoral Arrangements) Order 1979. Retrieved on 19 November 2015.
- ^ "Portsmouth". * BBC News Online. Retrieved 2009-08-31.
- ^ legislation.gov.uk - The City of Portsmouth (Electoral Changes) Order 2001. Retrieved on 4 October 2015.
- ^ "Drayton & Farlington Ward By-election - 1 September 2005". Portsmouth City Council. Archived from the original on January 7, 2009. Retrieved 2009-08-31.
- ^ "Fratton Ward by-election 2007 results". Portsmouth City Council. Archived from the original on 2010-05-14. Retrieved 2009-08-31.
- ^ "Nelson Ward by-election 2007 results". Portsmouth City Council. Retrieved 2009-08-31.
- ^ "Copnor Ward by-election 2008 results". Portsmouth City Council. Retrieved 2009-08-31.
External links[]
| Hampshire County Council | |
|---|---|
| Basingstoke and Deane Borough Council | |
| East Hampshire District Council | |
| Eastleigh Borough Council | |
| Fareham Borough Council | |
| Gosport Borough Council | |
| Hart District Council | |
| Havant Borough Council | |
| New Forest District Council | |
| Portsmouth City Council | |
| Rushmoor Borough Council | |
| Southampton City Council | |
| Test Valley Borough Council | |
| Winchester City Council | |
| |
| Districts |
|  |
|---|---|---|
| Councils |
| |
| Local elections |
| |
Categories:
- Portsmouth City Council elections
- Council elections in Hampshire
- Elections in Portsmouth
- Unitary authority elections in England