Poverty in the United States

Poverty in the United States of America refers to people who lack sufficient income or material possessions for their needs. Although the US is a relatively wealthy country by international standards,[1] poverty has consistently been present throughout the United States, along with efforts to alleviate it, from New Deal-era legislation during the Great Depression to the national War on Poverty in the 1960s to poverty alleviation efforts during the 2008 Great Recession.
The U.S. federal government uses two measures to measure poverty: the poverty thresholds set by the U.S. Census Bureau, used for statistical purposes, and the poverty guidelines issued by the Department of Health and Human Services, which are used for administrative purposes.[2] Poverty thresholds, which recognize poverty as a lack of those goods and services which are commonly taken for granted by members of mainstream society,[3] consist of income levels. On the other hand, poverty guidelines are simpler guidelines that are used to determine eligibility for federal programs such as Head Start and food stamps.[4]
The 2020 assessment by the U.S. Census Bureau showed the percentage of Americans living in poverty for 2019 (before the pandemic) had fallen to some of lowest levels ever recorded due to the record-long economic growth period. However, between May and October 2020, some eight million people were put into poverty due to the economic effects of the pandemic lockdowns and the ending of funds from the CARES Act.
Historical background[]
Progressive era[]

Catalyzed by Henry George's 1873 book Progress and Poverty, public interest in how poverty could arise even in a time of economic progress arose in the 19th century with the rise of the Progressive movement. The Progressive American social survey began with the publication of Hull House Maps and Papers in 1895. This study included essays and maps collected by Florence Kelley and her colleagues working at Hull House and staff of the United States Bureau of Labor.[5] It focused on studying the conditions of the slums in Chicago, including four maps color-coded by nationality and income level, which were based on Charles Booth's earlier pioneering work, Life and Labour of the People in London.[6]
Another social reformer, Jacob Riis, documented the living conditions of New York tenements and slums in his 1890 work How the Other Half Lives.[7]
Great Depression[]
A group especially vulnerable to poverty consisted of poor sharecroppers and tenant farmers in the South. These farmers consisted of around a fourth of the South's population, and over a third of these people were African Americans.[8] Historian James T. Patterson refers to these people as the "old poverty," as opposed to the "new poverty" that emerged after the onset of the Great Depression.[9]
During the Depression, the government did not provide any unemployment insurance, so people who lost jobs easily became impoverished.[10] People who lost their jobs or homes lived in shantytowns or Hoovervilles. Many New Deal programs were designed to increase employment and reduce poverty. The Federal Emergency Relief Administration specifically focused on creating jobs for alleviating poverty. Jobs were more expensive than direct cash payments (called "the dole"), but were psychologically more beneficial to the unemployed, who wanted any sort of job for morale.[11] Other New Deal initiatives that aimed at job creation and wellbeing included the Civilian Conservation Corps and Public Works Administration. Additionally, the institution of Social Security was one of the largest factors that helped to reduce poverty.[12]
War on Poverty[]
A number of factors helped start the national War on Poverty in the 1960s. In 1962, Michael Harrington's book The Other America helped increase public debate and awareness of the poverty issue. The War on Poverty embraced expanding the federal government's roles in education and health care as poverty reduction strategies, and many of its programs were administered by the newly established Office of Economic Opportunity. The War on Poverty coincided with more methodological and precise statistical versions of studying poverty; the "official" U.S. statistical measure of poverty was only adopted in 1969.[13]
21st century[]

In the 21st century, the Great Recession helped to increase poverty levels again. As of 2009, the number of people who were in poverty was approaching 1960s levels that led to the national War on Poverty.[14] The 2010 census data shows that half the population qualifies as poor or low income,[15] with one in five millennials living in poverty.[16] Academic contributors to The Routledge Handbook of Poverty in the United States postulate that new and extreme forms of poverty have emerged in the U.S. as a result of neoliberal structural adjustment policies and globalization, which have rendered economically marginalized communities as destitute "surplus populations" in need of control and punishment.[17]
Many international bodies have emphasized the issues of poverty that the United States faces. A 2013 UNICEF report ranked the U.S. as having the second-highest relative child poverty rates in the developed world.[18] As of June 2016, the IMF warned the United States that its high poverty rate needs to be tackled urgently by raising the minimum wage and offering paid maternity leave to women to encourage them to enter the labor force.[19] In December 2017, the United Nations special rapporteur on extreme poverty and human rights, Philip Alston, undertook a two-week investigation on the effects of systemic poverty in the United States, and sharply condemned "private wealth and public squalor," declaring the state of Alabama to have the "worst poverty in the developed world."[20] Alston's report was issued in May 2018 and highlights that 40 million people live in poverty and over five million live "in 'Third World' conditions."[21]
According to a 2020 assessment by the U.S. Census Bureau, the percentage of Americans living in poverty for 2019 (before the pandemic) had fallen to some of lowest levels ever recorded due to the record-long economic growth period and stood at 11.1% (adjusted for smaller response during the pandemic).[22] However, between May and October 2020, the economic effects of the lockdowns put in place as a result of the pandemic, and the exhaustion of the funding provided by the CARES Act, dragged some eight million people into poverty.[23]
Measuring poverty[]
There are several measures used by the U.S. federal government to measure poverty. The Census Bureau issues the poverty thresholds, which are generally used for statistical purposes[24]—for example, to estimate the number of people in poverty nationwide each year and classify them by type of residence, race, and other social, economic, and demographic characteristics. The Department of Health and Human Services issues the poverty guidelines for administrative purposes—for instance, to determine whether a person or family is eligible for assistance through various federal programs.[25] Both the poverty thresholds and poverty guidelines are updated yearly.[26] More recently, the Census Bureau has begun using the Supplemental Poverty Measure as an additional statistic to measure poverty and supplement the existing measures.
Poverty income thresholds[]
The poverty income thresholds originate from work done by Mollie Orshansky, an American economist working for the Social Security Administration. Orshansky introduced the poverty thresholds in a 1963 Social Security Bulletin article, "Children of the Poor."[27]
Orshansky based her thresholds on work she had done with the economy food plan while at the USDA. According to the USDA's 1955 Household Food Consumption Survey, families of three or more people spent one-third of their after-tax income on food. For these families, poverty thresholds were set at three times the cost of the economy food plan. Different procedures were used for calculating poverty thresholds for two-person households and persons living alone.
Her work appeared at an opportune moment, as President Johnson declared the War on Poverty just six months later—and Orshanky's work offered a numerical way to measure progress in this effort.[28] The newly formed Office of Economic Opportunity (OEO) adopted the Orshansky poverty thresholds for statistical, planning, and budgetary purposes in May 1965.[29] Officials at the OEO were enthusiastic; as research director Joseph Kershaw remarked, "Mollie Orshansky says that when you have more people in the family, you need more money. Isn't that sensible?"[28]
Officials at the Social Security Administration began to plan on how to adjust poverty thresholds for changes in the standard of living. The Bureau of the Budget resisted these changes, but formed an interagency committee that, in 1969, decided that poverty thresholds would be adjusted for inflation by being tied to the Consumer Price Index, rather than changes in the standard of living. In August 1969, the Bureau of the Budget designated these revised thresholds as the federal government's official definition of poverty.[29]
Apart from minor changes in 1981 that changed the number of thresholds from 124 to 48,[29] poverty thresholds have remained static for the past fifty years despite criticism that the thresholds may not be completely accurate. Although the poverty thresholds assumes that the average household of three spends one-third of its budget on food, more recent surveys have shown that that number has decreased to one-fifth in the 1980s and one-sixth by the 1990s.[30][31] If the poverty thresholds were recalculated based on food costs as of 2008, the economy food budget multiplier would have been 7.8 rather than 3, greatly increasing the thresholds.[32]
Poverty income guidelines[]
| Persons in Family Unit |
48 Contiguous States and D.C. |
Alaska | Hawaii |
|---|---|---|---|
| 1 | $12,880 | $16,090 | $14,820 |
| 2 | $17,420 | $21,770 | $20,040 |
| 3 | $21,960 | $27,450 | $25,260 |
| 4 | $26,500 | $33,130 | $30,480 |
| 5 | $31,040 | $38,810 | $35,700 |
| 6 | $35,580 | $44,490 | $40,920 |
| 7 | $40,120 | $50,170 | $46,140 |
| 8 | $44,660 | $55,850 | $51,360 |
| Each additional person adds |
$4,540 | $5,680 | $5,220 |
The poverty guidelines are a version of the poverty thresholds used by federal agencies for administrative purposes, such as determining eligibility for federal assistance programs. They are useful because poverty thresholds for one calendar year are not published until the summer of the next calendar year; poverty guidelines, on the other hand, allow agencies to work with more timely data.[26]
Poverty guidelines were initially issued by the OEO starting in December 1965. After the , responsibility for issuing the guidelines was transferred to the Department of Health and Human Services.[28] Poverty guidelines are also referred to as the "federal poverty level" (FPL), but the HHS discourages that term as ambiguous.[2]
Supplemental Poverty Measure[]
In 1990, a Congressional committee requested the National Research Council (NRC) to conduct a study on revising the poverty measure.[29] The NRC convened a panel, which published a 1995 report Measuring Poverty: A New Approach that concluded that the official poverty measure in the United States is flawed. The panel noted that the thresholds are the same irrespective of geography and stated that due to "rising living standards in the United States, most approaches for developing poverty thresholds (including the original one) would produce higher thresholds today than the current ones."[33]
Additionally, the report suggested an alternative measure of poverty, which uses actual expenditure data to develop a threshold value for a family of four—and then update this threshold every year and according to geographic location. This alternative measure of poverty would also change the income calculation for a family, including certain non-cash benefits that satisfied "basic needs" such as food stamps and public housing while excluding "non-basic needs" such as medical costs and child care.[34]
The work of the panel led to the development of Supplemental Poverty Measure (SPM), which was intended to address some of the weaknesses of the existing poverty guidelines. In October 2014, the Census Bureau released a report describing the SPM and stated its intention to publish SPM measures every year.[35] However, SPM is intended to "supplement" the existing poverty thresholds, not "replace" them, as poverty thresholds will remain the "official" Census Bureau measure and poverty guidelines will be derived only from the "official" poverty measures.[36]
Unlike the poverty thresholds, and in line with the NRC recommendations, the SPM both includes certain non-cash benefits in a family's income and adjusts thresholds for differences in housing costs by geographic area. Additionally, the SPM thresholds are based on how much a "reference" family with two children spends on food, clothing, shelter, and utilities (FCSU).
Criticism[]
Understating poverty[]
Many sociologists and government officials have argued that poverty in the United States is understated, meaning that there are more households living in actual poverty than there are households below the poverty threshold.[37] A recent[38] NPR report states that as many as 30% of Americans have trouble making ends meet and other advocates have made supporting claims that the rate of actual poverty in the US is far higher than that calculated by using the poverty threshold.[37] A study taken in 2012 estimated that roughly 38% of Americans live "paycheck to paycheck."[39]
In 1969, the Bureau of Labor Statistics put forward suggested budgets for adequate family living. 60% of working-class Americans lived below the "intermediate" budget, which allowed for the following:
It assumes, for example, that the family will own:
... A toaster that will last for 33 years.
... A vacuum cleaner that will last 14 years.
The budget assumes that a family will buy a two-year-old car and keep it for four years...
Finally, the budget allows nothing whatever for savings.[40]
Given that the "intermediate" budget was fairly modest, observers questioned whether poverty levels were really capturing the full extent of prosperity, challenging the long-established view that most Americans had attained an affluent standard of living in the two decades following the end of the Second World War.[41]

There have also been criticism of the methodology used to develop the U.S. poverty thresholds in the first place. As noted above, the poverty thresholds used by the US government were originally developed during the Johnson administration's War on Poverty initiative in the early 1960s.[42][43] The thresholds were based on the cost of a food basket at the time, multiplied by three, under the assumption that the average family spent one third of its income on food.
However, the current poverty line only takes into account food purchases that were common more than 50 years ago. Additionally, it assumes that Americans spend one third of their income on food; in fact, Americans typically spent less than one tenth of their after-tax income on food in 2000.[44] For many families, the costs of housing, health insurance and medical care, transportation, and access to basic telecommunications take a much larger bite out of the family's income today than a half century ago, yet none of these costs are considered in determining the official poverty thresholds.
According to John Schwarz, a political scientist at the University of Arizona:
The official poverty line today is essentially what it takes in today's dollars, adjusted for inflation, to purchase the same poverty-line level of living that was appropriate to a half century ago, in 1955 .... Updated thereafter only for inflation, the poverty line lost all connection over time with current consumption patterns of the average family. Quite a few families then didn't have their own private telephone, or a car, or even a mixer in their kitchen... The official poverty line has thus been allowed to fall substantially below a socially decent minimum, even though its intention was to measure such a minimum.[45]

The issue of understating poverty is especially pressing in states with both a high cost of living and a high poverty rate such as California where the median home price in 2006 was $564,430.[46] In the Monterey area, where the low-pay industry of agriculture is the largest sector in the economy and the majority of the population lacks a college education, the median home price was $723,790, requiring an upper middle class income only earned by roughly 20% of all households in the county.[46][47] Such fluctuations in local markets are, however, not considered in the federal poverty threshold and may leave many who live in poverty-like conditions out of the total number of households classified as poor.
The Supplemental Poverty Measure, introduced in 2011, aims at providing a more accurate picture of the true extent of poverty in the United States by taking account of non-cash benefits and geographic variations.[48] According to this new measure, 16% of Americans lived in poverty in 2011, compared with the official figure of 15.2%. With the new measure, one study estimated that nearly half of all Americans lived within 200% of the federal poverty line.[49]
According to American economist Sandy Darity, Jr., "There is no exact way of measuring poverty. The measures are contingent on how we conceive of and define poverty. Efforts to develop more refined measures have been dominated by researchers who intentionally want to provide estimates that reduce the magnitude of poverty."[50]
Overstating poverty[]

Some critics assert that the official U.S. poverty definition is inconsistent with how it is defined by its own citizens and the rest of the world, because the U.S. government considers many citizens statistically impoverished despite their ability to sufficiently meet their basic needs. According to a 2011 paper by research fellow Robert Rector from the conservative Heritage Foundation, of the 43.6 million Americans deemed by the U.S. Census Bureau to be below the poverty level in 2009, the majority had adequate shelter, food, clothing and medical care. Left-leaning sources disputed the report's findings.[51][52][53][54] In addition, the paper stated that those assessed as below the poverty line in 2011 have a much higher quality of living than those who were identified by the census 40 years ago as being in poverty. For example, in 2005, 63.7% of those living in poverty had cable or satellite television. In some cases the report even said that people currently living in poverty were actually better off than middle class people of the recent past. For example, in 2005, 78.3% of households living in poverty had air conditioning, whereas in 1970, 36.0% of all households had air conditioning.[55][56]
According to The Heritage Foundation, the federal poverty line also excludes income other than cash income, especially welfare benefits. Thus, if food stamps and public housing were successfully raising the standard of living for poverty stricken individuals, then the poverty line figures would not shift, since they do not consider the income equivalents of such entitlements.[57]
Steven Pinker, writing in an op-ed for The Wall Street Journal, claims that the poverty rate, as measured by consumption, has fallen from 11% in 1988 to 3% in 2018.[58] Burkhauser et al. find that accounting for cash income, taxes, and major in-kind transfers and updating poverty thresholds for inflation show that a Full-income Poverty Rate based on President Johnson's standards fell from 19.5 percent to 2.3 percent over the 1963–2017 period.[59]
Geography[]
Poverty in U.S. territories[]

The highest poverty rates in the United States are in the U.S. territories (American Samoa, Guam, the Northern Mariana Islands, Puerto Rico and the U.S. Virgin Islands).[60] American Samoa has the lowest per capita income in the United States — it has a per capita income comparable to that of Botswana.[61] In 2010, American Samoa had a per capita income of $6,311.[62] The county or county-equivalent with the lowest per capita income in the United States is the Manu'a District in American Samoa (per capita income of $5,441).[63] In 2018, Puerto Rico had the lowest median household income of any state / territory in the United States ($20,166).[64][note 1] Also in 2018, Comerío, Puerto Rico had a median household income of $12,812 — the lowest median household income of any county or county-equivalent in the United States.[66]
In the 2010 U.S. Census, Guam had a poverty rate of 22.9%,[67] the Northern Mariana Islands had a poverty rate of 52.3%,[68] and the U.S. Virgin Islands had a poverty rate of 22.4%[69] (all higher than any U.S. state). In 2018, Puerto Rico had a poverty rate of 43.1%.[64] In 2017, American Samoa had a poverty rate of 65% — the highest poverty rate of any state or territory in the United States.[70]
Poverty in U.S. states[]
As of 2018, the state with the lowest poverty rate was New Hampshire (7.6% poverty rate).[71] Other states with low poverty rates in 2018 include Hawaii (8.8% poverty rate), Maryland (9.0% poverty rate), and Minnesota (9.6% poverty rate).[72][73][74][75] Among U.S. states, Mississippi had the highest poverty rate in 2018 (19.7% poverty rate).[76]
Poverty and demographics[]
Poverty and family status[]
Among married couple families: 5.8% lived in poverty.[77] This number varied by race and ethnicity as follows:
5.4% of all white persons (which includes white Hispanics),[78]
10.7% of all black persons (which includes black Hispanics),[79] and
14.9% of all Hispanic persons (of any race)[80] living in poverty.
Among single parent (male or female) families: 26.6% lived in poverty.[77] This number varied by race and ethnicity as follows:
22.5% of all white persons (which includes white Hispanics),[78]
44.0% of all black persons (which includes black Hispanics),[79] and
33.4% of all Hispanic persons (of any race)[81] living in poverty.
Among individuals living alone: 19.1% lived in poverty.[77] This number varied by race and ethnicity as follows:
18% of white persons (which includes white Hispanics),[82]
28.9% of black persons (which includes black Hispanics)[81] and
27% of Hispanic persons (of any race)[83] are living in poverty.
Poverty and race/ethnicity[]
The US Census declared that in 2014 14.8% of the general population lived in poverty:[84]
10.1% of all white non-Hispanic persons
12.0% of all Asian persons
23.6% of all Hispanic persons (of any race)
26.2% of all African American persons
28.3% of Native Americans / Alaska Natives
As of 2010 about half of those living in poverty are non-Hispanic white (19.6 million).[84] Non-Hispanic white children comprised 57% of all poor rural children.[85]
In FY 2009, African American families comprised 33.3% of TANF families, non-Hispanic white families comprised 31.2%, and 28.8% were Hispanic.[86]
Poverty among Native Americans[]
Poverty is also notoriously high on Native American reservations (see Reservation poverty). 7 of the 11 poorest counties in per capita income (in the 50 states), including the 2 poorest in the 50 states, encompass Lakota Sioux reservations in South Dakota.[87] This fact has been cited by some critics as a mechanism that enables the "kidnapping" of Lakota children by the state of South Dakota's Department of Social Services. The Lakota People's Law Project,[88] among other critics, allege that South Dakota "inappropriately equates economic poverty with neglect ... South Dakota's rate of identifying "neglect" is 18% higher than the national average ... In 2010, the national average of state discernment of neglect, as a percent of total maltreatment of foster children prior to their being taken into custody by the state, was 78.3%. In South Dakota the rate was 95.8%."[89]
Poverty in the Pine Ridge Reservation in particular has had unprecedented effects on its residents' longevity. "Recent reports state the average life expectancy is 45 years old while others state that it is 48 years old for men and 52 years old for women. With either set of figures, that's the shortest life expectancy for any community in the Western Hemisphere outside Haiti, according to The Wall Street Journal."[90]
In the 2013—2017 American Community Survey, Wounded Knee, South Dakota (located in the Pine Ridge Indian Reservation) had the 7th-lowest median household income out of all places in the 50 states/D.C./Puerto Rico.[91]
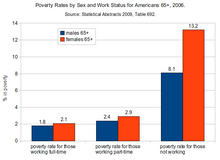
Poverty and age[]

As of 2010, the US Census declared that 15.1% of the general population of the United States lived in poverty:
- 22% of all people under the age of 18
- 13.7% of those between the ages of 19-21
- 9% of all people either 65 or older[84]
The Organisation for Economic Co-operation and Development (OECD) uses a different measure for poverty and declared in 2008 that child poverty in the US is 20% and poverty among the elderly is 23%.[92]

Child poverty[]
In May 2009, the non-profit advocacy group Feeding America released a study based on 2005–2007 data from the U.S. Census Bureau and the Agriculture Department, which claims that 3.5 million children under the age of 5 are at risk of hunger in the United States. The study claims that in 11 states, Louisiana, which has the highest rate, followed by North Carolina, Ohio, Kentucky, Texas, New Mexico, Kansas, South Carolina, Tennessee, Idaho and Arkansas, more than 20 percent of children under 5 are allegedly at risk of going hungry. (receiving fewer than 1,800 calories per day).[97]
In 2012, 16.1 million American children were living in poverty. Outside of the 49 million Americans living in food insecure homes, 15.9 million of them were children.[98] In 2013, child poverty reached record high levels in the U.S., with 16.7 million children living in food insecure households.[99] Many of the neighborhoods these children live in lack basic produce and nutritious food. 47 million Americans depend on food banks, more than 30% above 2007 levels. Households headed by single mothers are most likely to be affected. 30 percent of low-income single mothers cannot afford diapers.[100] Inability to afford this necessity can cause a chain reaction, including mental, health, and behavioral problems. Some women are forced to make use of one or two diapers, using them more than once. This causes rashes and sanitation problems as well as health problems. Without diapers, children are unable to enter into daycare. The lack of childcare can be detrimental to single mothers, hindering their ability to obtain employment.[100] Worst affected are Oregon, Arizona, New Mexico, Florida, and the District of Columbia, while North Dakota, New Hampshire, Virginia, Minnesota and Massachusetts are the least affected.[99] 31 million low-income children received free or reduced-price meals daily through the National School lunch program during the 2012 federal fiscal year. Nearly 14 million children are estimated to be served by Feeding America with over 3 million being of the ages of 5 and under.[101]
A 2014 report by the National Center on Family Homelessness states the number of homeless children in the U.S. has reached record levels, calculating that 2.5 million children, or one child in every 30, experienced homelessness in 2013. High levels of poverty, lack of affordable housing and domestic violence were cited as the primary causes.[102] A 2017 peer-reviewed study published in Health Affairs found that the U.S. has the highest levels of child mortality among 20 OECD countries.[103]
Poverty is also associated with expanded adverse childhood experiences, such as witnessing violence, feeling discrimination, and experiencing bullying.[104] According to a 2016 study by the Urban Institute, teenagers in low income communities are often forced to join gangs, save school lunches, sell drugs or exchange sexual favors because they cannot afford food.[105]
Effects of poverty[]

Education[]
Poverty affects individual access to quality education. The U.S. education system is often funded by local communities; therefore the quality of materials and teachers can reflect the affluence of community. That said, many communities address this by supplementing these areas with funds from other districts. Low income communities are often not able to afford the quality education that high income communities do which results in a cycle of poverty.
In the United States more than 40.6 million people live in poverty,[106] caused mainly by wage inequality,[107][clarification needed] inflation and poor education.[108] The vast majority living in poverty is uneducated people that end up increasing more unemployment[106][clarification needed] and crime.[108]
Factors in poverty[]
There are numerous factors related to poverty in the United States.
- Income has a high correlation with educational levels. In 2007, the median earnings of household headed by individuals with less than a 9th grade education was $20,805 while households headed by high school graduates earned $40,456, households headed by holders of bachelor's degrees earned $77,605, and families headed by individuals with professional degrees earned $100,000.[109] Federal Reserve Chair Janet Yellen stated in 2014: "Public funding of education is another way that governments can help offset the advantages some households have in resources available for children. One of the most consequential examples is early childhood education. Research shows that children from lower-income households who get good-quality pre-Kindergarten education are more likely to graduate from high school and attend college as well as hold a job and have higher earnings, and they are less likely to be incarcerated or receive public assistance."[110]
- In many cases poverty is caused by job loss. In 2007, the poverty rate was 21.5% for individuals who were unemployed, but only 2.5% for individuals who were employed full-time.[109]
- Children growing up in female-headed families with no spouse present have a poverty rate over four times that of children in married-couple families.[111]
- Income levels vary with age. For example, the median 2009 income for households headed by individuals age 15–24 was only $30,750, but increased to $50,188 for household headed by individuals age 25–34 and $61,083 for household headed by individuals 35–44.[112] Work experience and additional education may be factors.
- Income levels vary along racial/ethnic lines: 21% of all children in the United States live in poverty, about 46% of black children and 40% of Latino children.[114] The poverty rate is 9.9% for black married couples, and only 30% of black children are born to married couples (see Marriage below). The poverty rate for native born and naturalized whites is identical (9.6%). On the other hand, the poverty rate for naturalized blacks is 11.8% compared to 25.1% for native born blacks, suggesting race alone does not explain income disparity. Not all minorities have low incomes. Asian families have higher incomes than all other ethnic groups. For example, the 2005 median income of Asian families was $68,957 compared to the median income of white families of $59,124.[115] Asians, however, report discrimination occurrences more frequently than blacks. Specifically, 31% of Asians reported employment discrimination compared to 26% of blacks in 2005.[116]
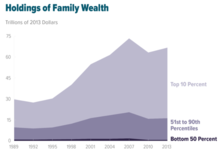
- Policies that address income and wealth inequality (i.e., policies that transfer money from higher-income and more wealthy families to less wealthy families) bear significantly on poverty. Economist Jared Bernstein and Elise Gould of the Economic Policy Institute suggest that poverty could have decreased significantly if inequality had not increased over the last few decades.[117][118] Economist Larry Summers estimated that at 1979 levels of income inequality, the bottom 80% of families would have an average of $11,000 more per year in income in 2014.[119]
- The relationship between tax rates and poverty is disputed. A study comparing high tax Scandinavian countries with the U. S. suggests high tax rates are inversely correlated with poverty rates.[120] The poverty rate, however, is low in some low tax countries like Switzerland. A comparison of poverty rates between states reveals that some low tax states have low poverty rates. For example, New Hampshire has the lowest poverty rate of any state in the U. S., and has very low taxes (46th among all states). It is true however that both Switzerland and New Hampshire have a very high household income and other measures offsetting the lack of taxation. For example, Switzerland has Universal Healthcare and a free system of education for children as young as four years old.[121] New Hampshire has no state income tax or sales tax, but does have the nation's highest property taxes.[122]
 Total incarceration in the United States by year
 - The poor in the United States are incarcerated at a much higher rate than their counterparts in other developed nations, with penal confinement being, according to sociologist Bruce Western, "commonplace for poor men of working age."[123] A 2015 study by the Vera Institute of Justice contends that jails in the U.S. have become "massive warehouses" of the impoverished since the 1980s.[124] Scholars assert that the transformation of the already anemic U.S. welfare state to a post-welfare punitive state, along with neoliberal structural adjustment policies, the globalization of the U.S. economy and the dominance of global financial institutions, have created more extreme forms of "destitute poverty" in the U.S. which must be contained by expanding the criminal justice system and the carceral state into every aspect of the lives of the poor, which, according to Reuben Jonathan Miller and Emily Shayman, has resulted in "transforming what it means to be poor in America."[17]
- According to the American Enterprise Institute, research has shown that income and intelligence are related. In a 1998 study, Charles Murray compared the earnings of 733 full sibling pairs with differing intelligence quotients (IQs). He referred to the sample as utopian in that the sampled pairs were raised in families with virtually no illegitimacy, divorce or poverty. The average earnings of sampled individuals with an IQ of under 75 was $11,000, compared to $16,000 for those with an IQ between 75 and 90, $23,000 for those with an IQ between 90 and 110, $27,000 for those with an IQ between 110 and 125, and $38,000 for those with an IQ above 125.[125][126] Murray's work on IQ has been criticized by Stephen Jay Gould, Loïc Wacquant and others, including the Southern Poverty Law Center.[127][128][129]
- According to a 2017 academic study by MIT economist Peter Temin, Americans trapped in poverty live in conditions rivaling the developing world, and are forced to contend with substandard education, dilapidated housing, and few stable employment opportunities.[130] A 2017 study published in The American Journal of Tropical Medicine and Hygiene found that hookworm, a parasite that thrives on extreme poverty, is flourishing in the Deep South. A report on the study in The Guardian stated:
Scientists in Houston, Texas, have lifted the lid on one of America’s darkest and deepest secrets: that hidden beneath fabulous wealth, the US tolerates poverty-related illness at levels comparable to the world’s poorest countries. More than one in three people sampled in a poor area of Alabama tested positive for traces of hookworm, a gastrointestinal parasite that was thought to have been eradicated from the US decades ago.[131]
- Some 12 million Americans live with diseases associated with extreme poverty.[132]


Fighting poverty[]
In the age of inequality, such anti-poverty policies are more important than ever, as higher inequality creates both more poverty along with steeper barriers to getting ahead, whether through the lack of early education, nutrition, adequate housing, and a host of other poverty-related conditions that dampen one's chances in life.
— Jared Bernstein[133]
There have been governmental and nongovernmental efforts to reduce poverty and its effects. These range in scope from neighborhood efforts to campaigns with a national focus. They target specific groups affected by poverty such as children, people who are autistic, immigrants, or people who are homeless. Efforts to alleviate poverty use a disparate set of methods, such as advocacy, education, social work, legislation, direct service or charity, and community organizing.
Recent debates have centered on the need for policies that focus on both "income poverty" and "asset poverty."[134] Advocates for the approach argue that traditional governmental poverty policies focus solely on supplementing the income of the poor through programs such as Temporary Assistance for Needy Families (TANF, formerly Aid to Families with Dependent Children, AFDC) and Supplemental Nutrition Assistance Program (SNAP, formerly the Food Stamp Program). According to the CFED 2012 Assets & Opportunity Scorecard, 27 percent of households – nearly double the percentage that are income poor – are living in "asset poverty." These families do not have the savings or other assets to cover basic expenses (equivalent to what could be purchased with a poverty level income) for three months if a layoff or other emergency leads to loss of income. Since 2009, the number of asset poor families has increased by 21 percent from about one in five families to one in four families. In order to provide assistance to such asset poor families, Congress appropriated $24 million to administer the Assets for Independence Program under the supervision of the US Department for Health and Human Services. The program enables community-based nonprofits and government agencies to implement Individual Development Account or IDA programs, which are an asset-based development initiative. Every dollar accumulated in IDA savings is matched by federal and non-federal funds to enable households to add to their assets portfolio by buying their first home, acquiring a post-secondary education, or starting or expanding a small business.[135]
Additionally, the Earned Income Tax Credit (EITC or EIC) is a credit for people who earn low-to-moderate incomes. This credit allows them to get money from the government if their total tax outlay is less than the total credit earned, meaning it is not just a reduction in total tax paid but can also bring new income to the household. The Earned Income Tax Credit is viewed as the largest poverty reduction program in the United States. There is an ongoing debate in the U.S. about what the most effective way to fight poverty is, through the tax code with the EITC, or through the minimum wage laws.
Government safety-net programs put in place since the War on Poverty have helped reduce the poverty rate from 26% in 1967 to 16% in 2012, according to a Supplemental Poverty Model (SPM) created by Columbia University, while the official U.S. Poverty Rate has not changed, as the economy by itself has done little to reduce poverty. According to the 2013 Columbia University study which created the (SPM) method of measuring poverty, without such programs the poverty rate would be 29% today.[136] An analysis of the study by Kevin Drum suggests the American welfare state effectively reduces poverty among the elderly but provides relatively little assistance to the working-age poor.[137] A 2014 study by Pew Charitable Trusts shows that without social programs like food stamps, social security and the federal EITC, the poverty rate in the U.S. would be much higher.[138] Nevertheless, the U.S. has the weakest social safety net of all developed nations.[139][140][141] Sociologist Monica Prasad of Northwestern University argues that this developed because of government intervention rather than lack of it, which pushed consumer credit for meeting citizens' needs rather than applying social welfare policies as in Europe.[142]

See also[]
- Causes of poverty in the United States
- Eviction in the United States
- Income in the United States
- Income inequality in the United States
- Income deficit
- List of U.S. states and territories by poverty rate
- List of lowest-income places in the United States
- Lowest-income counties in the United States
- Homelessness in the United States
- Hunger in the United States
- Poor person
- Social programs in the United States
- Pathways out of Poverty (POP)
- Poverty and health in the United States
Other[]
- Human Poverty Index
- Mississippi Teacher Corps
- Basic Income
- Negative Income Tax
- Tipping Point Community
- Redistributive change
- De-industrialization crisis
- The Other America
- Two Americas
- Kids Against Hunger
- Can you hear their voices? (1931 play)
- Feminization of poverty
- Unintended pregnancy
- Social determinants of health in poverty
International[]
- Poverty by country
- International Ranking of Household Income
- List of Average Wages per Country
Notes[]
References[]
- ^ Zweig, Michael (2004). What's Class Got to do With It? : Society in the U.S.A. in the Twenty-first Century. ILR Press. ISBN 978-0-8014-8899-3.
- ^ Jump up to: a b c "Poverty Guidelines". Assistant Secretary of Health and Human Services for Planning and Evaluation. Retrieved August 15, 2021.
- ^ Schwartz, J. E. (2005). Freedom Reclaimed: Rediscovering the Vision of the United States. Baltimore: Johns Hopkins University Press. ISBN 978-0-8018-7981-4.
- ^ "What Are Poverty Thresholds And Poverty Guidelines? – INSTITUTE FOR RESEARCH ON POVERTY – UW–Madison". www.irp.wisc.edu. Retrieved December 10, 2019.
- ^ "Hull House Maps and Papers". florencekelley.northwestern.edu. Retrieved December 11, 2019.
- ^ O'Connor, Alice (2001). Poverty Knowledge: Social Science, Social Policy, and the Poor in Twentieth-Century U.S. History. Princeton University Press. ISBN 978-0-691-10255-9.
- ^ "Riis, Jacob". Social Welfare History Project. January 10, 2011. Retrieved December 11, 2019.
- ^ "Great Depression: American Social Policy". Social Welfare History Project. January 20, 2011. Retrieved December 11, 2019.
- ^ PATTERSON, James T. (June 30, 2009). America's Struggle against Poverty in the Twentieth Century. Harvard University Press. ISBN 978-0-674-04194-3.
- ^ "Economics & Poverty". depts.washington.edu. Retrieved December 10, 2019.
- ^ "::: Federal Emergency Relief Administration (FERA) Photographs of King County, 1933-1935 :::". content.lib.washington.edu. Retrieved December 10, 2019.
- ^ Poverty in 13 states is worse than we thought Washington Post November 8, 2013
- ^ Gabe, Thomas (January 29, 2015). "Poverty in the United States: 2013" (PDF). Congressional Research Service.
- ^ "US poverty on track to post record gain in 2009". Associated Press. April 13, 2009. Retrieved May 20, 2013.
- ^ Census data: Half of U.S. poor or low income. CBS News, December 15, 2011. Retrieved February 10, 2014.
- ^ Jana Kasperkevic (December 26, 2014). One in five millennials lives in poverty, report finds. The Guardian. Retrieved December 26, 2014.
- ^ Jump up to: a b Haymes, Stephen N.; de Haymes, María V.; Miller, Reuben J., eds. (2015). The Routledge Handbook of Poverty in the United States. London and New York: Routledge. pp. 2-4, 346. ISBN 978-0-41-567344-0.
- ^ Fisher, Max (April 15, 2013). Map: How 35 countries compare on child poverty (the U.S. is ranked 34th). The Washington Post. Retrieved February 16, 2014. See also: Child well-being in rich countries: A comparative overview. UNICEF office of Research. p. 7.
- ^ IMF warns the US over high poverty. BBC, June 22, 2016.
- ^ Alston, Philp (December 15, 2017). "Statement on Visit to the USA, by Professor Philip Alston, United Nations Special Rapporteur on extreme poverty and human rights". OHCHR. Retrieved December 24, 2017.
- ^ ""Contempt for the poor in US drives cruel policies," says UN expert". OHCHR. June 4, 2018. Retrieved June 5, 2018.
- ^ Horsley, Scott (September 16, 2020). "American Incomes Were Rising, Until The Pandemic Hit". NPR. Retrieved September 16, 2020.
Were it not for those survey problems, the Census Bureau estimates, median household income would have risen just 3.8% and the poverty rate would have registered as 11.1%.
- ^ Jason DeParle (October 15, 2020), "8 Million Have Slipped Into Poverty Since May as Federal Aid Has Dried Up", The New York Times
- ^ "How the Census Bureau Measures Poverty". census.gov. United States Census Bureau. Archived from the original on July 11, 2010. Retrieved September 16, 2015.
- ^ "2015 POVERTY GUIDELINES". hhs.gov. United States Department of Health and Human Services. Retrieved September 3, 2015.
- ^ Jump up to: a b "Poverty thresholds and poverty guidelines" (PDF). Focus. University of Wisconsin–Madison Institute for Research on Poverty. 19 (2): 6.
- ^ Orshansky, Mollie. "Children of the Poor" (PDF). Social Security Bulletin. July 1963.
- ^ Jump up to: a b c "Remembering Mollie Orshansky—The Developer of the Poverty Thresholds". Social Security Administration Research, Statistics, and Policy Analysis. Retrieved December 11, 2019.
- ^ Jump up to: a b c d "History of Poverty Thresholds". ASPE. November 23, 2015. Retrieved December 11, 2019.
- ^ Sidel, Ruth (November 1, 1998). Keeping Women and Children Last Revised. Penguin. ISBN 978-1-101-52281-3.
- ^ Schwarz, John E.; Volgy, Thomas J. (1993). The Forgotten Americans. W. W. Norton & Company. ISBN 978-0-393-31074-0.
- ^ Blank, Rebecca M. (July 17, 2008). "Why the United States Needs an Improved Measure of Poverty". Brookings. Retrieved August 31, 2018.
- ^ Citro, Constance; Michaels, Robert (1995). "Summary and Recommendations" (PDF). Measuring Poverty: A New Approach C. Citro and R. Michaels (Eds.). United States Census Bureau. p. 3.
- ^ "Poverty definition flawed, more accurate measure needed". chronicle.uchicago.edu. Retrieved December 11, 2019.
- ^ Short, Kathleen (March 10, 2015). "The Supplemental Poverty Measure: 2013" (PDF). census.gov. Archived (PDF) from the original on March 10, 2015. Retrieved December 11, 2019.
- ^ Gabe, Thomas (January 29, 2015). "Poverty in the United States: 2013" (PDF). Congressional Research Service.
- ^ Jump up to: a b Adams, J.Q.; Pearlie Strother-Adams (2001). Dealing with Diversity. Chicago, IL: Kendall/Hunt Publishing Company. ISBN 978-0-7872-8145-8.
- ^ Citation needed
- ^ "Many Families Struggle to Make Ends Meet, But Those With a Financial Plan Feel and Do Better · Consumer Federation of America". Consumer Federation of America. Retrieved December 11, 2019.
- ^ Hodgson, Godfrey (2005). America in Our Time: From World War II to Nixon--what Happened and why. Princeton University Press. p. 482. ISBN 978-0-691-12288-5.
- ^ "That Seventies Show". The Nation. October 20, 2010.
- ^ Fisher, Gordon M. "The Development of the Orshansky Poverty Thresholds and Their Subsequent History as the Official U.S. Poverty Measure". Poverty – Experimental Measures. U.S. Census Bureau. Retrieved January 11, 2012.
- ^ Fisher, Gordon M. (2008). "Remembering Mollie Orshansky – The Developer of the Poverty Thresholds". Social Security Bulletin. U.S. Social Security Administration Office of Retirement and Disability Policy. 68 (3): 79–83. PMID 19260619. Retrieved January 11, 2012.
- ^ Clauson, Annette (September 2000). "Despite Higher Food Prices, Percent of U.S. Income Spent on Food Remains Constant". Amber Waves (U.S. Department of Agriculture Economic Research Service). Archived from the original on July 11, 2016.
- ^ Schwarz, John E. (January 2, 2005). Freedom Reclaimed: Rediscovering the American Vision. JHU Press. p. 50. ISBN 978-0-8018-7981-4.
- ^ Jump up to: a b "California median home price". Retrieved July 6, 2006.[dead link]
- ^ "Monterey County income distribution". Archived from the original on February 12, 2020. Retrieved July 6, 2006.
- ^ Renwick, Trudi; Fox, Liana (September 13, 2016). "The Supplemental Poverty Measure: 2015". United States Census Bureau.
Number and Percentage of People in Poverty by State Using 3-Year Average Over 2013, 2014, and 2015
- ^ Cooper, David; Elise, Gould (November 17, 2011). "New poverty measure highlights positive effect of government assistance". Epi.org. Retrieved October 14, 2017.
- ^ "News Tip: Census Bureau's New Measure of Poverty Misses the Mark, Say Duke Experts". Today.duke.edu. Retrieved October 14, 2017.
- ^ Jonathan Rothwell (November 8, 2011). Why Heritage Is Wrong About Poverty in America. The New Republic Retrieved November 18, 2014.
- ^ Melissa Boteach and Donna Cooper (August 5, 2011). What You Need When You're Poor; Heritage Foundation Hasn't a Clue. Center For American Progress. Retrieved November 18, 2014
- ^ Courtland Milloy (September 13, 2011). Study dismisses poverty, but try telling that to the poor. The Washington Post. Retrieved November 18, 2014.
- ^ Katrina vanden Heuvel (July 28, 2011). Colbert Challenges the Poverty Deniers. The Nation Retrieved November 18, 2014.
- ^ Rector, Robert; Rachel, Sheffield (July 18, 2011). "Air Conditioning, Cable TV, and an Xbox: What is Poverty in the United States Today?". The Heritage Foundation. Retrieved July 27, 2011.
- ^ Timbro. "E.U. vs U.S.A" (PDF). Archived from the original (PDF) on November 15, 2016. Retrieved November 10, 2007.
- ^ Poor Poverty Yardsticks by Rea Hederman, Heritage Foundation, Washington Post. September 7, 2006. Accessed: February 18, 2007
- ^ Steven Pinker (February 9, 2018). "The Enlightenment is Working". Wall Street Journal. Retrieved February 11, 2018.
- ^ Richard V. Burkhauser; Kevin Corinth; James Elwell; Jeff Larrimore (December 2019). "Evaluating the Success of President Johnson's War on Poverty: Revisiting the Historical Record Using a Full-Income Poverty Measure". The National Bureau of Economic Research. Retrieved December 9, 2019.
- ^ http://www.gao.gov/new.items/d10240r.pdf Poverty Determination In U.S. Insular Areas. Retrieved August 30, 2019.
- ^ https://www.epa.gov/sites/production/files/2017-04/documents/american_samoa_visible_difference_final_report_2017.pdf EPA. Making a Visible Difference In American Samoa (Final Report). Retrieved August 30, 2019.
- ^ American FactFinder - American Samoa. Profile of Selected Economic Characteristics: 2010.
- ^ https://factfinder.census.gov/faces/tableservices/jsf/pages/productview.xhtml?pid=DEC_10_DPAS_ASDP3&prodType=table Archived February 14, 2020, at archive.today American FactFinder. Profile of Selected Economic Characteristics: 2010. 2010 American Samoa Demographic Profile Data. [Geography set to "Manu'a District, American Samoa"]. Retrieved August 30, 2019.
- ^ Jump up to: a b https://www.census.gov/quickfacts/fact/table/PR/ U.S. Census Bureau. QuickFacts - Puerto Rico. Retrieved July 4, 2020.
- ^ American FactFinder. U.S. Census Bureau. Selected economic characteristics - Commonwealth of the Northern Mariana Islands (2010). (URL unavailable).
- ^ https://www.census.gov/quickfacts/fact/table/comeriomunicipiopuertorico/ U.S. Census Bureau. QuickFacts - Comerio municipio, Puerto Rico. Retrieved July 4, 2020.
- ^ https://factfinder.census.gov/faces/tableservices/jsf/pages/productview.xhtml?pid=DEC_10_GUSF_PBG82&prodType=table Archived February 14, 2020, at archive.today Census.gov. American Factfinder. Guam. Poverty Status in 2009 by Age. Retrieved August 30, 2019.
- ^ https://factfinder.census.gov/faces/tableservices/jsf/pages/productview.xhtml?pid=DEC_10_MPSF_PBG82&prodType=table Archived February 14, 2020, at archive.today Census.gov. American Factfinder. Northern Mariana Islands. Poverty Status in 2009 by Age. Retrieved August 30, 2019.
- ^ http://factfinder.census.gov/faces/tableservices/jsf/pages/productview.xhtml?pid=DEC_10_VISF_PBG76&prodType=table Archived February 14, 2020, at archive.today Census.gov. American Factfinder. U.S. Virgin Islands. Poverty Status in 2009 by Age. Retrieved August 30, 2019.
- ^ Sagapolutele, Fili (March 2, 2017). "American Samoa Governor Says Small Economies 'Cannot Afford Any Reduction In Medicaid' | Pacific Islands Report". www.pireport.org. Retrieved June 29, 2019.
- ^ https://www.census.gov/quickfacts/NH Census.gov. Quick Facts. New Hampshire. Retrieved July 4, 2020.
- ^ https://www.census.gov/quickfacts/HI Census.gov. Quick Facts. Hawaii. Retrieved July 4, 2020.
- ^ https://www.census.gov/quickfacts/MD Census.gov. Quick Facts. Maryland. Retrieved July 4, 2020.
- ^ https://www.census.gov/quickfacts/MN Census.gov. Quick Facts. Minnesota. Retrieved July 4, 2020.
- ^ Renwick, Trudi; Fox, Liana (September 13, 2016). "The Supplemental Poverty Measure: 2015". United States Census Bureau.
Number and Percentage of People in Poverty by State Using 3-Year Average Over 2013, 2014, and 2015
- ^ https://www.census.gov/quickfacts/MS Census.gov. Quick Facts. Mississippi. Retrieved July 4, 2020.
- ^ Jump up to: a b c U.S. Census Bureau. Current Population Survey. Persons in Families by Family Structure, Age, and Sex, Iterated by Income-to-Poverty Ratio and Race: 2007: Below 100% of Poverty – All Races Archived September 30, 2008, at the Wayback Machine.
- ^ Jump up to: a b U.S. Census Bureau. Current Population Survey. People in Families by Family Structure, Age, and Sex, Iterated by Income-to-Poverty Ratio and Race: 2007: Below 100% of Poverty – White Alone Archived April 13, 2009, at the Wayback Machine.
- ^ Jump up to: a b "Poverty 3-Part 100_06". Pubdb3.census.gov. August 26, 2008. Archived from the original on June 12, 2011. Retrieved September 16, 2010.
- ^ "Poverty 2-Part 100_09". Pubdb3.census.gov. August 26, 2008. Archived from the original on January 8, 2010. Retrieved September 16, 2010.
- ^ Jump up to: a b "Poverty 1-Part 100_06". Pubdb3.census.gov. August 26, 2008. Archived from the original on June 12, 2011. Retrieved September 16, 2010.
- ^ "Poverty 1-Part 100_03". Pubdb3.census.gov. August 26, 2008. Archived from the original on January 8, 2010. Retrieved September 16, 2010.
- ^ "Poverty 1-Part 100_09". Pubdb3.census.gov. August 26, 2008. Archived from the original on June 12, 2011. Retrieved September 16, 2010.
- ^ Jump up to: a b c "Income and Poverty in the United States: 2014". U.S. Census Bureau
- ^ "Poverty Is a Persistent Reality for Many Rural Children in U.S. Archived March 26, 2010, at the Wayback Machine", William O'Hare (September 2009), Population Reference Bureau.
- ^ "Characteristics and Financial Circumstances of TANF Recipients – Fiscal Year 2009". United States Department of Health and Human Services.
- ^ Statistics derived from U.S. Census Bureau data; U.S. Department of Commerce, Bureau of Economic Analysis, Survey of Current Business; and DataQuick Information Systems, a public records database company located in La Jolla, San Diego, CA.
- ^ "Lakota People's Law Project". Lakotalaw.org. Retrieved October 14, 2017.
- ^ "Archived copy" (PDF). Archived from the original (PDF) on February 1, 2014. Retrieved January 17, 2014.CS1 maint: archived copy as title (link)
- ^ "Pine Ridge Statistics". 4aihf.org. Retrieved October 14, 2017.
- ^ https://factfinder.census.gov/faces/tableservices/jsf/pages/productview.xhtml?pid=ACS_17_5YR_S1901&prodType=table Archived February 14, 2020, at archive.today U.S. Census Bureau. American FactFinder. Income in the past 12 months (in 2017 inflation-adjusted dollars). 2013-2017 American Community Survey 5-year estimates. ["Geography" set to "All Places within United States and Puerto Rico".] Retrieved August 30, 2019.
- ^ "OECD (2008), Growing Unequal? : Income Distribution and Poverty in OECD Countries : COUNTRY NOTE: UNITED STATES" (PDF). Oecd.org. Retrieved October 14, 2017.
- ^ Bassuk, E.L., et al. (2011) America's Youngest Outcasts: 2010 Archived March 22, 2016, at the Wayback Machine (Needham, MA: The National Center on Family Homelessness) page 20
- ^ "Homeless children at record high in US. Can the trend be reversed?" Christian Science Monitor, December 13, 2011
- ^ Jump up to: a b "State of the Homeless 2012" Coalition for the Homeless, June 8, 2012
- ^ "600 homeless children in D.C., and no one seems to care" Archived July 28, 2013, at the Wayback Machine Washington Post, February 8, 2013
- ^ "3.5M Kids Under 5 On Verge Of Going Hungry
Study: 11 Percent Of U.S. Households Lack Food For Healthy Lifestyle" ("SHTML). Health. CBS NEWS. May 7, 2009. Retrieved May 8, 2009. - ^ "Hunger and Poverty Facts and Statistics". Feeding America.
- ^ Jump up to: a b Walker, Duncan (March 6, 2013). "The children going hungry in America". BBC News. Retrieved March 13, 2013.
- ^ Jump up to: a b "Poverty in 2013: When Even Diapers Are a Luxury". The Nation. September 11, 2013.
- ^ "Child Hunger Facts". Feeding America.
- ^ David Crary and Lisa Leff (November 17, 2014). New Report: Child Homelessness on the Rise in US. The Associated Press. Retrieved November 17, 2014.
- ^ Howard, Jacqueline (January 8, 2018). "Among 20 wealthy nations, US child mortality ranks worst, study finds". CNN. Retrieved January 11, 2018.
- ^ Cronholm PF, Forke CM, Wade R, Bair-Merritt MH, Davis M, Harkins-Schwarz M, Pachter LM, Fein JA. Adverse Childhood Experiences: Expanding the concept of adversity. American Journal of Preventive Medicine. 2015 Sep;49(3):354-61
- ^ US teens often forced to trade sex work for food, study finds. The Guardian. September 12, 2016.
- ^ Jump up to: a b Census.gov, (September, 2017) Income and Poverty in the United States: 2016. Retrieved from https://www.census.gov/content/dam/Census/library/publications/2017/demo/P60-259.pdf
- ^ Adams, R. H., (2004). Economic growth, inequality, and poverty: Estimating the growth elasticity of poverty, World Development 32(12), p. 1989-2014.
- ^ Jump up to: a b Western, B. & Pettit, B., (2010). Incarceration and social inequality. Daedalus, 139(3), 8-19
- ^ Jump up to: a b "U. S. Census: Income, Expenditures, Poverty and Wealth" (PDF). Retrieved March 20, 2010.
- ^ "Perspectives on Inequality and Opportunity from the Survey of Consumer Finances". Board of Governors of Federal Reserve System. Retrieved December 26, 2016.
- ^ "Information on Poverty and Income Statistics: A summary of 2014 Current Population Survey Data". Assistant Secretary for Planning and Evaluation. U.S. Department of Health and Human Services. September 16, 2014. Retrieved December 20, 2020.
- ^ "Archived copy" (PDF). Archived from the original (PDF) on June 7, 2012. Retrieved September 16, 2010.CS1 maint: archived copy as title (link)
- ^ "Trends in Family Wealth, 1989 to 2013". Congressional Budget Office. August 18, 2016.
- ^ Center for the Future of Children, The Future of Children. Vol. 7, No 2, 1997.
- ^ "Archived copy". Archived from the original on January 2, 2007. Retrieved December 27, 2006.CS1 maint: archived copy as title (link)
- ^ Amy Joyce, "The Bias Breakdown," The Washington Post, December 9, 2005, p. D01 citing Gallop Poll data.
- ^ Jared Bernstein (January 13, 2014). Poverty and Inequality, in Charts. The New York Times Retrieved September 20, 2014.
- ^ Elise Gould (January 15, 2014). No Matter How We Measure Poverty, the Poverty Rate Would Be Much Lower If Economic Growth Were More Broadly Shared. Economic Policy Institute. Retrieved September 20, 2014.
- ^ Summers, Lawrence (January 18, 2015). "Focus on growth for the middle class". Washingtonpost.com.
- ^ "The Social Benefits and Economic Costs of Taxation" (PDF). Retrieved December 20, 2007.
- ^ The Swiss education system swissworld.org, Retrieved on June 23, 2009
- ^ "Tax Foundation". Tax Foundation. Retrieved October 14, 2017.
- ^ Bruce Western (May 2011). "Poverty Politics and Crime Control in Europe and America". Contemporary Sociology. 40 (3): 283–286. doi:10.1177/0094306110404514d. JSTOR 23042281. S2CID 17527457.
- ^ Tom Hall (February 13, 2015).Study says US jails have become "massive warehouses" for the poor. World Socialist Web Site. Retrieved February 15, 2015.
- ^ Charles Murray (1998). Income Inequality and IQ. Washington: AEI Press.
- ^ Hu, Meng (September 24, 2012). "Income Inequality and IQ, by Charles Murray". Menghublog.wordpress.com. Retrieved October 14, 2017.
- ^ The Bell Curve#Criticisms
- ^ Loïc Wacquant. Prisons of Poverty. University of Minnesota Press (2009). ISBN 0816639019. pp. 11-14.
- ^ "Weekend Read: Intellectual Racism". The SPLC, April 22, 2017.
- ^ Temin, Peter (2017). The Vanishing Middle Class: Prejudice and Power in a Dual Economy. MIT Press. ISBN 9780262036160.
- ^ Pilkington, Ed (September 5, 2017). "Hookworm, a disease of extreme poverty, is thriving in the US south. Why?". The Guardian. Retrieved September 6, 2017.
- ^ Smith, Catharine (January 30, 2018). "Why The U.S., One Of The World's Richest Countries, Struggles With Diseases Of Poverty". The Huffington Post. Retrieved January 30, 2018.
- ^ Kevin Drum (26 September 2013). We Can Reduce Poverty If We Want To. We Just Have To Want To. Mother Jones. Retrieved 28 September 2013.
- ^ "2016 A&O Scorecard". CFED Assets & Opportunity Scorecard. Archived from the original on August 2, 2013.
- ^ "Archived copy". Archived from the original on May 6, 2013. Retrieved April 23, 2013.CS1 maint: archived copy as title (link)
- ^ Zachary A. Goldfarb (December 9, 2013). Study: U.S. poverty rate decreased over past half-century thanks to safety-net programs. The Washington Post. Retrieved January 20, 2015.
- ^ Drum, Kevin (December 9, 2013). New Study Says Poverty Rate Hasn't Budged For 40 Years. Mother Jones. Retrieved February 15, 2014.
- ^ Jana Kasperkevic (November 12, 2014). Welfare programs shown to reduce poverty in America. The Guardian. Retrieved December 27, 2014.
- ^ Kenworthy, L. (1999). "Do Social-Welfare Policies Reduce Poverty? A Cross-National Assessment" (PDF). Social Forces. 77 (3): 1119–1139. doi:10.1093/sf/77.3.1119.
- ^ Bradley, D., E. Huber, S. Moller, F. Nielsen, and J. D. Stephens (2003). "Determinants of Relative Poverty in Advanced Capitalist Democracies". American Sociological Review. 68 (1): 22–51. doi:10.2307/3088901. JSTOR 3088901.CS1 maint: multiple names: authors list (link)
- ^ Gould, Elise and Wething, Hilary (July 24, 2012). "U.S. poverty rates higher, safety net weaker than in peer countries." Economic Policy Institute. Retrieved February 11, 2014.
- ^ Monica Prasad, The Land of Too Much: American Abundance and the Paradox of Poverty, (Harvard University Press, 2012), ISBN 0674066529
Bibliography and further reading[]
- Abramsky, Sasha (2013). The American Way of Poverty: How the Other Half Still Lives. Nation Books. ISBN 978-1568587264.
- Alston, Philip. (2018) Report of the Special Rapporteur on extreme poverty and human rights on his mission to the United States of America OHCHR.
- Baradaran, Mehrsa (2015). How the Other Half Banks: Exclusion, Exploitation, and the Threat to Democracy. Harvard University Press. ISBN 9780674286061
- Caudill, Harry (1962). Night Comes to the Cumberlands. Little, Brown and Company. ISBN 978-0-316-13212-1.
- , "How to Fix Child Poverty" (review of Jeff Madrick, Invisible Americans: The Tragic Cost of Child Poverty, Knopf, 2020, ISBN 9780451494184, 231 pp.; and A Roadmap to Reducing Child Poverty: a report by the National Academies of Sciences, Engineering, and Medicine, edited by Greg Duncan and , National Academies Press, 596 pp., free PDF available at nap.edu/25246), The New York Review of Books, vol. LXVII, no. 12 (23 July 2020), pp. 33–35.
- Desmond, Matthew (2016). Evicted: Poverty and Profit in the American City. Crown Publishing Group. ISBN 0553447432
- Edin, Kathryn and Lein, Laura (1997). Making Ends Meet: How Single Mothers Survive Welfare and Low-Wage Work. Russell Sage Foundation. ISBN 087154234X
- Edin, Kathryn and H. Luke Shaefer (2016). $2.00 a Day: Living on Almost Nothing in America. Mariner Books. ISBN 978-0544811959
- Ehrenreich, Barbara (2001). Nickel and Dimed: On (Not) Getting By in America. Metropolitan Books. ISBN 0-8050-8838-5
- Hatcher, Daniel L. (2016). The Poverty Industry: The Exploitation of America's Most Vulnerable Citizens. NYU Press. ISBN 978-1479874729.
- Harrington, Michael (1962). The Other America. Macmillan. ISBN 978-0-684-82678-3.
- Haymes, Stephen, Maria Vidal de Haymes and Reuben Miller (eds). The Routledge Handbook of Poverty in the United States. Routledge, 2015. ISBN 0415673445.
- Hedges, Chris and Sacco, Joe (2012). Days of Destruction, Days of Revolt. Nation Books. ISBN 1568586434
- Howe, Louise Kapp, ed. (1970). The White Majority: between Poverty and Affluence, in series, Vintage Book[s]. New York: New York: Random House. xii, 303 p. SBN 394-71666-3
- Katz, Michael B (2013). The Undeserving Poor: America's Enduring Confrontation with Poverty: Fully Updated and Revised. Oxford University Press; 2 edition. ISBN 0199933952
- Lyon-Callo, Vincent (2004). Inequality, Poverty, and Neoliberal Governance: Activist Ethnography in the Homeless Sheltering Industry. University of Toronto Press. ISBN 1442600861
- Prasad, Monica (2012). The Land of Too Much: American Abundance and the Paradox of Poverty. Harvard University Press. ISBN 0674066529
- Sarnoff, Susan; Yoon, Hong-Sik (2003). "Central Appalachia – Still the Other America". Journal of Poverty. The Haworth Press. 7 (1 & 2): 123–139. doi:10.1300/J134v07n01_06. S2CID 145175350. Archived from the original on February 22, 2007.
- Sciandra, M., Sanbonmatsu, L., Duncan, G. J., Gennetian, L. A., Katz, L. F., Kessler, R. C., et al. (2013). Long-term effects of the Moving to Opportunity residential mobility experiment on crime and delinquency. Journal of Exp Criminol 9, 451–489.
- Shipler, David K (2004). The Working Poor :Invisible in America, Knopf.
- Wacquant, Loïc (2009). Prisons of Poverty. University of Minnesota Press. ISBN 0816639019
- ——— (2009). Punishing the Poor: The Neoliberal Government of Social Insecurity. Duke University Press. ISBN 082234422X
- Videos
- "Why is there still poverty in America?". The Economist. October 1, 2019. // Accompanied article: "Poverty in America". The Economist. October 1, 2019.
External links[]
This section's use of external links may not follow Wikipedia's policies or guidelines. (August 2021) |
| Wikiquote has quotations related to: Poverty in the United States |
- U.S. Census Bureau Poverty Definition
- U.S. Census Bureau Poverty in the United States
- Child Poverty and Tax: a simple graph of child disposable income disparity in OECD countries against tax burdens.
- From Poverty to Prosperity: A National Strategy to Cut Poverty in Half, The Center for American Progress, April 2007.
- Explanation of poverty definition by economist Ellen Frank in Dollars & Sense magazine, January/February 2006
- "Deciding Who's Poor" by economist Barbara Bergmann in Dollars & Sense magazine, March/April 2000
- 37 million poor hidden in the land of plenty
- David Walls, Models of Poverty and Planned Change
- U.S. Government Does Relatively Little to Lessen Child Poverty Rates
- U.S. Department of Health & Human Services Poverty Guidelines, Research, and Measurement
- Cities Tolerate Homeless Camps by Jennifer Levitz, The Wall Street Journal, August 11, 2009
- The Forgotten Americans PBS series by Hector Galan about colonias.
- Americans living in Third World conditions This article discusses the living conditions of people inhabiting colonias (with pictures).
- Steve Suitts, "The Worst of Times: Children in Extreme Poverty in the South and Nation," Southern Spaces, June 29, 2010.
- 80 Percent Of U.S. Adults Face Near-Poverty, Unemployment: Survey—Huffington Post, July 28, 2013
- The American Way of Poverty: As Inequality Hits Record High, Sasha Abramsky on the Forgotten Poor. DemocracyNow! September 12, 2013.
- America's Shameful Poverty Stats, Sasha Abramsky. The Nation, September 18, 2013.
- How Much Money to End Poverty in America? Truthdig. September 26, 2013.
- Poverty in the United States: 2012 Congressional Research Service
- It Is Expensive to Be Poor. The Atlantic. January 13, 2014.
- Here's The Painful Truth About What It Means To Be 'Working Poor' In America. The Huffington Post, May 19, 2014.
- 10 Poverty Myths, Busted. Mother Jones, March/April 2014 issue.
- FPL Calculator, A mobile app for calculating federal poverty level.
- The Poor Get Prison. Institute for Policy Studies, 2015.
- Measuring the impact of poverty in education, EducationDive, August 8, 2016
- Americans Haven’t Been This Poor and Indebted in Decades. New York. January 5, 2018.
show
|
|---|
- Poverty in the United States