Raster graphics
This article needs additional citations for verification. (November 2016) |
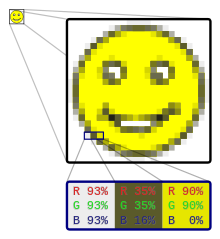
In computer graphics and digital photography, a raster graphic is a bitmap image that represents a generally rectangular grid of pixels, viewable via a computer display, paper, or other display medium. A raster is technically characterized by the width and height of the image in pixels and by the number of bits per pixel. Raster images are stored in image files with varying dissemination, production, generation, and acquisition formats.
The printing and prepress industries know raster graphics as contones (from continuous tones). In contrast, line art is usually implemented as vector graphics in digital systems.[1]
Common pixel formats are monochrome, gray scale, palettized, and full color, where color depth[2] determines the fidelity of the colors represented and color space determines the range of color coverage (which is often less than the full range of human color vision). High-resolution digital images are storage intensive, especially at high color-depths. The large CCD bitmapped sensor at the Vera C. Rubin Observatory captures 3.2 gigapixels in a single image (6.4 GB raw), over six color channels which exceed the spectral range of human color vision. During production, a raster image might exist at a variety of different resolutions and color-depths for reasons of storage and bandwidth management.
Vector images (line work) can be rasterized (converted into pixels), and raster images vectorized (raster images converted into vector graphics), by software. In both cases some information is lost, although certain vectorization operations can recreate salient information, as in the case of optical character recognition.
Early mechanical televisions developed in the 1920s employed rasterization principles. Electronic television based on cathode-ray tube displays are raster scanned with horizontal rasters painted left to right, and the raster lines painted top to bottom (the top of a computer monitor is most commonly referenced to landscape orientation, while the top of a printed page is most commonly referenced to portrait orientation; going against the flow requires image rotation). Left-right within top-bottom remains the conventional pixel organization in the majority of bitmapped file formats and rasterized display interconnects such as VGA and DVI.
Many raster manipulations map directly onto the mathematical formalisms of linear algebra, where mathematical objects of matrix structure are of central concern.
Etymology[]
The word "raster" has its origins in the Latin rastrum (a rake), which is derived from radere (to scrape). It originates from the raster scan of cathode ray tube (CRT) video monitors, which paint the image line by line by magnetically or electrostatically steering a focused electron beam.[3] By association, it can also refer to a rectangular grid of pixels. The word rastrum is now used to refer to a device for drawing musical staff lines.
Applications[]
Computer displays[]
Most modern computers have bitmapped displays, where each on-screen pixel directly corresponds to a small number of bits in memory.[4] The screen is refreshed simply by scanning through pixels and coloring them according to each set of bits. The refresh procedure, being speed critical, is often implemented by dedicated circuitry, often as a part of a graphics processing unit.
Using this approach, the computer contains an area of memory that holds all the data that are to be displayed. The central processor writes data into this region of memory and the video controller collects them from there. The bits of data stored in this block of memory are related to the eventual pattern of pixels that will be used to construct an image on the display.[5]
An early scanned display with raster computer graphics was invented in the late 1960s by A. Michael Noll at Bell Labs,[6] but its patent application filed February 5, 1970 was abandoned at the Supreme Court in 1977 over the issue of the patentability of computer software.[7]
Image storage[]

Most computer images are stored in raster graphics formats or compressed variations, including GIF, JPEG, and PNG, which are popular on the World Wide Web.[2][8] A raster data structure is based on a (usually rectangular, square-based) tessellation of the 2D plane into cells. In the example the cells of tessellation A are overlaid on the point pattern B resulting in an array C of quadrant counts representing the number of points in each cell. For purposes of visualization a lookup table has been used to color each of the cells in an image D. Here are the numbers as a simple vector in row/column order:
1 3 0 0 1 12 8 0 1 4 3 3 0 2 0 2 1 7 4 1 5 4 2 2 0 3 1 2 2 2 2 3 0 5 1 9 3 3 3 4 5 0 8 0 2 4 3 2 8 4 3 2 2 7 2 3 2 10 1 5 2 1 3 7
Finally, here is a run-length encoded representation of the raster, which has 55 positions:
| values | 1 | 3 | 0 | 1 | 12 | 8 | 0 | 1 | 4 | 3 | ... |
|---|---|---|---|---|---|---|---|---|---|---|---|
| lengths | 1 | 1 | 2 | 1 | 1 | 1 | 1 | 1 | 1 | 2 | ... |
This process clearly results in a loss of information, from the real-valued coordinates of the points, through the integer cell counts, to the ordinal colors, but there are also gains:
- The data structure is usually more compact,
- The raster is easy to visualize, and
- It can be related to other rasters provided the locations and resolutions are properly conflated.
- It is separately dividing sections of the plane.
Three-dimensional voxel raster graphics are employed in video games and are also used in medical imaging such as MRI scanners.[9]
Geographic information systems[]
GIS data is commonly stored in a raster format to encode geographic data as the pixel values. Georeferencing information can also be associated with pixels.
Resolution[]
This section needs additional citations for verification. (November 2016) |
Raster graphics are resolution dependent, meaning they cannot scale up to an arbitrary resolution without loss of apparent quality. This property contrasts with the capabilities of vector graphics, which easily scale up to the quality of the device rendering them. Raster graphics deal more practically than vector graphics with photographs and photo-realistic images, while vector graphics often serve better for typesetting or for graphic design. Modern computer-monitors typically display about 72 to 130 pixels per inch (PPI), and some modern consumer printers can resolve 2400 dots per inch (DPI) or more; determining the most appropriate image resolution for a given printer-resolution can pose difficulties, since printed output may have a greater level of detail than a viewer can discern on a monitor. Typically, a resolution of 150 to 300 PPI works well for 4-color process (CMYK) printing.
However, for printing technologies that perform color mixing through dithering (halftone) rather than through overprinting (virtually all home/office inkjet and laser printers), printer DPI and image PPI have a very different meaning, and this can be misleading. Because, through the dithering process, the printer builds a single image pixel out of several printer dots to increase color depth, the printer's DPI setting must be set far higher than the desired PPI to ensure sufficient color depth without sacrificing image resolution. Thus, for instance, printing an image at 250 PPI may actually require a printer setting of 1200 DPI.[10]
Raster-based image editors[]
This section does not cite any sources. (November 2016) |
Raster-based image editors, such as PaintShop Pro, Corel Painter, Adobe Photoshop, Paint.NET, Microsoft Paint, and GIMP, revolve around editing pixels, unlike vector-based image editors, such as Xfig, CorelDRAW, Adobe Illustrator, or Inkscape, which revolve around editing lines and shapes (vectors). When an image is rendered in a raster-based image editor, the image is composed of millions of pixels. At its core, a raster image editor works by manipulating each individual pixel.[8] Most[citation needed] pixel-based image editors work using the RGB color model, but some also allow the use of other color models such as the CMYK color model.[11]
See also[]
- Comparison of raster graphics editors
- Dither
- Halftone
- Pixel-art scaling algorithms
- Raster graphics editor
- Raster graphics file formats
- Raster image processor
- Raster scan
- Rasterisation
- Text semigraphics
- Texture atlas
- Vector graphics - a contrasting graphics method
References[]
- ^ "Patent US6469805 - Post raster-image processing controls for digital color image printing". Google.nl. Retrieved 30 November 2014.
- ^ Jump up to: a b "Types of Bitmaps". Microsoft Docs. Microsoft. 29 March 2017. Retrieved 1 January 2019.
The number of bits devoted to an individual pixel determines the number of colors that can be assigned to that pixel. For example, if each pixel is represented by 4 bits, then a given pixel can be assigned one of 16 different colors (2^4 = 16).
- ^ Bach, Michael; Meigen, Thomas; Strasburger, Hans (1997). "Raster-scan cathode-ray tubes for vision research – limits of resolution in space, time and intensity, and some solutions". Spatial Vision. 10 (4): 403–14. doi:10.1163/156856897X00311. PMID 9176948.
- ^ "bitmap display from FOLDOC". Foldoc.org. Retrieved 30 November 2014.
- ^ Murray, Stephen. "Graphic Devices." Computer Sciences, edited by Roger R. Flynn, vol. 2: Software and Hardware, Macmillan Reference USA, 2002, pp. 81-83. Gale eBooks, https://link-gale-com.libaccess.lib.mcmaster.ca/apps/doc/CX3401200218/GVRL?u=ocul_mcmaster&sid=GVRL&xid=acaf5d43. Accessed 3 Aug. 2020.
- ^ Noll, A. Michael (March 1971). "Scanned-Display Computer Graphics". Communications of the ACM. 14 (3): 143–150. doi:10.1145/362566.362567.
- ^ "Patents". Noll.uscannenberg.org. Retrieved 30 November 2014.
- ^ Jump up to: a b "Raster vs Vector". Gomez Graphics Vector Conversions. Retrieved 1 January 2019.
Raster images are created with pixel-based programs or captured with a camera or scanner. They are more common in general such as jpg, gif, png, and are widely used on the web.
- ^ "CHAPTER-1". Cis.rit.edu. Retrieved 30 November 2014.
- ^ Fulton, Wayne (April 10, 2010). "Color Printer Resolution". A few scanning tips. Retrieved August 21, 2011.
- ^ "Print Basics: RGB Versus CMYK". HP Tech Takes. HP. 12 June 2018. Retrieved 1 January 2019.
If people are going to see it on a computer monitor, choose RGB. If you’re printing it, use CMYK. (Tip: In Adobe® Photoshop®, you can choose between RGB and CMYK color channels by going to the Image menu and selecting Mode.)
| hide | |
|---|---|
| Raster |
|
| Raw | |
| Vector | |
| Compound | |
| Metadata |
|
| |
- Raster graphics
- Computer graphics data structures
- Graphics file formats
- Digital geometry