Results of the 2015 Canadian federal election

From Wikipedia, the free encyclopedia
2015 Canadian federal election
Canada
← 2011 19 October 2015 2019 →
Party Leader % Seats +/–
Liberal Justin Trudeau 39.5% 184 +148
Conservative Stephen Harper 31.9% 99 -60
New Democratic Tom Mulcair 19.7% 44 -51
Bloc Québécois Gilles Duceppe 4.7% 10 +8
Green Elizabeth May 3.5% 1 -1
This lists parties that won seats. See the complete results below.
Prime Minister before Prime Minister after
Stephen Harper Stephen Harper
Conservative
Justin Trudeau
Liberal
Justin Trudeau

The 42nd Canadian federal election was held on October 19, 2015. The incumbent Conservative Party of Canada of Prime Minister Stephen Harper, in office since 2006, was defeated by the Liberal Party of Canada under the leadership of Justin Trudeau. The Liberals rebounded from third place in the House of Commons with 36 seats to a strong majority government with 184 of the 338 seats in the expanded Commons. The Liberals picked up 148 seats, easily the biggest numerical increase for a Canadian party since Confederation.

Result overview[]

184 99 44 10 1
Liberal Conservative New Democratic BQ G
A polling station on election day

At 9:41pm EDT, October 19, 2015, CBC News projected that the Liberals had won at least a minority government, and that leader Justin Trudeau would become the next Prime Minister of Canada. Less than an hour later, at 10:36pm EDT, CBC News projected a Liberal majority. The New Democratic Party lost more than half the seats they had held, with Tom Mulcair becoming the first major party leader to concede defeat. The Conservatives dropped down to 99 seats to form the main opposition party, and Stephen Harper resigned as leader of the Conservative Party. The Bloc Québécois regained some ridings they had lost in the previous election, but party leader Giles Duceppe failed to regain the seat he lost back in 2011. Green Party leader Elizabeth May kept her seat.[1]

According to preliminary figures from Elections Canada, more than 68 per cent of eligible voters cast a ballot, or about 17,546,697 registered electors—a seven percentage point increase from the 2011 federal election, when turnout was just more than 61 per cent.[2]

Summary analysis[]

Party Votes Seats
Liberal 6,930,136
39.5%
Increase 20.6%
184 / 338 (54%)
Conservative 5,600,496
31.9%
Decrease 7.7%
99 / 338 (29%)
New Democratic 3,461,262
19.7%
Decrease 10.9%
44 / 338 (13%)
Bloc Québécois 818,652
4.7%
Decrease 1.2%
10 / 338 (3%)
Green 605,864
3.4%
Decrease 0.5%
1 / 338 (0.3%)
The disproportionality of parliament in the 2015 election was 12.02 according to the Gallagher Index, mainly in the Liberals' favour.
Elections to the 42nd Parliament of Canada – seats won/lost by party, 2011–2015
Party 2011
(redist.)
Gain from (loss to) 2015
Lib Con NDP BQ Grn
Liberal 36 96 51 1 184
Conservative 188 (96) (3) 99
New Democratic 109 (51) 3 (7) 44
Bloc Québécois 4 (1) 7 10
Green 1 1
Total 338 (148) 99 55 (6) 338
Party candidates in 2nd place[3]
Party in 1st place Party in 2nd place Total
Lib Con NDP BQ Grn Ind
Liberal 111 64 8 1 184
Conservative 81 18 99
New Democratic 29 11 3 1 44
Bloc Québécois 8 2 10
Green 1 1
Total 118 123 84 11 1 1 338
Principal races, according to 1st and 2nd-place results[3]
Parties Seats
 Liberal  Conservative 192
 Liberal  New Democratic 93
 Conservative  New Democratic 29
 Liberal  Bloc Québécois 16
 New Democratic  Bloc Québécois 5
 Liberal  Independent 1
 Conservative  Green 1
 New Democratic  Green 1
Total 338
Seats won, by share of vote going to winning candidate[4]
Party in 1st place >50% 45-49.9% 40-44.9% 35-39.9% <35% Total
Liberal 87 48 26 13 10 184
Conservative 42 24 20 8 5 99
New Democratic 3 4 12 14 11 44
Bloc Québécois 2 1 7 10
Green 1 1
Total 133 76 60 36 33 338

Detailed analysis[]

Turnout[]

The election was notable for seeing voter turnout rise across all ages and sexes, and especially significant for the rise in younger voters. In particular, there was an increase of 1.2 million voters among those under the age of 35.[5]

Voter turnout by age and sex, %, 2015 vs 2011[6][7]
Age 2015 2011 ∆%
Total Male Female Total Male Female Total Male Female
Canada 66.1 64.1 68.0 58.5 57.3 59.6 Increase7.6 Increase4.5 Increase8.4
18 to 24 years 57.1 53.8 60.5 38.8 36.9 40.9 Increase18.3 Increase16.9 Increase19.6
1st time voters 58.3 54.9 61.9 40.5 38.4 42.8 Increase17.7 Increase16.4 Increase19.1
Not 1st time 55.1 52.0 58.3 37.8 36.0 39.8 Increase17.3 Increase16.0 Increase18.5
25 to 34 years 57.4 54.3 60.5 45.1 42.5 47.7 Increase12.3 Increase11.8 Increase12.8
35 to 44 years 61.9 58.7 65.1 54.5 51.5 47.5 Increase7.4 Increase4.2 Increase17.6
45 to 54 years 66.6 63.6 69.6 64.5 62.1 66.9 Increase2.1 Increase1.5 Increase2.7
55 to 64 years 73.7 71.4 76.0 71.5 70.7 72.2 Increase2.3 Increase0.7 Increase3.8
65 to 74 years 78.8 79.0 78.6 75.1 77.4 73.1 Increase3.7 Increase1.6 Increase5.5
75 years and over 67.4 74.1 62.8 60.3 69.5 54.2 Increase7.1 Increase4.6 Increase8.6

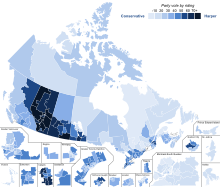
Geographic voting distributions[]

Party summaries[]

Liberals[]

In the previous election, the Liberals were cut down to 34 seats, the fewest they had ever won in their history. It was the first time since the nation's founding that the Liberals had not been either in government or the Official Opposition. They picked up one additional seat in a by-election and one via a floor-crossing.

While the Liberals had been expected to regain much of what they had lost in 2011, they tallied the second-best performance in their history; the 184 seats was bettered only by the 191 they won in 1949. It was also the most seats that a party had won since the Progressive Conservatives won a record 211 in 1984.

The Liberal victory came mainly on the strength of a solid performance in the eastern part of the country. They took every seat in Atlantic Canada and Toronto, and won all but one seat in Ottawa. Most notably, they won 40 of Quebec's 78 seats, mostly on the strength of taking all but five seats in Montreal. It was the first time since 1980 that the Liberals had won the most seats in Quebec.

After going into the election with only four seats west of Ontario, the Liberals had their best showing in Western Canada in more than two decades. They not only took all but one seat in Winnipeg and all but two seats in Vancouver, but won seats in Alberta for the first time since 2004. Notably, they won two seats in Calgary; they had won only three seats there in their entire history prior to 2015, with their last win dating back to 1968. They were the only party to win seats in every province.

Conservatives[]

The Conservatives lost 60 seats to become the Official Opposition. They held their own in their heartlands of rural western Canada and central Ontario, and managed a respectable showing in southwestern Ontario and the more rural areas of eastern Ontario. However, they suffered heavy losses in urban southern Ontario, a region which had swung heavily to them in 2011. They lost all of their seats in Toronto itself and all but three in the 905 region. They also lost all of their seats in Winnipeg and Vancouver, as well as Atlantic Canada. It is the first time in decades that there are no centre-right MPs east of Quebec. They did, however, manage to make some gains in francophone areas of Quebec, mostly at the expense of the NDP.

Several members of Harper's cabinet were defeated, including Bernard Valcourt, Leona Aglukkaq, Gail Shea, Chris Alexander, Joe Oliver and Julian Fantino among others.

New Democrats[]

The NDP, the Official Opposition in the previous parliament, fell to third place with 44 seats, losing more than half of their caucus. For the most part, their support bled over to the Liberals, though they lost a few areas of francophone Quebec to the Conservatives and Bloc.

Bloc Québecois[]

The Bloc made a modest recovery after being nearly decimated in 2011, rebounding to 10 seats. However, Gilles Duceppe, who had been the longest-serving party leader in Canada at the time of his defeat in 2011, failed to win back his old seat of Laurier—Sainte-Marie. The party also received a smaller share of the popular vote than in the last election. As such, their gains could be attributable to NDP-Liberal vote splitting in francophone ridings more than a surge in popular support.

Contributing factors to party success[]

The parties had varying degrees of success by region and by socioeconomic factors. An analysis by The Globe and Mail shortly after the election was held revealed significant differences:[8]

Party support arising from certain key factors by region in the Canadian general election (2015), as a proportion of the ridings won
Region Income (Median household) Unemployment rate Visible minority population
<$35,810 $35,810–$141,720 >$141,720 Low (4%–6%) High (9%–22%) Low (<2.41%) High (>26.8%)
Atlantic
100%
100%
100%
100%
100%
100%
100%
Quebec
50%
27%
14%
9%
46%
14%
21%
18%
83%
17%
44%
16%
24%
16%
71%
21%
4%
4%
28%
25%
31%
17%
92%
8%
Ontario
67%
33%
64%
6%
30%
69%
2%
29%
56%
3%
42%
72%
13%
15%
37%
11%
53%
91%
2%
7%
Prairies
33%
33%
33%
23%
10%
68%
12%
4%
84%
18%
7%
75%
67%
33%
22%
78%
40%
60%
British Columbia
25%
50%
25%
41%
33%
22%
4%
57%
14%
29%
53%
26%
16%
5%
27%
47%
27%
N/A
65%
29%
6%
The North
100%
100%
100%
100%
100%
100%
100%

Results by province[]

Party name BC AB SK MB ON QC NB NS PE NL YT NT NU Total
     Liberal Seats: 17 4 1 7 80 40 10 11 4 7 1 1 1 184
Vote: 35.2 24.6 23.9 44.6 44.8 35.7 51.6 61.9 58.3 64.5 53.6 48.3 47.2 39.5
     Conservative Seats: 10 29 10 5 33 12 99
Vote: 30.0 59.5 48.5 37.3 35.0 16.7 25.3 17.9 19.3 10.3 24.0 18.0 24.8 31.9
     New Democratic Party Seats: 14 1 3 2 8 16 44
Vote: 25.9 11.6 25.1 13.8 16.6 25.4 18.3 16.4 16.0 21.0 19.5 30.8 26.5 19.7
     Bloc Québécois Seats: 10 10
Vote: 19.3 4.7
     Green Seats: 1 1
Vote: 8.2 2.5 2.1 3.2 2.9 2.3 4.6 3.4 6.0 1.1 2.9 2.8 1.5 3.4
     Independent and no affiliation Vote: 0.1 0.8 0.2 0.6 0.2 0.1 0.1 0.3 2.9 0.2
Total seats 42 34 14 14 121 78 10 11 4 7 1 1 1 338

10 closest ridings[]

Electoral district 1st-place candidate 2nd-place candidate Won by Confirmed on recount[9]
Elmwood—Transcona MB Daniel Blaikie Lawrence Toet 61 votes
Desnethé—Missinippi—Churchill River SK Georgina Jolibois Lawrence Joseph 71 votes Green tickY
Barrie—Springwater—Oro-Medonte ON Alex Nuttall Brian Tamblyn 86 votes Green tickY
Edmonton Mill Woods AB Amarjeet Sohi Tim Uppal 92 votes Green tickY
Regina—Lewvan SK Erin Weir Trent Fraser 132 votes
Hastings—Lennox and Addington ON Mike Bossio Daryl Kramp 225 votes
Kitchener—Conestoga ON Harold Albrecht Tim Louis 251 votes
Montmagny—L'Islet—Kamouraska—Rivière-du-Loup QC Bernard Généreux Marie-Josée Normand 272 votes Green tickY
Kootenay—Columbia BC Wayne Stetski David Wilks 282 votes
Jonquière QC Karine Trudel Marc Pettersen 339 votes

Retiring & defeated incumbents[]

Notional gains[]

As a result of the 2012 federal electoral redistribution, thirty new ridings were added and many riding boundaries were changed, so several incumbent MPs who ran chose to do so in new ridings. The following table identifies the subsequent nominees in their old ridings and who they lost to.

Electoral District, with 2011 redistributed result Incumbent at dissolution and subsequent nominee New MP
Alberta   Edmonton Mill Woods   Mike Lake Tim Uppal   Amarjeet Sohi
British Columbia   Burnaby North—Seymour   Kennedy Stewart Carol Baird Ellan   Terry Beech
  North Island—Powell River   John Duncan Laura Smith   Rachel Blaney
  Steveston—Richmond East   Kerry-Lynne Findlay Kenny Chiu   Joe Peschisolido
Ontario   Bay of Quinte   Daryl Kramp Jodie Jenkins   Neil Ellis
  Brampton East   Bal Gosal Naval Bajaj   Raj Grewal
  Brampton West   Kyle Seeback Ninder Thind   Kamal Khera
  Don Valley East   Joe Daniel Maureen Harquail   Yasmin Ratansi
  Hamilton West—Ancaster—Dundas   David Sweet Vincent Samuel   Filomena Tassi
  Nepean   Pierre Poilievre Andy Wang   Chandra Arya
  Oakville North—Burlington   Lisa Raitt Effie Triantafilopoulos   Pam Damoff
  Richmond Hill   Costas Menegakis Michael Parsa   Majid Jowhari
Quebec   Argenteuil—La Petite-Nation   Mylène Freeman Chantal Crête   Stéphane Lauzon
  Marc-Aurèle-Fortin   Alain Giguère Marie-Josée Lemieux   Yves Robillard
  Repentigny   Jean-François Larose Johnathan Cloutier   Monique Pauzé
Saskatchewan   Regina—Lewvan   Tom Lukiwski Trent Fraser   Erin Weir
  Saskatoon West   Kelly Block Randy Donauer   Sheri Benson

New seats[]

As a result of the 2012 federal electoral redistribution, thirty new ridings were added and many riding boundaries were changed, so several ridings did not have an Incumbent. The following table identifies what party would have held the redistributed ridings based on 2011 results for the new riding and the subsequent MP who was elected. Some of these seats did have incumbents from other districts running.

Party Electoral District New MP
Conservative
Alberta Bow River   Martin Shields
Calgary Rocky Ridge   Pat Kelly
Calgary Shepard   Tom Kmiec
Edmonton Manning   Ziad Aboultaif
Edmonton—Wetaskiwin   Mike Lake
Peace River—Westlock   Arnold Viersen
Sturgeon River—Parkland   Rona Ambrose
British Columbia Cloverdale—Langley City   John Aldag
Delta   Carla Qualtrough
Mission—Matsqui—Fraser Canyon   Jati Sidhu
Vancouver Granville   Jody Wilson-Raybould
Ontario Aurora—Oak Ridges—Richmond Hill   Leona Alleslev
Barrie—Springwater—Oro-Medonte   Alex Nuttall
Brampton Centre   Ramesh Sangha
Brampton South   Sonia Sidhu
Carleton   Pierre Poilievre
Don Valley North   Geng Tan
Flamborough—Glanbrook   David Sweet
Hastings—Lennox and Addington   Mike Bossio
King—Vaughan   Deb Schulte
Kitchener South—Hespeler   Marwan Tabbara
Markham—Unionville   Bob Saroya
Milton   Lisa Raitt
Mississauga Centre   Omar Alghabra
NDP
British Columbia Burnaby South   Kennedy Stewart
Nanaimo—Ladysmith   Sheila Malcolmson
Quebec La Prairie   Jean-Claude Poissant
Mirabel   Simon Marcil
Thérèse-De Blainville   Ramez Ayoub
Liberal
Ontario Scarborough—Rouge Park   Gary Anandasangaree

Notes[]

References[]

  1. ^ "Canada Election 2015 Live Results CBC". CBC.ca.
  2. ^ "Voter turnout spikes after long, unpredictable campaign". cbc.ca. October 20, 2015.
  3. ^ a b Daniel Schwartz (October 21, 2015). "Going deeper into Canada's 2015 federal election results". CBC News.
  4. ^ Antony Green (October 21, 2015). "Canada 2015 - Would Preferential Voting Have Made a Difference?". blogs.abc.net.au. Australian Broadcasting Corporation.
  5. ^ Clark, Campbell (June 15, 2016). "After 'a seismic shift' in voting, it's time to fill in the political trenches". The Globe and Mail.
  6. ^ "Voter Turnout by Age Group" (PDF). Elections Canada. 2016.
  7. ^ "Voter turnout by sex and age" (PDF). Elections Canada. 2016.
  8. ^ Eric Andrew-Gee (October 21, 2015). "How Canadians voted". The Globe and Mail. pp. A8–A9.
  9. ^ "Summary table of judicial recounts". elections.ca. 2015.
Retrieved from ""