Scoring rule

In decision theory, a score function, or scoring rule, measures the accuracy of probabilistic predictions. It is applicable to tasks in which predictions must assign probabilities to a set of mutually exclusive outcomes or classes. The set of possible outcomes can be either binary or categorical in nature, and the probabilities assigned to this set of outcomes must sum to one (where each individual probability is in the range of 0 to 1). A score can be thought of as either a measure of the "calibration" of a set of probabilistic predictions, or as a "cost function" or "loss function".
If a cost is levied in proportion to a proper scoring rule, the minimal expected cost corresponds to reporting the true set of probabilities. Proper scoring rules are used in meteorology, finance, and pattern classification where a forecaster or algorithm will attempt to minimize the average score to yield refined, calibrated probabilities (i.e. accurate probabilities).
Definition[]
Suppose and are two random variables defined on a sample space with and as their corresponding density (mass) functions, in which is a forecast target variable and is the random variable generated from a forecast schema. Also, assume that the , for is the realized value. A scoring rule is a function such as (i.e., ) which calculates the distance between and .


Orientation[]
is positively oriented if for two different probabilistic forecasts (such as and ), means that is a better probabilistic forecast than .


Expected score[]
Expected score is the expected value of the scoring rule over all possible values of the target variable. For example, for a continuous random variable we have

Expected loss[]
The expected score loss is the difference between the expected score for the target variable and the forecast:

Propriety[]
Assuming positive orientation, a scoring rule is considered to be strictly proper if the value of the expected score loss is positive for all possible forecasts. In other words, based on a strictly proper score rule a forecasting scheme must score best if it suggests the target variable as the forecast, and vice versa; i.e. based on a strictly proper score rule a forecasting scheme must score best if, and only if, it suggests the target variable as the forecast.[1]
Non-probabilistic forecast accuracy measures[]
Although scoring rules are introduced in probabilistic forecasting literature, the definition is general enough to consider non-probabilistic measures such as mean absolute error or mean square error as some specific scoring rules. The main characteristic of such scoring rules is is just a function of the expected value of (i.e., ).

Example application of scoring rules[]

An example of probabilistic forecasting is in meteorology where a weather forecaster may give the probability of rain on the next day. One could note the number of times that a 25% probability was quoted, over a long period, and compare this with the actual proportion of times that rain fell. If the actual percentage was substantially different from the stated probability we say that the forecaster is poorly calibrated. A poorly calibrated forecaster might be encouraged to do better by a bonus system. A bonus system designed around a proper scoring rule will incentivize the forecaster to report probabilities equal to his personal beliefs.[2]
In addition to the simple case of a binary decision, such as assigning probabilities to 'rain' or 'no rain', scoring rules may be used for multiple classes, such as 'rain', 'snow', or 'clear'.
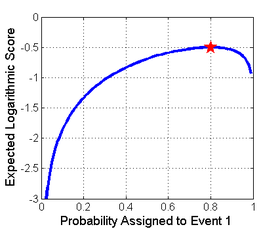
The image to the right shows an example of a scoring rule, the logarithmic scoring rule, as a function of the probability reported for the event that actually occurred. One way to use this rule would be as a cost based on the probability that a forecaster or algorithm assigns, then checking to see which event actually occurs.
Proper scoring rules[]
A probabilistic forecaster or algorithm will return a probability vector with a probability for each of the outcomes. One usage of a scoring function could be to give a reward of if the th event occurs. If a proper scoring rule is used, then the highest expected reward is obtained by reporting the true probability distribution. The use of a proper scoring rule encourages the forecaster to be honest to maximize the expected reward.[3]


Strictly proper scoring rules[]
A scoring rule is strictly proper if it is uniquely optimized (in expectation) by only the true probabilities. In other words, if a proper scoring rule is not strictly proper, then it will be optimized by predicting the true probabilities but may possibly attain the same optimal value with some other predicted probabilities as well. Optimized in this case will correspond to maximization for the quadratic, spherical, and logarithmic rules but minimization for the Brier Score. This can be seen in the image at right for the logarithmic rule. Here, Event 1 is expected to occur with probability of 0.8, and the expected score (or reward) is shown as a function of the reported probability. The way to maximize the expected reward is to report the actual probability of 0.8 as all other reported probabilities will yield a lower expected score. This property holds because the logarithmic score is strictly proper.
Examples of strictly proper scoring rules[]
There are an infinite number of scoring rules, including entire parameterized families of strictly proper scoring rules. The ones shown below are simply popular examples.
Logarithmic scoring rule[]
The logarithmic scoring rule is a local strictly proper scoring rule. This is also the negative of surprisal, which is commonly used as a scoring criterion in Bayesian inference; the goal is to minimize expected surprise. This scoring rule has strong foundations in information theory.

Here, the score is calculated as the logarithm of the probability estimate for the actual outcome. That is, a prediction of 80% that correctly proved true would receive a score of ln(0.8) = −0.22. This same prediction also assigns 20% likelihood to the opposite case, and so if the prediction proves false, it would receive a score based on the 20%: ln(0.2) = −1.6. The goal of a forecaster is to maximize the score and for the score to be as large as possible, and −0.22 is indeed larger than −1.6.
If one treats the truth or falsity of the prediction as a variable x with value 1 or 0 respectively, and the expressed probability as p, then one can write the logarithmic scoring rule as x ln(p) + (1 − x) ln(1 − p). Note that any logarithmic base may be used, since strictly proper scoring rules remain strictly proper under linear transformation. That is:

is strictly proper for all .

Brier/quadratic scoring rule[]
The quadratic scoring rule is a strictly proper scoring rule

where is the probability assigned to the correct answer and is the number of classes.


The Brier score, originally proposed by Glenn W. Brier in 1950,[4] can be obtained by an affine transform from the quadratic scoring rule.

Where when the th event is correct and otherwise and is the number of classes.


An important difference between these two rules is that a forecaster should strive to maximize the quadratic score yet minimize the Brier score. This is due to a negative sign in the linear transformation between them.
Hyvarinen scoring rule[]
The Hyvarinen scoring function (of a density p) is defined by[5]

It can be used to computationally simplify parameter inference and address Bayesian model comparison with arbitrarily-vague priors.[5][6] It was also used to introduce new information-theoretic quantities beyond the existing information theory.[7]
Spherical scoring rule[]
The spherical scoring rule is also a strictly proper scoring rule

Interpretation of proper scoring rules[]
All proper scoring rules are equal to weighted sums (integral with a non-negative weighting functional) of the losses in a set of simple two-alternative decision problems that use the probabilistic prediction, each such decision problem having a particular combination of associated cost parameters for false positive and false negative decisions. A strictly proper scoring rule corresponds to having a nonzero weighting for all possible decision thresholds. Any given proper scoring rule is equal to the expected losses with respect to a particular probability distribution over the decision thresholds; thus the choice of a scoring rule corresponds to an assumption about the probability distribution of decision problems for which the predicted probabilities will ultimately be employed, with for example the quadratic loss (or Brier) scoring rule corresponding to a uniform probability of the decision threshold being anywhere between zero and one. The classification accuracy score (percent classified correctly), a single-threshold scoring rule which is zero or one depending on whether the predicted probability is on the appropriate side of 0.5, is a proper scoring rule but not a strictly proper scoring rule because it is optimized (in expectation) not only by predicting the true probability but by predicting any probability on the same side of 0.5 as the true probability.[8][9][10][11][12][13]
Comparison of strictly proper scoring rules[]
Shown below on the left is a graphical comparison of the Logarithmic, Quadratic, and Spherical scoring rules for a binary classification problem. The x-axis indicates the reported probability for the event that actually occurred.
It is important to note that each of the scores have different magnitudes and locations. The magnitude differences are not relevant however as scores remain proper under affine transformation. Therefore, to compare different scores it is necessary to move them to a common scale. A reasonable choice of normalization is shown at the picture on the right where all scores intersect the points (0.5,0) and (1,1). This ensures that they yield 0 for a uniform distribution (two probabilities of 0.5 each), reflecting no cost or reward for reporting what is often the baseline distribution. All normalized scores below also yield 1 when the true class is assigned a probability of 1.
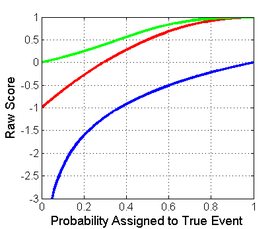 Score of a binary classification for the true class showing logarithmic (blue), spherical (green), and quadratic (red) |
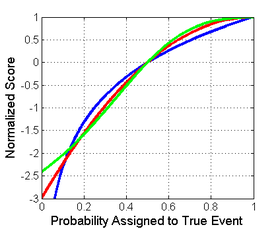 Normalized score of a binary classification for the true class showing logarithmic (blue), spherical (green), and quadratic (red) |
Characteristics[]
Affine transformation[]
A strictly proper scoring rule, whether binary or multiclass, after an affine transformation remains a strictly proper scoring rule.[2] That is, if is a strictly proper scoring rule then with is also a strictly proper scoring rule, though if then the optimization sense of the scoring rule switches between maximization and minimization.


Locality[]
A proper scoring rule is said to be local if its estimate for the probability of a specific event depends only on the probability of that event. This statement is vague in most descriptions but we can, in most cases, think of this as the optimal solution of the scoring problem "at a specific event" is invariant to all changes in the observation distribution that leave the probability of that event unchanged. All binary scores are local because the probability assigned to the event that did not occur is determined so there is no degree of flexibility to vary over.
Affine functions of the logarithmic scoring rule are the only strictly proper local scoring rules on a finite set that is not binary.
Decomposition[]
The expectation value of a proper scoring rule can be decomposed into the sum of three components, called uncertainty, reliability, and resolution,[14][15] which characterize different attributes of probabilistic forecasts:


If a score is proper and negatively oriented (such as the Brier Score), all three terms are positive definite. The uncertainty component is equal to the expected score of the forecast which constantly predicts the average event frequency. The reliability component penalizes poorly calibrated forecasts, in which the predicted probabilities do not coincide with the event frequencies.
The equations for the individual components depend on the particular scoring rule. For the Brier Score, they are given by


where is the average probability of occurrence of the binary event , and is the conditional event probability, given , i.e.


See also[]
References[]
- ^ Mojab, Ramin (2016-08-04). "Probabilistic Forecasting with Stationary VAR Models". doi:10.2139/ssrn.2818213. S2CID 126156476. SSRN 2818213. Cite journal requires
|journal=(help) - ^ a b Bickel, E.J. (2007). "Some Comparisons among Quadratic, Spherical, and Logarithmic Scoring Rules" (PDF). Decision Analysis. 4 (2): 49–65. doi:10.1287/deca.1070.0089.
- ^ Gneiting, Tilmann; Raftery, Adrian E. (2007). "Strictly Proper Scoring Rules, Prediction, and Estimation". Journal of the American Statistical Association. 102 (447): 359–378. doi:10.1198/016214506000001437. S2CID 1878582.
- ^ Brier, G.W. (1950). "Verification of forecasts expressed in terms of probability" (PDF). Monthly Weather Review. 78 (1): 1–3. Bibcode:1950MWRv...78....1B. doi:10.1175/1520-0493(1950)078<0001:VOFEIT>2.0.CO;2.
- ^ a b Hyvärinen, Aapo (2005). "Estimation of Non-Normalized Statistical Models by Score Matching". Journal of Machine Learning Research. 6 (24): 695–709. ISSN 1533-7928.
- ^ Shao, Stephane; Jacob, Pierre E.; Ding, Jie; Tarokh, Vahid (2019-10-02). "Bayesian Model Comparison with the Hyvärinen Score: Computation and Consistency". Journal of the American Statistical Association. 114 (528): 1826–1837. arXiv:1711.00136. doi:10.1080/01621459.2018.1518237. ISSN 0162-1459. S2CID 52264864.
- ^ Ding, Jie; Calderbank, Robert; Tarokh, Vahid (2019). "Gradient Information for Representation and Modeling". Advances in Neural Information Processing Systems. 32: 2396–2405.
- ^ Leonard J. Savage. Elicitation of personal probabilities and expectations. J. of the American Stat. Assoc., 66(336):783–801, 1971.
- ^ Schervish, Mark J. (1989). "A General Method for Comparing Probability Assessors", Annals of Statistics 17(4) 1856–1879, https://projecteuclid.org/euclid.aos/1176347398
- ^ Rosen, David B. (1996). "How good were those probability predictions? The expected recommendation loss (ERL) scoring rule". In Heidbreder, G. (ed.). Maximum Entropy and Bayesian Methods (Proceedings of the Thirteenth International Workshop, August 1993). Kluwer, Dordrecht, The Netherlands. CiteSeerX 10.1.1.52.1557.
- ^ Roulston, M. S., & Smith, L. A. (2002). Evaluating probabilistic forecasts using information theory. Monthly Weather Review, 130, 1653–1660. See APPENDIX "Skill Scores and Cost–Loss". [1]
- ^ "Loss Functions for Binary Class Probability Estimation and Classification: Structure and Applications", Andreas Buja , Werner Stuetzle , Yi Shen (2005) http://citeseerx.ist.psu.edu/viewdoc/summary?doi=10.1.1.184.5203
- ^ Hernandez-Orallo, Jose; Flach, Peter; and Ferri, Cesar (2012). "A Unified View of Performance Metrics: Translating Threshold Choice into Expected Classification Loss." Journal of Machine Learning Research 13 2813–2869. http://www.jmlr.org/papers/volume13/hernandez-orallo12a/hernandez-orallo12a.pdf
- ^ Murphy, A.H. (1973). "A new vector partition of the probability score". Journal of Applied Meteorology. 12 (4): 595–600. Bibcode:1973JApMe..12..595M. doi:10.1175/1520-0450(1973)012<0595:ANVPOT>2.0.CO;2.
- ^ Bröcker, J. (2009). "Reliability, sufficiency, and the decomposition of proper scores" (PDF). Quarterly Journal of the Royal Meteorological Society. 135 (643): 1512–1519. arXiv:0806.0813. Bibcode:2009QJRMS.135.1512B. doi:10.1002/qj.456. S2CID 15880012.
External links[]
- Decision theory
- Probability assessment