South Norfolk District Council elections
South Norfolk District Council in Norfolk, England is elected once every four years. Since the last boundary changes in 2007, 46 councillors have been elected from 36 wards.[1]
Political control[]
Since the first election to the council in 1973 political control of the council has been held by the following parties:[2]
| Party in control | Years |
|---|---|
| Independent | 1973 - 1976 |
| No overall control | 1976 - 1979 |
| Conservative | 1979 - 1987 |
| No overall control | 1987 - 1995 |
| Liberal Democrats | 1995 - 2007 |
| Conservative | 2007–present |
Council elections[]
- (New ward boundaries)[3]
- (New ward boundaries reduced the number of seats by 1)[4][5]
- (Some new ward boundaries)[2][6]
- 2011 South Norfolk District Council election
- 2015 South Norfolk District Council election
- 2019 South Norfolk District Council election
District result maps[]
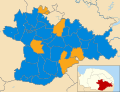
2011 results map

2015 results map


By-election results[]
| Party | Candidate | Votes | % | ±% | |
|---|---|---|---|---|---|
| Liberal Democrats | 731 | 48.5 | -4.9 | ||
| Conservative | 271 | 18.0 | +5.2 | ||
| Labour | 257 | 17.0 | +0.9 | ||
| Independent | 249 | 16.5 | -1.1 | ||
| Majority | 474 | 30.5 | |||
| Turnout | 1,508 | 27.5 | |||
| Liberal Democrats hold | Swing | ||||
| Party | Candidate | Votes | % | ±% | |
|---|---|---|---|---|---|
| Conservative | Margaret Dewsbury | 500 | 57.1 | +3.7 | |
| Liberal Democrats | Paul Blathwayt | 336 | 38.4 | +10.2 | |
| Green | Andrew Brockbank | 40 | 4.6 | -2.6 | |
| Majority | 164 | 18.7 | |||
| Turnout | 876 | 45.9 | |||
| Conservative hold | Swing | ||||
| Party | Candidate | Votes | % | ±% | |
|---|---|---|---|---|---|
| Conservative | Anthony Palmer | 845 | 50.9 | +25.5 | |
| Liberal Democrats | Susan Ayres | 714 | 43.0 | +2.9 | |
| Green | Graham Sessions | 102 | 6.1 | +6.1 | |
| Majority | 131 | 7.9 | |||
| Turnout | 1,661 | 29.6 | |||
| Liberal Democrats hold | Swing | ||||
| Party | Candidate | Votes | % | ±% | |
|---|---|---|---|---|---|
| Liberal Democrats | Katy Smith | 659 | 52.8 | ||
| Labour | Cyril Gibbs | 312 | 25 | ||
| Green | Ian Boreham | 277 | 22.2 | ||
| Majority | 347 | ||||
| Turnout | |||||
| Liberal Democrats hold | Swing | ||||
| Party | Candidate | Votes | % | ±% | |
|---|---|---|---|---|---|
| Conservative | Jaan Larner | 260 | 53.5 | ||
| Labour | Sarah Langton | 93 | 19.1 | ||
| Liberal Democrats | Ernest Green | 69 | 14.2 | ||
| UKIP | Ron Murphy | 64 | 13.2 | ||
| Majority | 167 | ||||
| Turnout | |||||
| Conservative hold | Swing | ||||
References[]
- ^ "Types of elections". South Norfolk Council. Retrieved 2010-03-17.
- ^ a b "South Norfolk". BBC News Online. Retrieved 2010-03-17.
- ^ The District of South Norfolk (Electoral Arrangements) Order 1977
- ^ "Local elections". BBC News Online. Retrieved 2010-03-17.
- ^ legislation.gov.uk - The District of South Norfolk (Electoral Changes) Order 2002. Retrieved on 4 October 2015.
- ^ legislation.gov.uk - The South Norfolk (Parish Electoral Arrangements and Electoral Changes) Order 2007. Retrieved on 3 November 2015.
- ^ Tempest, Matthew (2004-09-17). "BNP wins first London seat since 1993". guardian.co.uk. Retrieved 2010-03-17.
- ^ "District council by-election result, Easton Ward". South Norfolk Council. 2004-09-17. Retrieved 2010-03-17.
- ^ "Labour loses Scottish council stronghold". guardian.co.uk. London. 2006-06-16. Retrieved 2010-03-17.
- ^ a b c "District council by-election result, Diss Ward". South Norfolk Council. 2006-06-16. Retrieved 2010-03-17.
External links[]
Categories:
- South Norfolk District Council elections
- Council elections in Norfolk
- District council elections in England