Spectral line
This article includes a list of general references, but it remains largely unverified because it lacks sufficient corresponding inline citations. (May 2013) |
A spectral line is a dark or bright line in an otherwise uniform and continuous spectrum, resulting from emission or absorption of light in a narrow frequency range, compared with the nearby frequencies. Spectral lines are often used to identify atoms and molecules. These "fingerprints" can be compared to the previously collected "fingerprints" of atoms[1] and molecules,[2] and are thus used to identify the atomic and molecular components of stars and planets, which would otherwise be impossible.
Types of line spectra[]

Spectral lines are the result of interaction between a quantum system (usually atoms, but sometimes molecules or atomic nuclei) and a single photon. When a photon has about the right amount of energy (which is connected to its frequency)[3] to allow a change in the energy state of the system (in the case of an atom this is usually an electron changing orbitals), the photon is absorbed. Then it will be spontaneously re-emitted, either in the same frequency as the original or in a cascade, where the sum of the energies of the photons emitted will be equal to the energy of the one absorbed (assuming the system returns to its original state).[citation needed]
A spectral line may be observed either as an emission line or an absorption line. Which type of line is observed depends on the type of material and its temperature relative to another emission source. An absorption line is produced when photons from a hot, broad spectrum source pass through a cold material. The intensity of light, over a narrow frequency range, is reduced due to absorption by the material and re-emission in random directions. By contrast, a bright emission line is produced when photons from a hot material are detected in the presence of a broad spectrum from a cold source. The intensity of light, over a narrow frequency range, is increased due to emission by the material.
Spectral lines are highly atom-specific, and can be used to identify the chemical composition of any medium capable of letting light pass through it. Several elements were discovered by spectroscopic means, including helium, thallium, and caesium. Spectral lines also depend on the physical conditions of the gas, so they are widely used to determine the chemical composition of stars and other celestial bodies that cannot be analyzed by other means, as well as their physical conditions.
Mechanisms other than atom-photon interaction can produce spectral lines. Depending on the exact physical interaction (with molecules, single particles, etc.), the frequency of the involved photons will vary widely, and lines can be observed across the electromagnetic spectrum, from radio waves to gamma rays.
Nomenclature[]
This section needs expansion. You can help by . (October 2008) |
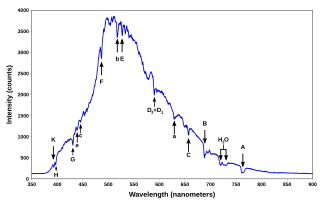
Strong spectral lines in the visible part of the spectrum often have a unique Fraunhofer line designation, such as K for a line at 393.366 nm emerging from singly-ionized Ca+, though some of the Fraunhofer "lines" are blends of multiple lines from several different species. In other cases, the lines are designated according to the level of ionization by adding a Roman numeral to the designation of the chemical element. Neutral atoms are denoted with the Roman numeral I, singly ionized atoms with II, and so on, so that, for example, Fe IX represents eight times ionized iron.
More detailed designations usually include the line wavelength and may include a multiplet number (for atomic lines) or band designation (for molecular lines). Many spectral lines of atomic hydrogen also have designations within their respective series, such as the Lyman series or Balmer series. Originally all spectral lines were classified into series: the Principal series, Sharp series, and Diffuse series. These series exist across atoms of all elements, and the patterns for all atoms are well-predicted by the Rydberg-Ritz formula. These series were later associated with suborbitals.
Line broadening and shift[]
There are a number of effects which control spectral line shape. A spectral line extends over a range of frequencies, not a single frequency (i.e., it has a nonzero linewidth). In addition, its center may be shifted from its nominal central wavelength. There are several reasons for this broadening and shift. These reasons may be divided into two general categories – broadening due to local conditions and broadening due to extended conditions. Broadening due to local conditions is due to effects which hold in a small region around the emitting element, usually small enough to assure local thermodynamic equilibrium. Broadening due to extended conditions may result from changes to the spectral distribution of the radiation as it traverses its path to the observer. It also may result from the combining of radiation from a number of regions which are far from each other.
Broadening due to local effects[]
Natural broadening[]
The lifetime of excited states results in natural broadening, also known as lifetime broadening. The uncertainty principle relates the lifetime of an excited state (due to spontaneous radiative decay or the Auger process) with the uncertainty of its energy. Some authors use the term "radiative broadening" to refer specifically to the part of natural broadening caused by the spontaneous radiative decay.[4] A short lifetime will have a large energy uncertainty and a broad emission. This broadening effect results in an unshifted Lorentzian profile. The natural broadening can be experimentally altered only to the extent that decay rates can be artificially suppressed or enhanced.[5]
Thermal Doppler broadening[]
The atoms in a gas which are emitting radiation will have a distribution of velocities. Each photon emitted will be "red"- or "blue"-shifted by the Doppler effect depending on the velocity of the atom relative to the observer. The higher the temperature of the gas, the wider the distribution of velocities in the gas. Since the spectral line is a combination of all of the emitted radiation, the higher the temperature of the gas, the broader the spectral line emitted from that gas. This broadening effect is described by a Gaussian profile and there is no associated shift.
Pressure broadening[]
The presence of nearby particles will affect the radiation emitted by an individual particle. There are two limiting cases by which this occurs:
- Impact pressure broadening or collisional broadening: The collision of other particles with the light emitting particle interrupts the emission process, and by shortening the characteristic time for the process, increases the uncertainty in the energy emitted (as occurs in natural broadening).[6] The duration of the collision is much shorter than the lifetime of the emission process. This effect depends on both the density and the temperature of the gas. The broadening effect is described by a Lorentzian profile and there may be an associated shift.
- Quasistatic pressure broadening: The presence of other particles shifts the energy levels in the emitting particle,[clarification needed] thereby altering the frequency of the emitted radiation. The duration of the influence is much longer than the lifetime of the emission process. This effect depends on the density of the gas, but is rather insensitive to temperature. The form of the line profile is determined by the functional form of the perturbing force with respect to distance from the perturbing particle. There may also be a shift in the line center. The general expression for the lineshape resulting from quasistatic pressure broadening is a 4-parameter generalization of the Gaussian distribution known as a stable distribution.[7]
Pressure broadening may also be classified by the nature of the perturbing force as follows:
- Linear Stark broadening occurs via the linear Stark effect, which results from the interaction of an emitter with an electric field of a charged particle at a distance , causing a shift in energy that is linear in the field strength.
- Resonance broadening occurs when the perturbing particle is of the same type as the emitting particle, which introduces the possibility of an energy exchange process.
- Quadratic Stark broadening occurs via the quadratic Stark effect, which results from the interaction of an emitter with an electric field, causing a shift in energy that is quadratic in the field strength.
- Van der Waals broadening occurs when the emitting particle is being perturbed by Van der Waals forces. For the quasistatic case, a Van der Waals profile[note 1] is often useful in describing the profile. The energy shift as a function of distance[definition needed] is given in the wings by e.g. the Lennard-Jones potential.


Inhomogeneous broadening[]
Inhomogeneous broadening is a general term for broadening because some emitting particles are in a different local environment from others, and therefore emit at a different frequency. This term is used especially for solids, where surfaces, grain boundaries, and stoichiometry variations can create a variety of local environments for a given atom to occupy. In liquids, the effects of inhomogeneous broadening is sometimes reduced by a process called motional narrowing.
Broadening due to non-local effects[]
Certain types of broadening are the result of conditions over a large region of space rather than simply upon conditions that are local to the emitting particle.
Opacity broadening[]
Electromagnetic radiation emitted at a particular point in space can be reabsorbed as it travels through space. This absorption depends on wavelength. The line is broadened because the photons at the line center have a greater reabsorption probability than the photons at the line wings. Indeed, the reabsorption near the line center may be so great as to cause a self reversal in which the intensity at the center of the line is less than in the wings. This process is also sometimes called self-absorption.
Macroscopic Doppler broadening[]
Radiation emitted by a moving source is subject to Doppler shift due to a finite line-of-sight velocity projection. If different parts of the emitting body have different velocities (along the line of sight), the resulting line will be broadened, with the line width proportional to the width of the velocity distribution. For example, radiation emitted from a distant rotating body, such as a star, will be broadened due to the line-of-sight variations in velocity on opposite sides of the star. The greater the rate of rotation, the broader the line. Another example is an imploding plasma shell in a Z-pinch.
Combined effects[]
Each of these mechanisms can act in isolation or in combination with others. Assuming each effect is independent, the observed line profile is a convolution of the line profiles of each mechanism. For example, a combination of the thermal Doppler broadening and the impact pressure broadening yields a Voigt profile.
However, the different line broadening mechanisms are not always independent. For example, the collisional effects and the motional Doppler shifts can act in a coherent manner, resulting under some conditions even in a collisional narrowing, known as the Dicke effect.
Spectral lines of chemical elements[]
Bands[]
The phrase "spectral lines", when not qualified, usually refers to lines having wavelengths in the visible band of the full electromagnetic spectrum. Many spectral lines occur at wavelengths outside this range. At shorter wavelengths, which correspond to higher energies, ultraviolet spectral lines include the Lyman series of hydrogen. At the much shorter wavelengths of X-rays, the lines are known as characteristic X-rays because they remain largely unchanged for a given chemical element, independent of their chemical environment. Longer wavelengths correspond to lower energies, where the infrared spectral lines include the Paschen series of hydrogen. At even longer wavelengths, the radio spectrum includes the 21-cm line used to detect neutral hydrogen throughout the cosmos.
Visible light[]
For each element, the following table shows the spectral lines which appear in the visible spectrum at about 400-700 nm.
See also[]
- Absorption spectrum
- Atomic spectral line
- Bohr model
- Electron configuration
- Emission spectrum
- Fourier transform
- Fraunhofer line
- Table of emission spectra of gas discharge lamps
- Hydrogen line (21-cm line)
- Hydrogen spectral series
- Spectroscopy
- Splatalogue
Notes[]
- ^ "Van der Waals profile" appears as lowercase in almost all sources, such as: Statistical mechanics of the liquid surface by Clive Anthony Croxton, 1980, A Wiley-Interscience publication, ISBN 0-471-27663-4, ISBN 978-0-471-27663-0; and in Journal of technical physics, Volume 36, by Instytut Podstawowych Problemów Techniki (Polska Akademia Nauk), publisher: Państwowe Wydawn. Naukowe., 1995,
References[]
- ^ Kramida, Alexander; Ralchenko, Yuri (1999), NIST Atomic Spectra Database, NIST Standard Reference Database 78, National Institute of Standards and Technology, retrieved 2021-06-27
- ^ Rothman, L.S.; Gordon, I.E.; Babikov, Y.; Barbe, A.; Chris Benner, D.; Bernath, P.F.; Birk, M.; Bizzocchi, L.; Boudon, V.; Brown, L.R.; Campargue, A.; Chance, K.; Cohen, E.A.; Coudert, L.H.; Devi, V.M.; Drouin, B.J.; Fayt, A.; Flaud, J.-M.; Gamache, R.R.; Harrison, J.J.; Hartmann, J.-M.; Hill, C.; Hodges, J.T.; Jacquemart, D.; Jolly, A.; Lamouroux, J.; Le Roy, R.J.; Li, G.; Long, D.A.; et al. (2013). "The HITRAN2012 molecular spectroscopic database". Journal of Quantitative Spectroscopy and Radiative Transfer. 130: 4–50. Bibcode:2013JQSRT.130....4R. doi:10.1016/j.jqsrt.2013.07.002. ISSN 0022-4073.
- ^ Einstein, Albert (1905). "On a Heuristic Viewpoint Concerning the Production and Transformation of Light".
- ^ Krainov, Vladimir; Reiss, Howard; Smirnov, Boris (1997). Radiative Processes in Atomic Physics. Wiley. doi:10.1002/3527605606. ISBN 978-0-471-12533-4.
- ^ For example, in the following article, decay was suppressed via a microwave cavity, thus reducing the natural broadening: Gabrielse, Gerald; H. Dehmelt (1985). "Observation of Inhibited Spontaneous Emission". Physical Review Letters. 55 (1): 67–70. Bibcode:1985PhRvL..55...67G. doi:10.1103/PhysRevLett.55.67. PMID 10031682.
- ^ "Collisional Broadening". Fas.harvard.edu. Archived from the original on 2015-09-24. Retrieved 2015-09-24.
- ^ Peach, G. (1981). "Theory of the pressure broadening and shift of spectral lines". Advances in Physics. 30 (3): 367–474. Bibcode:1981AdPhy..30..367P. doi:10.1080/00018738100101467. Archived from the original on 2013-01-14.
Further reading[]
- Griem, Hans R. (1997). Principles of Plasma Spectroscopy. Cambridge: University Press. ISBN 0-521-45504-9.
- Griem, Hans R. (1974). Spectral Line Broadening by Plasmas. New York: Academic Press. ISBN 0-12-302850-7.
- Griem, Hans R. (1964). Plasma Spectroscopy. New York: McGraw-Hill book Company.
| show Authority control |
|---|
- Spectroscopy
- Emission spectroscopy