Surface plasmon resonance
Surface plasmon resonance (SPR) is the resonant oscillation of conduction electrons at the interface between negative and positive permittivity material stimulated by incident light. SPR is the basis of many standard tools for measuring adsorption of material onto planar metal (typically gold or silver) surfaces or onto the surface of metal nanoparticles. It is the fundamental principle behind many color-based biosensor applications, different lab-on-a-chip sensors and diatom photosynthesis.
Explanation[]
The surface plasmon polariton is a non-radiative electromagnetic surface wave that propagates in a direction parallel to the negative permittivity/dielectric material interface. Since the wave is on the boundary of the conductor and the external medium (air, water or vacuum for example), these oscillations are very sensitive to any change of this boundary, such as the adsorption of molecules to the conducting surface.[1]
To describe the existence and properties of surface plasmon polaritons, one can choose from various models (quantum theory, Drude model, etc.). The simplest way to approach the problem is to treat each material as a homogeneous continuum, described by a frequency-dependent relative permittivity between the external medium and the surface. This quantity, hereafter referred to as the materials' "dielectric function", is the complex permittivity. In order for the terms that describe the electronic surface plasmon to exist, the real part of the dielectric constant of the conductor must be negative and its magnitude must be greater than that of the dielectric. This condition is met in the infrared-visible wavelength region for air/metal and water/metal interfaces (where the real dielectric constant of a metal is negative and that of air or water is positive).
LSPRs (localized surface plasmon resonances) are collective electron charge oscillations in metallic nanoparticles that are excited by light. They exhibit enhanced near-field amplitude at the resonance wavelength. This field is highly localized at the nanoparticle and decays rapidly away from the nanoparticle/dielectric interface into the dielectric background, though far-field scattering by the particle is also enhanced by the resonance. Light intensity enhancement is a very important aspect of LSPRs and localization means the LSPR has very high spatial resolution (subwavelength), limited only by the size of nanoparticles. Because of the enhanced field amplitude, effects that depend on the amplitude such as magneto-optical effect are also enhanced by LSPRs.[2][3]
Implementations[]


In order to excite surface plasmon polaritons in a resonant manner, one can use electron bombardment or incident light beam (visible and infrared are typical). The incoming beam has to match its momentum to that of the plasmon.[4] In the case of p-polarized light (polarization occurs parallel to the plane of incidence), this is possible by passing the light through a block of glass to increase the wavenumber (and the momentum), and achieve the resonance at a given wavelength and angle. S-polarized light (polarization occurs perpendicular to the plane of incidence) cannot excite electronic surface plasmons. Electronic and magnetic surface plasmons obey the following dispersion relation:

where k() is the wave vector, is the relative permittivity, and is the relative permeability of the material (1: the glass block, 2: the metal film), while is angular frequency and is the speed of light in a vacuum.


Typical metals that support surface plasmons are silver and gold, but metals such as copper, titanium or chromium have also been used.
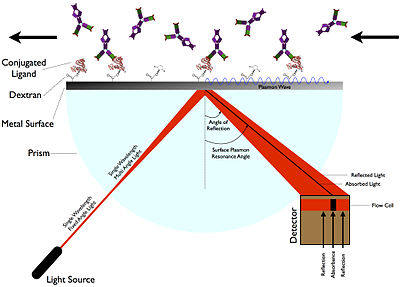
When using light to excite SP waves, there are two configurations which are well known. In the Otto configuration, the light illuminates the wall of a glass block, typically a prism, and is totally internally reflected. A thin metal film (for example gold) is positioned close enough to the prism wall so that an evanescent wave can interact with the plasma waves on the surface and hence excite the plasmons.[5]
In the Kretschmann configuration (also known as Kretschmann–Raether configuration), the metal film is evaporated onto the glass block. The light again illuminates the glass block, and an evanescent wave penetrates through the metal film. The plasmons are excited at the outer side of the film. This configuration is used in most practical applications.[5]
SPR emission[]
When the surface plasmon wave interacts with a local particle or irregularity, such as a rough surface, part of the energy can be re-emitted as light. This emitted light can be detected behind the metal film from various directions.
Applications[]


Surface plasmons have been used to enhance the surface sensitivity of several spectroscopic measurements including fluorescence, Raman scattering, and second-harmonic generation. However, in their simplest form, SPR reflectivity measurements can be used to detect molecular adsorption, such as polymers, DNA or proteins, etc. Technically, it is common to measure the angle of minimum reflection (angle of maximum absorption). This angle changes in the order of 0.1° during thin (about nm thickness) film adsorption. (See also the Examples.) In other cases the changes in the absorption wavelength is followed.[6] The mechanism of detection is based on that the adsorbing molecules cause changes in the local index of refraction, changing the resonance conditions of the surface plasmon waves. The same principle is exploited in the recently developed competitive platform based on loss-less dielectric multilayers (DBR), supporting surface electromagnetic waves with sharper resonances (Bloch surface waves).[7]
If the surface is patterned with different biopolymers, using adequate optics and imaging sensors (i.e. a camera), the technique can be extended to surface plasmon resonance imaging (SPRI). This method provides a high contrast of the images based on the adsorbed amount of molecules, somewhat similar to Brewster angle microscopy (this latter is most commonly used together with a Langmuir–Blodgett trough).
For nanoparticles, localized surface plasmon oscillations can give rise to the intense colors of suspensions or sols containing the nanoparticles. Nanoparticles or nanowires of noble metals exhibit strong absorption bands in the ultraviolet–visible light regime that are not present in the bulk metal. This extraordinary absorption increase has been exploited to increase light absorption in photovoltaic cells by depositing metal nanoparticles on the cell surface.[8] The energy (color) of this absorption differs when the light is polarized along or perpendicular to the nanowire.[9] Shifts in this resonance due to changes in the local index of refraction upon adsorption to the nanoparticles can also be used to detect biopolymers such as DNA or proteins. Related complementary techniques include plasmon waveguide resonance, QCM, extraordinary optical transmission, and dual-polarization interferometry.
SPR immunoassay[]
The first SPR immunoassay was proposed in 1983 by Liedberg, Nylander, and Lundström, then of the Linköping Institute of Technology (Sweden).[10] They adsorbed human IgG onto a 600-angstrom silver film, and used the assay to detect anti-human IgG in water solution. Unlike many other immunoassays, such as ELISA, an SPR immunoassay is label free in that a label molecule is not required for detection of the analyte.[11] Additionally, the measurements on SPR can be followed real-time allowing the monitoring of individual steps in sequential binding events particularly useful in the assessment of for instance sandwich complexes.
Material characterization[]
Multi-parametric surface plasmon resonance, a special configuration of SPR, can be used to characterize layers and stacks of layers. Besides binding kinetics, MP-SPR can also provide information on structural changes in terms of layer true thickness and refractive index. MP-SPR has been applied successfully in measurements of lipid targeting and rupture,[12] CVD-deposited single monolayer of graphene (3.7Å)[13] as well as micrometer thick polymers.[14]
Data interpretation[]
The most common data interpretation is based on the Fresnel formulas, which treat the formed thin films as infinite, continuous dielectric layers. This interpretation may result in multiple possible refractive index and thickness values. However, usually only one solution is within the reasonable data range. In multi-parametric surface plasmon resonance, two SPR curves are acquired by scanning a range of angles at two different wavelengths, which results in a unique solution for both thickness and refractive index.
Metal particle plasmons are usually modeled using the Mie scattering theory.
In many cases no detailed models are applied, but the sensors are calibrated for the specific application, and used with interpolation within the calibration curve.
Examples[]
Layer-by-layer self-assembly[]
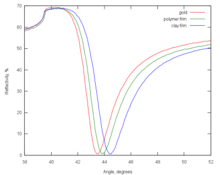
One of the first common applications of surface plasmon resonance spectroscopy was the measurement of the thickness (and refractive index) of adsorbed self-assembled nanofilms on gold substrates. The resonance curves shift to higher angles as the thickness of the adsorbed film increases. This example is a 'static SPR' measurement.
When higher speed observation is desired, one can select an angle right below the resonance point (the angle of minimum reflectance), and measure the reflectivity changes at that point. This is the so-called 'dynamic SPR' measurement. The interpretation of the data assumes that the structure of the film does not change significantly during the measurement.
Binding constant determination[]


When the affinity of two ligands has to be determined, the equilibrium dissociation constant must be determined. It is the equilibrium value for the product quotient. This value can also be found using the dynamic SPR parameters and, as in any chemical reaction, it is the dissociation rate divided by the association rate.
For this, a bait ligand is immobilized on the dextran surface of the SPR crystal. Through a microflow system, a solution with the prey analyte is injected over the bait layer. As the prey analyte binds the bait ligand, an increase in SPR signal (expressed in response units, RU) is observed. After desired association time, a solution without the prey analyte (usually the buffer) is injected on the microfluidics that dissociates the bound complex between bait ligand and prey analyte. Now as the prey analyte dissociates from the bait ligand, a decrease in SPR signal (expressed in resonance units, RU) is observed. From these association ('on rate', ka) and dissociation rates ('off rate', kd), the equilibrium dissociation constant ('binding constant', KD) can be calculated.
The actual SPR signal can be explained by the electromagnetic 'coupling' of the incident light with the surface plasmon of the gold layer. This plasmon can be influenced by the layer just a few nanometer across the gold–solution interface i.e. the bait protein and possibly the prey protein. Binding makes the reflection angle change;

Thermodynamic analysis[]
As SPR biosensors facilitate measurements at different temperatures, thermodynamic analysis can be performed to obtain a better understanding of the studied interaction. By performing measurements at different temperatures, typically between 4 and 40 °C, it is possible to relate association and dissociation rate constants with activation energy and thereby obtain thermodynamic parameters including binding enthalpy, binding entropy, Gibbs free energy and heat capacity.
Pair-wise epitope mapping[]
As SPR allows real-time monitoring, individual steps in sequential binding events can be thoroughly assessed when investigating the suitability between antibodies in a sandwich configuration. Additionally, it allows the mapping of epitopes as antibodies of overlapping epitopes will be associated with an attenuated signal compared to those capable of interacting simultaneously.
Magnetic plasmon resonance[]
Recently, there has been an interest in magnetic surface plasmons. These require materials with large negative magnetic permeability, a property that has only recently been made available with the construction of metamaterials.
See also[]
- Hydrogen sensor
- Multi-parametric surface plasmon resonance
- Nano-optics
- Plasmon
- Spinplasmonics
- Surface plasmon polariton
- Waves in plasmas
- Localized surface plasmon
- Quartz crystal microbalance
References[]
- ^ S. Zeng; Baillargeat, Dominique; Ho, Ho-Pui; Yong, Ken-Tye (2014). "Nanomaterials enhanced surface plasmon resonance for biological and chemical sensing applications". Chemical Society Reviews. 43 (10): 3426–3452. doi:10.1039/C3CS60479A. PMID 24549396.
- ^ González-Díaz, Juan B.; García-Martín, Antonio; García-Martín, José M.; Cebollada, Alfonso; Armelles, Gaspar; Sepúlveda, Borja; Alaverdyan, Yury; Käll, Mikael (2008). "Plasmonic Au/Co/Au nanosandwiches with Enhanced Magneto-Optical Activity". Small. 4 (2): 202–5. doi:10.1002/smll.200700594. hdl:10261/17402. PMID 18196506.
- ^ Du, Guan Xiang; Mori, Tetsuji; Suzuki, Michiaki; Saito, Shin; Fukuda, Hiroaki; Takahashi, Migaku (2010). "Evidence of localized surface plasmon enhanced magneto-optical effect in nanodisk array". Appl. Phys. Lett. 96 (8): 081915. Bibcode:2010ApPhL..96h1915D. doi:10.1063/1.3334726.
- ^ Zeng, Shuwen; Yu, Xia; Law, Wing-Cheung; Zhang, Yating; Hu, Rui; Dinh, Xuan-Quyen; Ho, Ho-Pui; Yong, Ken-Tye (2013). "Size dependence of Au NP-enhanced surface plasmon resonance based on differential phase measurement". Sensors and Actuators B: Chemical. 176: 1128–1133. doi:10.1016/j.snb.2012.09.073.
- ^ Jump up to: a b Maradudin, Alexei A.; Sambles, J. Roy; Barnes, William L., eds. (2014). Modern Plasmonics. Amsterdam: Elsevier. p. 1–23. ISBN 9780444595263.
- ^ Minh Hiep, Ha; Endo, Tatsuro; Kerman, Kagan; Chikae, Miyuki; Kim, Do-Kyun; Yamamura, Shohei; Takamura, Yuzuru; Tamiya, Eiichi (2007). "A localized surface plasmon resonance based immunosensor for the detection of casein in milk". Sci. Technol. Adv. Mater. 8 (4): 331–338. Bibcode:2007STAdM...8..331M. doi:10.1016/j.stam.2006.12.010.
- ^ Sinibaldi, A.; Danz, N.; Descrovi, E.; et al. (2012). "Direct comparison of the performance of Bloch surface wave and surface plasmon polariton sensors". Sensors and Actuators B: Chemical. 174: 292–298. doi:10.1016/j.snb.2012.07.015.
- ^ Pillai, S.; Catchpole, K. R.; Trupke, T.; Green, M. A. (2007). "Surface plasmon enhanced silicon solar cells". J. Appl. Phys. 101 (9): 093105–093105–8. Bibcode:2007JAP...101i3105P. doi:10.1063/1.2734885. hdl:1885/16942.
- ^ Locharoenrat, Kitsakorn; Sano, Haruyuki; Mizutani, Goro (2007). "Phenomenological studies of optical properties of Cu nanowires". Sci. Technol. Adv. Mater. 8 (4): 277–281. Bibcode:2007STAdM...8..277L. doi:10.1016/j.stam.2007.02.001.
- ^ Liedberg, Bo; Nylander, Claes; Lunström, Ingemar (1983). "Surface plasmon resonance for gas detection and biosensing". Sensors and Actuators. 4: 299–304. doi:10.1016/0250-6874(83)85036-7.
- ^ Rich, RL; Myszka, DG (2007). "Higher-throughput, label-free, real-time molecular interaction analysis". Analytical Biochemistry. 361 (1): 1–6. doi:10.1016/j.ab.2006.10.040. PMID 17145039.
- ^ Granqvist, Niko; Yliperttula, Marjo; Välimäki, Salla; Pulkkinen, Petri; Tenhu, Heikki; Viitala, Tapani (18 March 2014). "Control of the Morphology of Lipid Layers by Substrate Surface Chemistry". Langmuir. 30 (10): 2799–2809. doi:10.1021/la4046622. PMID 24564782.
- ^ Jussila, Henri; Yang, He; Granqvist, Niko; Sun, Zhipei (5 February 2016). "Surface plasmon resonance for characterization of large-area atomic-layer graphene film". Optica. 3 (2): 151. Bibcode:2016Optic...3..151J. doi:10.1364/OPTICA.3.000151.
- ^ Korhonen, Kristiina; Granqvist, Niko; Ketolainen, Jarkko; Laitinen, Riikka (October 2015). "Monitoring of drug release kinetics from thin polymer films by multi-parametric surface plasmon resonance". International Journal of Pharmaceutics. 494 (1): 531–536. doi:10.1016/j.ijpharm.2015.08.071. PMID 26319634.
Further reading[]
- A selection of free-download papers on Plasmonics in New Journal of Physics
- Heinz Raether (1988). "Surface plasmons on smooth and rough surfaces and on gratings". Springer Tracts in Modern Physics. 111. Bibcode:1988STMP..111.....R. doi:10.1007/BFb0048317. ISBN 978-3-540-17363-2.
- Stefan Maier (2007). Plasmonics: Fundamentals and Applications. Springer. ISBN 978-0-387-33150-8.
- Richard B M Schasfoort; Anna J Tudos, eds. (2008). Handbook of Surface Plasmon Resonance. RSC publishing. ISBN 978-0-85404-267-8.
| hide Authority control | |
|---|---|
| General | |
| National libraries | |
| Other |
|
- Electromagnetism
- Nanotechnology
- Spectroscopy
- Biochemistry methods
- Biophysics
- Forensic techniques
- Protein–protein interaction assays
- Plasmonics
- Optical phenomena