Tauc plot
A Tauc plot[1] is used to determine the optical bandgap, or Tauc bandgap, of either disordered[2] or amorphous[3] semiconductors.
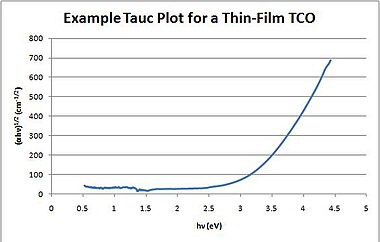
In his original work Jan Tauc (/taʊts/) showed that the optical absorption spectrum of amorphous germanium resembles the spectrum of the indirect transitions in crystalline germanium (plus a tail due to localized states at lower energies), and proposed an extrapolation to find the optical bandgap of these crystalline-like states.[4] Typically, a Tauc plot shows the quantity hν (the photon energy) on the abscissa and the quantity (αhν)1/2 on the ordinate, where α is the absorption coefficient of the material. Thus, extrapolating this linear region to the abscissa yields the energy of the optical bandgap of the amorphous material.
A similar procedure is adopted to determine the optical bandgap of crystalline semiconductors.[5] In this case, however, the ordinate is given by (α)1/r, in which the exponent 1/r denotes the nature of the transition:[6],[7],[8]
- r = 1/2 for direct allowed transitions
- r = 3/2 for direct forbidden transitions.
- r = 2 for indirect allowed transitions
- r = 3 for indirect forbidden transitions
Again, the resulting plot (quite often, incorrectly identified as a Tauc plot) has a distinct linear region that, extrapolated to the abscissa, yields the energy of the optical bandgap of the material.[9]
See also[]
References[]
- ^ Tauc, J. (1968). "Optical properties and electronic structure of amorphous Ge and Si". Materials Research Bulletin. 3: 37–46. doi:10.1016/0025-5408(68)90023-8.
- ^ Mott, N. F. & Davis, E. A. (1979). Electronic processes in non-crystalline materials. Clarendon Press, Oxford. ISBN 0-19-851288-0.CS1 maint: multiple names: authors list (link)
- ^ Street, R. A. (1991). Hydrogenated amorphous silicon. . ISBN 0-521-37156-2.
- ^ Tauc, J.; Grigorovici, R.; Vancu, A. (1966). "Optical Properties and Electronic Structure of Amorphous Germanium". Physica Status Solidi B. 15 (2): 627. Bibcode:1966PSSBR..15..627T. doi:10.1002/pssb.19660150224.
- ^ Yu, P. Y. & Cardona, M. (1996). Fundamentals of semiconductors. . ISBN 3-540-61461-3.CS1 maint: multiple names: authors list (link)
- ^ MacFarlane, G. G. & Roberts, V. (1955). "Infrared absorption of germanium near the lattice edge". Physical Review. 97 (6): 1714–1716. doi:10.1103/PhysRev.97.1714.2.CS1 maint: multiple names: authors list (link)
- ^ MacFarlane, G. G., McLean, T. P., Quarrington, J. E. & Roberts, V. (1958). "Fine structure in the absorption-edge spectrum of Si". Physical Review. 111 (5): 1245–1254. doi:10.1103/PhysRev.111.1245.CS1 maint: multiple names: authors list (link)
- ^ Davis, E. A.; Mott, N. F. (1970). "Conduction in non-crystalline systems V. Conductivity, optical absorption and photoconductivity in amorphous semiconductors". Philosophical Magazine A. 22 (179): 903–922. doi:10.1080/14786437008221061.
- ^ Zanatta, A. R. (2019). "Revisiting the optical bandgap of semiconductors and the proposal of a unified methodology to its determination". Scientific Reports. 9: 11225–12pp. doi:10.1038/s41598-019-47670-y.
- Plots (graphics)
- Thin films
- Semiconductor analysis