Terminal area chart
In United States and Canada aviation, Terminal area charts are aeronautical charts intended for navigation under Visual Flight Rules that depict areas surrounding major airports, primarily those with Class B airspace.
Overview[]
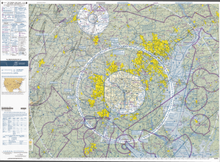
Like the VFR sectional charts that they complement, terminal area charts depict topographic features and other information of interest to aviators flying visually, including major landmarks, terrain elevations, visual navigation routes, ground-based navigation aids, airports, rivers, cities, and airspace boundaries. TACs are more detailed than sectional charts, and are scaled at 1:250,000 (as opposed to 1:500,000 for sectional charts) to permit inclusion of more detail. TACs contain information on approach, departure, and transition rules and procedures for the congested Class B areas around major airports.
Terminal area charts for the USA are maintained and published by the United States Federal Aviation Administration, and by commercial enterprises (notably Jeppesen) that produce equivalent, certified charts, often with some added value over the government charts, but with a higher price.
The reverse side of a paper copy of the TAC often provides a , a simplified chart that shows preferred VFR routes through the area covered by the TAC.
TACs are updated at six-month intervals.
Historically, they were called local aeronautical charts.[1][failed verification]
See also[]
- Aeronautical chart conventions (United States) Conventions used in U.S. aeronautical charts
References[]
- ^ "Local Aeronautical Chart, Seattle, October 21, 1954". Museum of History and Industry. Retrieved 23 November 2021.
External links[]
- VFR Terminal Area Raster Aeronautical Charts - Current charts from the FAA
- Air traffic control in the United States
- Air traffic control in Canada
- Map types
- Air navigation
- Aeronautical charts