Trophic state index

The Trophic State Index (TSI) is a classification system designed to rate water bodies based on the amount of biological productivity they sustain.[1] Although the term "trophic index" is commonly applied to lakes, any surface water body may be indexed.
The TSI of a water body is rated on a scale from zero to one hundred.[1] Under the TSI scale, water bodies may be defined as:[1]
- oligotrophic (TSI 0–40, having the least amount of biological productivity, "good" water quality);
- mesotrophic (TSI 40–60, having a moderate level of biological productivity, "fair" water quality); or
- eutrophic to hypereutrophic (TSI 60–100, having the highest amount of biological productivity, "poor" water quality).
The quantities of nitrogen, phosphorus, and other biologically useful nutrients are the primary determinants of a water body's TSI. Nutrients such as nitrogen and phosphorus tend to be limiting resources in standing water bodies, so increased concentrations tend to result in increased plant growth, followed by corollary increases in subsequent trophic levels.[a] Consequently, trophic index may sometimes be used to make a rough estimate of biological condition of water bodies.[2]
Carlson's Trophic State Index[]
Carlson's index was proposed by Robert Carlson in his 1977 seminal paper, "A trophic state index for lakes".[3] It is one of the more commonly used trophic indices and is the trophic index used by the United States Environmental Protection Agency.[2] The trophic state is defined as the total weight of biomass in a given water body at the time of measurement. Because they are of public concern, the Carlson index uses the algal biomass as an objective classifier of a lake or other water body's trophic status.[3] According to the US EPA, the Carlson Index should only be used with lakes that have relatively few rooted plants and non-algal turbidity sources.[2]
Index variable[]
Because they tend to correlate, three independent variables can be used to calculate the Carlson Index: chlorophyll pigments, total phosphorus and Secchi depth. Of these three, chlorophyll will probably yield the most accurate measures, as it is the most accurate predictor of biomass. Phosphorus may be a more accurate estimation of a water body's summer trophic status than chlorophyll if the measurements are made during the winter. Finally, the Secchi depth is probably the least accurate measure, but also the most affordable and expedient one. Consequently, citizen monitoring programs and other volunteer or large-scale surveys will often use the Secchi depth. By translating the Secchi transparency values to a log base 2 scale, each successive doubling of biomass is represented as a whole integer index number.[4] The Secchi depth, which measures water transparency, indicates the concentration of dissolved and particulate material in the water, which in turn can be used to derive the biomass. This relationship is expressed in the following equation:
- where z = the depth at which the disk disappears,
- I0 is the intensity of light striking the water's surface,
- Iz is about 10% of I0 and is considered a constant,
- kw is a coefficient for the attenuation of light by water and dissolved substances,
- α is treated as a constant with the units of square meters per milligram and
- C is the concentration of particulate matter in units for milligrams per cubic meter.[3]

Trophic classifications[]
A lake is usually classified as being in one of three possible classes: oligotrophic, mesotrophic or eutrophic. Lakes with extreme trophic indices may also be considered hyperoligotrophic or hypereutrophic (also "hypertrophic"). The table below demonstrates how the index values translate into trophic classes.
| Trophic State Index | Chlorophyll (µg/l) | Phosphorus (µg/l) | Secchi depth | Trophic Class |
|---|---|---|---|---|
| < 30—40 | 0—2.6 | 0—12 | > 8—4 | Oligotrophic or hipotrophic |
| 40—50 | 2.6—20 | 12—24 | 4—2 | Mesotrophic |
| 50—70 | 20—56 | 24—96 | 2—0.5 | Eutrophic |
| 70—100+ | 56—155+ | 96—384+ | 0.5— < 0.25 | Hypertrophic |
Oligotrophic lakes generally host very little or no aquatic vegetation and are relatively clear, while eutrophic lakes tend to host large quantities of organisms, including algal blooms. Each trophic class supports different types of fish and other organisms, as well. If the algal biomass in a lake or other water body reaches too high a concentration (say >80 TSI), massive fish die-offs may occur as decomposing biomass deoxygenates the water.
Oligotrophic[]
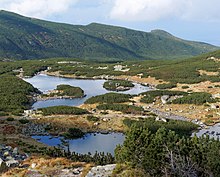
Limnologists use the term "oligotrophic" or "hipotrophic" to describe lakes that have low primary productivity due to nutrient deficiency. (This contrasts against eutrophic lakes, which are highly productive due to an ample supply of nutrients, as can arise from human activities such as agriculture in the watershed.)
Oligotrophic lakes are most common in cold, sparsely developed regions that are underlain by crystalline igneous, granitic bedrock. Due to their low algal production, these lakes consequently have very clear waters, with high drinking-water quality.
Lakes that have intermixing of their layers are classified into the category of holomictic, whereas lakes that do not have interlayer mixing are permanently stratified and thus are termed meromictic.
Generally, in a holomictic lake, during the fall, the cooling of the epilimnion reduces lake stratification, thereby allowing for mixing to occur. Winds aid in this process.[5] Thus it is the deep mixing of lakes (which occurs most often during the fall and early winter, in holomictic lakes of the monomictic subtype) that allows oxygen to be transported from the epilimnion to the hypolimnion.[6][7] [8]
In this way, oligotrophic lakes can have significant oxygen down to the depth to which the aforementioned seasonal mixing occurs, but they will be oxygen deficient below this depth. Therefore, oligotrophic lakes often support fish species such as lake trout, which require cold, well-oxygenated waters. The oxygen content of these lakes is a function of their seasonally mixed hypolimnetic volume. Hypolimnetic volumes that are anoxic will result in fish congregating in areas where oxygen is sufficient for their needs.[6]
Anoxia is more common in the hypolimnion during the summer when mixing does not occur.[5] In the absence of oxygen from the epilimnion, decomposition can cause hypoxia in the hypolimnion.[9]
Mesotrophic[]
Mesotrophic lakes are lakes with an intermediate level of productivity. These lakes are commonly clear water lakes and ponds with beds of submerged aquatic plants and medium levels of nutrients.
The term mesotrophic is also applied to terrestrial habitats. Mesotrophic soils have moderate nutrient levels.
Eutrophic and hypertrophic[]
Eutrophic[]
A eutrophic water body, commonly a lake or pond, has high biological productivity. Due to excessive nutrients, especially nitrogen and phosphorus, these water bodies are able to support an abundance of aquatic plants. Usually, the water body will be dominated either by aquatic plants or algae. When aquatic plants dominate, the water tends to be clear. When algae dominate, the water tends to be darker. The algae engage in photosynthesis which supplies oxygen to the fish and biota which inhabit these waters. Occasionally, an excessive algal bloom will occur and can ultimately result in fish death, due to respiration by algae and bottom-living bacteria. The process of eutrophication can occur naturally and by human impact on the environment.
Eutrophic comes from the Greek eutrophos meaning "well-nourished", from eu meaning good and trephein meaning "to nourish".[10]
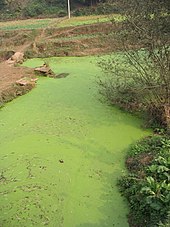
Hypertrophic[]
Hypertrophic or hypereutrophic lakes are very nutrient-rich lakes characterized by frequent and severe nuisance algal blooms and low transparency. Hypereutrophic lakes have a visibility depth of less than 3 feet (90 cm), they have greater than 40 micrograms/litre total chlorophyll and greater than 100 micrograms/litre phosphorus.
The excessive algal blooms can also significantly reduce oxygen levels and prevent life from functioning at lower depths creating dead zones beneath the surface.
Likewise, large algal blooms can cause biodilution to occur, which is a decrease in the concentration of a pollutant with an increase in trophic level. This is opposed to biomagnification and is due to a decreased concentration from increased algal uptake.
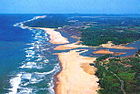
Trophic index drivers[]
Both natural and anthropogenic factors can influence a lake or other water body's trophic index. A water body situated in a nutrient-rich region with high net primary productivity may be naturally eutrophic. Nutrients carried into water bodies from non-point sources such as agricultural runoff, residential fertilisers, and sewage will all increase the algal biomass, and can easily cause an oligotrophic lake to become hypereutrophic.
Management targets[]
Often, the desired trophic index differs between stakeholders. Water-fowl enthusiasts (e.g. duck hunters) may want a lake to be eutrophic so that it will support a large population of waterfowl. Residents, though, may want the same lake to be oligotrophic, as this is more pleasant for swimming and boating. Natural resource agencies are generally responsible for reconciling these conflicting uses and determining what a water body's trophic index should be.
See also[]
| Look up oligotrophic, mesotrophic, or hypertrophic in Wiktionary, the free dictionary. |
- Biomass (ecology)
- Eutrophication
- Nonpoint source pollution
- Secchi disk
- Surface runoff
- Trophic level
- Trophic level index, a similar measure used in New Zealand
- Water quality
- List of biological development disorders
Notes[]
- ^ Note that this use of trophic levels refers to feeding dynamics, and has a much different meaning than the trophic index of water bodies.
References[]
- ^ Jump up to: a b c University of Southern Florida Water Institute. "Trophic State Index (TSI)". Learn More About Trophic State Index (TSI) - Lake.WaterAtlas.org. University of Southern Florida. Retrieved 6 June 2018.
- ^ Jump up to: a b c United States Environmental Protection Agency (2007) Carlson's Trophic State Index. Aquatic Biodiversity. http://www.epa.gov/bioindicators/aquatic/carlson.html accessed 17 February 2008.
- ^ Jump up to: a b c Carlson, R.E. (1977) A trophic state index for lakes. Limnology and Oceanography. 22:2 361–369.
- ^ Jump up to: a b Carlson R.E. and J. Simpson (1996) A Coordinator's Guide to Volunteer Lake Monitoring Methods. North American Lake Management Society. 96 pp.
- ^ Jump up to: a b Dodds, Walter K. (Walter Kennedy), 1958- (2010). Freshwater ecology : concepts and environmental applications of limnology. Whiles, Matt R. (2nd ed.). Burlington, MA: Academic Press. ISBN 978-0-12-374724-2. OCLC 784140625.CS1 maint: multiple names: authors list (link)
- ^ Jump up to: a b Sánchez-España, Javier; Mata, M. Pilar; Vegas, Juana; Morellón, Mario; Rodríguez, Juan Antonio; Salazar, Ángel; Yusta, Iñaki; Chaos, Aida; Pérez-Martínez, Carmen; Navas, Ana (2017-12-01). "Anthropogenic and climatic factors enhancing hypolimnetic anoxia in a temperate mountain lake". Journal of Hydrology. 555: 832–850. Bibcode:2017JHyd..555..832S. doi:10.1016/j.jhydrol.2017.10.049. ISSN 0022-1694.
- ^ Sahoo, G. B.; Schladow, S. G.; Reuter, J. E.; Coats, R. (2010-07-09). "Effects of climate change on thermal properties of lakes and reservoirs, and possible implications". Stochastic Environmental Research and Risk Assessment. 25 (4): 445–456. doi:10.1007/s00477-010-0414-z. ISSN 1436-3240.
- ^ Dissolved Oxygen. https://www.fondriest.com/environmental-measurements/parameters/water-quality/dissolved-oxygen Fondriest Environmental Products, access date 2020-11-28.
- ^ Weinke, Anthony D.; Biddanda, Bopaiah A. (2019-12-01). "Influence of episodic wind events on thermal stratification and bottom water hypoxia in a Great Lakes estuary". Journal of Great Lakes Research. 45 (6): 1103–1112. doi:10.1016/j.jglr.2019.09.025. ISSN 0380-1330.
- ^ Definition of eutrophic at dictionary.com.
| show Aquatic ecosystems |
|---|

- Aquatic ecology
- Environmental science
- Water pollution
- Lakes
- Limnology