Water in California

California's interconnected water system serves over 30 million people and irrigates over 5,680,000 acres (2,300,000 ha) of farmland.[1] As the world's largest, most productive, and potentially most controversial water system,[2][page needed] it manages over 40 million acre-feet (49 km3) of water per year.[3]
Water and water rights are among the state's divisive political issues. Due to the lack of reliable dry season rainfall, water is limited in the most populous U.S. state. An ongoing debate is whether the state should increase the redistribution of water to its large agricultural and urban sectors, or increase conservation and preserve the natural ecosystems of the water sources.
Sources of water[]
California's limited water supply comes from two main sources: surface water, or water that travels or gathers on the ground, like rivers, streams, and lakes; and groundwater, which is water that is pumped out from the ground. California has also begun producing a small amount of desalinated water, water that was once sea water, but has been purified.
Groundwater[]
This section's factual accuracy may be compromised due to out-of-date information. (August 2017) |
Groundwater is a critical element of the California water supply. During a normal year, 30% of the state's water supply comes from groundwater (underground water). In times of intense drought, groundwater consumption can rise to 60% or more.[4] Over 850,000,000 acre-feet (1,050 km3) of water is stored in California's 450 known groundwater reservoirs.[4] However, not all the water is usable. Over half of the groundwater is unavailable due to poor quality and the high cost of pumping the water from the ground. While surface water is concentrated mostly in the northern part of the state, groundwater is more evenly distributed.[4]
The largest groundwater reservoirs are found in the Central Valley.[4] The majority of the supply there is in the form of runoff that seeps into the aquifer. The freshwater is usually found in deposits of gravel, silt, and sand. Below these deposits lies a layer of deep sediment, a relic of the era when the Pacific Ocean covered the area.
Though California has laws governing surface water usage and quality, there exist no statewide groundwater management laws. Each groundwater basin is individually adjudicated to determine water rights.[5] Otherwise, for all practical purposes, land ownership implicitly carries the right to virtually unlimited groundwater pumping.
The large quantity of water beneath the surface has given rise to the misconception that groundwater is a sort of renewable resource that can be limitlessly tapped. Calculations assuming that groundwater usage is sustainable if the rate of removal equals the rate of recharge are often incorrect as a result of ignoring changes in water consumption and water renewal.[6]
While the volume of groundwater in California is very large, aquifers can be over drafted when groundwater is removed more rapidly than it is replenished. In 1999, it was estimated that the average, annual overdrafting was around 2,200,000 acre-feet (2.7 km3) across the state, with 800,000 acre-feet (0.99 km3) in the Central Valley.[7][page needed] Since then, overdrafting had significantly increased. Satellite measurements found that in just the combined Sacramento and San Joaquin River basins, including the Central Valley, overdrafting between 2011 and 2014 was 12,000,000 acre-feet (15 km3) of water per year.[8]
Surface water[]


California has ten major drainage basins defined for convenience of water management. These basins are divided from one another by the crests of mountains. From north to south the basins are: North Coast, Sacramento River, North Lahontan, San Francisco Bay, San Joaquin River, Central Coast, Tulare Lake, South Lahontan, South Coast, and Colorado River regions. Each region incorporates watersheds from many rivers of similar clime.
The Central Valley watershed, which incorporates the Sacramento River, San Joaquin River and Tulare Lake regions, is the largest in California, draining over a third of the state – 60,000 square miles (160,000 km2) – and producing nearly half the total runoff.[9][10] The Sierra Nevada snowpack feeds Central Valley river systems and is a critical source of water in the state's long dry season when little if any precipitation falls. Up to 30 percent of California's water supply is from snowpack.[11] Much of California's extensive reservoir and aqueduct system is designed to store and capture runoff from the Central Valley watershed. The Sacramento and San Joaquin Rivers converge at the Sacramento–San Joaquin River Delta, a large fresh-water estuary where much of the state's water supply is withdrawn. The Central Valley watershed provides most of the water for Northern and Central California, as well as a significant chunk of Southern California's usage.[10]
The North Coast watershed receives the highest annual precipitation of any California watershed. It incorporates many large river systems such as the Klamath, Smith, Trinity, and Eel, and produces over a third of the runoff in the state. With a few exceptions, the North Coast watersheds are relatively undeveloped, some have federal Wild and Scenic status; the northern coastal rivers provide water to biodiverse salmon habitat, carbon-sequestering forests, and local communities; some are within the influence of tribal water and fishing rights. Water flowing in these watersheds and into the Pacific Ocean is critical for sensitive, threatened, and endangered salmonids. There have been several proposals to divert additional water from North Coast rivers to increase water supplies in the rest of California, short of adequate water conservation strategies in the rest of the state, but these projects have been rejected due to cost and projected environmental harm.[12]
The Colorado River originates more than 1,000 miles (1,600 km) from California in the Rocky Mountains of Colorado and Wyoming and forms the state's southeastern border in the Mojave Desert. Unlike the other California watersheds, essentially all of the water flowing in the Colorado originates outside the state. The Colorado is a critical source of irrigation and urban water for southern California, providing between 55 and 65 percent of the total supply.[13]
The Central and South Coast watersheds include the most populous regions of California – the San Francisco Bay Area, Los Angeles and San Diego – but have relatively little natural runoff, requiring the importation of water from other parts of the state.
Rivers of the Lahontan watersheds in eastern California are part of the high desert Great Basin and do not drain to the Pacific. Most of the water is used locally in eastern California and western Nevada for irrigation. The Owens River of the South Lahontan region, however, is a principal source of water for Los Angeles.
| Hydrologic region | Annual precipitation | Annual runoff |
|---|---|---|
| North Coast | 55,900,000 acre-feet (69.0 km3) | 28,900,000 acre-feet (35.6 km3) |
| Sacramento River | 52,400,000 acre-feet (64.6 km3) | 22,400,000 acre-feet (27.6 km3) |
| North Lahontan | 6,000,000 acre-feet (7.4 km3) | 1,900,000 acre-feet (2.3 km3) |
| San Francisco Bay | 5,500,000 acre-feet (6.8 km3) | 1,200,000 acre-feet (1.5 km3) |
| San Joaquin River | 21,800,000 acre-feet (26.9 km3) | 7,900,000 acre-feet (9.7 km3) |
| Central Coast | 12,300,000 acre-feet (15.2 km3) | 2,500,000 acre-feet (3.1 km3) |
| Tulare Lake | 13,900,000 acre-feet (17.1 km3) | 3,300,000 acre-feet (4.1 km3) |
| South Lahontan | 9,300,000 acre-feet (11.5 km3) | 1,300,000 acre-feet (1.6 km3) |
| South Coast | 10,800,000 acre-feet (13.3 km3) | 1,200,000 acre-feet (1.5 km3) |
| Colorado River | 4,300,000 acre-feet (5.3 km3) | 200,000 acre-feet (0.25 km3) |
Rain and snowfall[]
Rain typically falls in California only during the winter and spring months, from October through May, with more rain falling on the northern half of the state than the southern. Approximately 75 percent of the total precipitation volume occurs north of Sacramento, while 75 percent of the total water demand is in the south. With very rare exceptions, summers are dry throughout the state. Precipitation falling as snow in the Sierra and other mountain ranges feeds the network of reservoirs and surface water sources that supply the state; a low rainfall or light snowfall year can result in drought.
Rivers in northern and coastal California are mainly rain fed, peaking from January to April and falling to very low levels between June and November. Snowmelt has a significant influence on the Sierra Nevada rivers from east of Sacramento to east of Bakersfield, which typically peak between April and July. Snowmelt is also the primary water source for the Colorado River which supplies southern California.
California precipitation and snowpack is measured by the state of California by "water year", which runs from October 1 to September 30.[15]
Desalination[]
In response to water shortages in the state, some water districts are looking to desalination as a way to provide water for residents. Supporters view seawater desalination as a safer water source, since it draws its water from the ocean and thus, is not affected by periods of drought like other sources of water are. Another incentive for desalination is the ability for localities to be more self-sufficient with their water supply, thus improving their drought resilience. However, desalination has been the subject of scrutiny by opponents, who believe that the costs and possible environmental effects of desalination are indicators that California should continue to pursue other alternatives.[16]
Although the response to desalination has been mixed, some areas of California are moving forward with seawater desalination. In December 2015, Poseidon Water completed the construction of the Claude "Bud" Lewis Carlsbad Desalination Plant.[17] This facility, which was approved by the San Diego Water Authority, is responsible for providing water for about 8% of San Diego County's water by the year 2020.[18] The facility cost $1 billion to build and is the largest desalination facility in the Western Hemisphere producing up to 50 million gallons (190,000 m3) of water per day.[19] As of December 2015, there are 6 additional seawater desalination plants currently in operation in the state of California. As of May 2016, there are also 9 more proposed desalination plants.[20]
Reuse[]
Water always gets recycled, via rivers, aquifers, and the atmosphere, but we can also do this directly and intentionally. Water reuse in California is increasingly important, with reclaimed water being used preferably for agricultural irrigation, toilet flushing, and industry (e.g., making concrete, cooling), although some apply direct and indirect potable reuse, risking environmental persistent pharmaceutical pollutants and other constituents of emerging concern. Treatment should be in accordance with the use and, in many cases, water can be safely and productively recycled back to the same non-potable use.[21]
Uses of water[]
This section needs additional citations for verification. (October 2014) |

Water use in California is divided into approximately 51% for environmental uses, 39% agricultural use and 11% urban uses, though that varies considerably between regions and between wet and dry years.[22] Solely relying on these statewide volumes is controversial because they don't consider the fact that most of the volume of water used for environmental purposes includes flows down Wild and Scenic Rivers in the North Coast where there is no practical way to recover it for either agricultural or urban use because it lacks many connections to the statewide water supply system.[23] It also doesn't factor in the amount of water required to keep salty water from the Pacific Ocean from intruding into the Delta beyond a certain small concentration.[23] Otherwise, "reduced water quality resulting from large amounts of salt water drawn into the Delta could shut down the export pumps that supply fresh water to agriculture and cities."[24][25]
Around 75% of California's water supply comes from north of Sacramento, while 80% of the water demand occurs in the southern two-thirds of the state.[26] The Sacramento-San Joaquin River Delta Estuary located between San Francisco Bay and Sacramento receives about 40% of California's total precipitation and 50% of its total streamflow. It is a critical hub used by the federal Central Valley Project and California State Water Project to connect water collected and stored in the north regions of the state with aqueducts and canals that transport it to users in the North Bay, South Bay, East Bay, and Greater Southern California. In a typical year, about 10.8 million acre-feet (13.3 km3) are exported from the Delta: 67% is delivered by the Central Valley Project, 26% by the State Water Project and the remainder to other federal water project users.[27] Those flows are greatly reduced in drought years. About 16.5 million acre-feet (20.4 km3) of water entering the Delta in a typical year flows through the Delta into San Francisco Bay, including 6.3 million acre-feet (7.8 km3) in governmentally mandated environmental flows; 22.4 million acre-feet (27.6 km3) is used for other environmental purposes, and 1.6 million acre-feet (2.0 km3) supplies water to managed wetlands and wildlife preserves.[28]
Agricultural[]
In an average year, about 39% of California's water consumption, or 34.1 million acre-feet (42.1 km3), is used for agricultural purposes. Of that total, 11%, or 8.9 million acre-feet (11.0 km3) is not consumed by the farms for crop production but is instead recycled and reused by other water users, including environmental use, urban use, and agricultural use, yielding net water consumption for food and fiber production equal to 28% of California's water consumption, or 25.2 million acre-feet (31.1 km3).[28] This water irrigates almost 29 million acres (120,000 km2), which grows 350 different crops. Agricultural water usage varies depending on the amount of rainfall each year.

As of 2014 Alfalfa uses about 18% of California irrigation water and produces 4% of California's farm-gate revenue, most of which is used as livestock feed.[29] In 2015, California exported one-fourth of its total alfalfa production of roughly 2 million tons. About one-third of that, around 700,000 tons, went to China, Japan took about the same amount and Saudi Arabia bought 5,000 tons. Alfalfa farmers pay about $70 per acre-foot ($0.057/m3), in Los Angeles that same amount of water is worth $1,000 per acre-foot ($0.81/m3).[30] In 2012, California exported 575,000 tons of alfalfa to China, for $586 million.[29] Other common crop water use, if using all irrigated water: fruits and nuts with 34% of water use and 45% of revenue, field crops with 14% of water and 4% of revenue, pasture forage with 11% of water use and 1% of revenue, rice with 8% of water use and 2% of revenue (despite its lack of water, California grows nearly 5 billion pounds (2.3 million metric tons) of rice per year, and is the second largest rice-growing state[31][32]), and truck farming of vegetables and nursery crops with 4% of water use and 42% of revenue; head of broccoli: 5.4 gallons; one walnut: 4.9 gallons; head of lettuce: 3.5 gallons; one tomato: 3.3 gallons; one almond 1.1 gallon; one pistachio: 0.75 gallon; one strawberry 0.4 gallon; one grape: 0.3 gallon.[33][34]
Horses, based on the amount of alfalfa they eat, use about 1.9 million acre-feet (2.3 km3) of water – about 7% of irrigated water in the state. There are 698,000 horses in California.[35]
California is one of the top five states in water use for livestock. Water withdrawals for livestock use in California were 101 to 250 million US gallons (380,000 to 950,000 m3) per day in 2010.[36]
Urban/residential[]
Urban and industrial use of water consumes about 11%, or 8.9 million acre-feet (11.0 km3), of total water consumption in an average year.[28] A 2011 study of a sampling of 735 California homes across ten water districts found that the weighted average annual total water use of these homes was 132,000 US gallons (500 m3) per year or 362 US gallons (1.37 m3) per household per day.[37] The study found that about 53% of total average household water use, or more than 192 US gallons (0.73 m3) per household per day, was used for landscaping and other outdoor uses. Meanwhile, indoor use accounted for more than 170 US gallons (0.64 m3) per household per day. The most in-home water consumption is toilet flushes, using 20% of the water. After toilets, 20% is used for showers and 18% goes to leaks inside homes.[38]
In Sacramento, in 2012 before the severe drought started, residents were using 217 US gallons (0.82 m3) a day per-capita.[39] Many homes in Sacramento didn't have water meters until recently. They now are gradually being installed after former Gov. Arnold Schwarzenegger signed a 2004 law mandating meters statewide by 2025.[40]
After Folsom, a city of 72,000 east of Sacramento, installed meters in 2011 and adopted tiered rates that charge more for people who consume the most water, per-capita use started falling steadily.[40]
In response to the severe California drought, in April 2015, Governor Jerry Brown issued an executive order mandating statewide reductions in water use. The mandate aimed to reduce the amount of water consumed statewide in urban areas by 25% from 2013 levels. The State Water Resources Control Board (SWRCB) proposed regulatory instructions that grouped urban water utilities into nine tiers, with conservation standards ranging from 8% to 36%.[41]
Water distribution[]
There are six main systems of aqueducts and infrastructure that redistribute and transport water in California: the State Water Project, the Central Valley Project, several Colorado River delivery systems, the Los Angeles Aqueduct, the Tuolumne River/Hetch Hetchy system, and the Mokelumne Aqueduct.
The State Water Project[]

The California State Water Project is the largest multipurpose, state-built water project in the United States.[42] The SWP transports water from the Feather River watershed to agriculture, and some of the water goes to industrial and urban users. More than two-thirds of Californians receive some water from the SWP. The system was designed and contracted to deliver 4.2 million acre-feet (5.2 km3), but in an average year delivers only 2.3 million acre-feet (2.8 km3) because many of the original planned features were never built.[14] Twenty-nine agencies hold contracts for SWP water. The contractors pay for SWP's major operating costs and have gradually reduced the $1.75 billion bond debt that supplied funds for initial construction. In the years since 1960, SWP has built 29 dams, 18 pumping plants, five hydroelectric power plants, and around 600 miles (970 km) of canals and pipelines.[43]
The SWP system begins with reservoirs on upper tributaries of the Feather River. Oroville Dam creates the largest SWP reservoir. At 770 feet (230 m) above the riverbed, the dam is the tallest in the United States. The reservoir covers 15,000 acres (61 km2) and holds 3.5 million acre-feet (4.3 km3).[44] Water travels from Lake Oroville to the Sacramento River. At Harvey O. Banks Delta Pumping Plant, which pulls SWP water into the Bethany Reservoir, around 2.2 million acre-feet (2.7 km3) are extracted from the Delta each year.[45] Water that flows to the south end of the San Joaquin Valley must be pumped over the Tehachapi Mountains. Because of this, the SWP is California's largest energy consumer, and even though the hydroelectric plants of the SWP generate 5,900 GWh per year, that is only a fraction of the energy needed to lift water over the Tehachapis.[46] Below the Tehachapis the California Aqueduct splits, with the west branch storing water in Castaic and Pyramid Lake, and the east branch storing water in the Silverwood Lake reservoir.
The Central Valley Project[]

The CVP's original purpose was to tame seasonal flooding and to direct water to the south to irrigate 3 million acres (12,000 km2) of farmland. The CVP is operated by the United States Bureau of Reclamation. As one of the largest water systems in the world it stores over 7 million acre-feet (8.6 km3) of water, or 17 percent of the state's developed water.[47] The CVP dams and diverts five major rivers: the Trinity, the Sacramento, the American, the Stanislaus, and the San Joaquin. Friant Dam, on the San Joaquin, was completed in 1944, forming Millerton Lake. This was one of 20 reservoirs in the CVP. Shasta Dam, the largest CVP storage facility, was completed in 1945. At Sacramento, American River water stored by Folsom Dam is added. 2.5 million acre-feet (3.1 km3) are annually pumped from the Delta into the Delta-Mendota Canal. New Melones Dam on the Stanislaus River was finished in 1979, and the reservoir was filled in 1982.
The CVP has generated some controversy about environmental damage, prices charged to farmers, and lax enforcement of farm size limitations. Bureau of Reclamation water was supposed to be used for farms limited to 160 acres (65 ha) (see Homestead Act). Under Spanish and Mexican land grants, however, there were only a few land owners, all of whom owned large tracts of land. A 1982 reform increased CVP area limits to 960 acres (3.9 km2).[48] In 1992, the Central Valley Project Improvement Act made fish and wildlife protection and restoration an authorized purpose of the CVP on an equal footing with other authorized purposes. 0.8 million acre-feet (0.99 km3) of annual runoff were dedicated to environmental usage, which generated intense controversy.[49]
Colorado River Systems[]
The Colorado River is the source of 4.4 million acre-feet (5.4 km3) per year for California.[50] Six other states along the river's watershed (Wyoming, Nevada, Utah, Colorado, New Mexico, and Arizona) and Mexico, share allocated portions of river water. The Metropolitan Water District of Southern California, or MWD, holds priority water rights on the Colorado. It sells water to 95 percent of the South Coast region. Lake Mead, formed by Hoover Dam, is the primary reservoir in the Colorado River basin. The Colorado River Aqueduct begins 155 miles (249 km) downstream from Hoover Dam, and can carry 1.2 million acre-feet (1.5 km3) annually.
An additional system diverts water from the Colorado River at the Imperial Diversion Dam provides waters to the Imperial and Coachella valleys as well as Yuma, Arizona, via the Alamo Canal, the Coachella Canal and the All-American Canal, which runs alongside the Mexican border. This system was also responsible for the accidental re-creation of the Salton Sea in 1905.
The Colorado is considered over-allocated, because apportionments were made on inaccurate measurements of annual runoff. Marc Reisner in Cadillac Desert noted that the Colorado is "unable to satisfy all the demands on it, so it is referred to as a 'deficit' river, as if the river were somehow at fault for its overuse".[51] For years California took more than its share of the apportionment, because other states were not prepared to use their entire allotments. MWD became used to 0.8 million acre-feet (0.99 km3) excess of water. Pressure from other Colorado river states caused the Secretary of the Interior to order California to show progress towards decreasing its dependency on the excess 0.8 million acre-feet (0.99 km3), or face cuts.[52] The Colorado River Water Use Plan called for Imperial and Coachella Valley agriculture to give up water in order to reallocate 0.8 million acre-feet (0.99 km3) within the state. The plan's proposals generated much controversy, and the deadline arrived with no agreement reached. The Department of the Interior reduced MWD's access by 0.415 million acre-feet (0.512 km3).
The Los Angeles Aqueduct[]

The Los Angeles Aqueduct carries water from the Eastern Sierra Nevada to Los Angeles. The construction of the aqueduct marked the first major water delivery project in California. The city purchased 300,000 acres (1,200 km2) of land in the Owens Valley in order to gain access to water rights. The Los Angeles Department of Water and Power transports 0.4 million acre-feet (0.49 km3) of Eastern Sierra Nevada water to the city each year. This growth clearly shows William Mulholland's observation that "Whoever brings the water, brings the people."[53]
After four decades of diversion from the Mono Lake area, environmental damage created an environmental battle in the 1980s, with a victory for the Mono Lake proponents in 1994.[54] Other problems arose when dust from the bed of Owens Lake (completely dried up by diversions) became a major source of air pollution in the southern Owens Valley. To restore Mono Lake, correct air-quality law violations, and rewater portions of the Owens River, Los Angeles has begun to reduce its dependence on Eastern Sierra Nevada water. This has mostly been achieved through water conservation. The city enacted a program offering free low-flow toilets to its customers.[55]
Hetch Hetchy Aqueduct[]
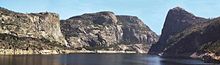
The Hetch Hetchy Aqueduct carries water from the Tuolumne River to San Francisco and other Bay Area regions. The system starts in Hetch Hetchy Valley, inside Yosemite National Park. The system also generates up to 400MW of electrical power, depending on rainfall, most of which is sent to San Francisco via city-owned power lines.[56] After water leaves Hetch Hetchy, it passes through tunnels towards powerhouses. Three pipes then bring the water across the Central Valley. Concerns about the Hetch Hetchy Aqueduct's ability to withstand earthquakes led to a $1.7 billion bond, approved by voters in November 2002.[57]
Mokelumne Aqueduct[]
The East Bay Municipal Utility District (EBMUD) serves 35 communities in Alameda and Contra Costa Counties, including Berkeley and Oakland. The Mokelumne River in the central Sierra Nevada is the source for almost all of EBMUD's water. EBMUD built the Pardee Dam across the Mokelumne in the foothills northeast of Stockton. South of Pardee is Camanche Reservoir, which regulates releases to serve downstream water rights holders. EBMUD holds almost 30,000 acres (120 km2) in the Mokulumne River watershed and 25,000 acres (100 km2) in other watersheds. EBMUD also has an American River water right that could be sent to the Mokelumne Aqueduct through the Folsom South Canal. The only time this has been done was during the drought years of 1977–78, when the water was actually pumped from the Delta.[14] This generated controversy, as EBMUD preferred the cleaner water from the American River, but environmentalists and Sacramento had concerns about the impacts such a diversion would have on the river. The legal battle led to affirmation of EBMUD's water right, but modifications were also negotiated. The intake point was moved downstream, to maintain minimum flows in the American River before it merges with the Sacramento.
North Bay[]
The North Bay Aqueduct of the California State Water Project delivers an annual average of 39,309 acre⋅ft (48 million m3) of water to urban communities and agricultural users in Napa, Solano, Sonoma and Marin counties. That water is diverted from the Sacramento-San Joaquin River Delta Estuary, a water hub that serves as the junction of south-, west-, and north-flowing rivers draining the Cascade and Sierra Nevada mountain ranges.
Certain municipalities north of San Francisco Bay, including Santa Rosa and Petaluma, are served by the Sonoma County Water Agency. Their primary water source is the Russian River. However, the Russian River owes its summer flow in large part to the Eel, which is bled off via a tunnel into Potter Valley (via the Potter Valley Project) and flows to a reservoir near Ukiah, Lake Mendocino. PG&E now owns the rights to this delivery system, as well as the long controversial history. There are many[who?] along the Eel who would like their water back.
The cities of Vallejo, Fairfield, and Vacaville are served by the Solano County Water Agency, which transports water from Lake Berryessa and moves it south along the Putah South Canal. Marin County has the Marin Municipal Water District and the .
Planning and management[]
The planning and management of water in California is subject to a vast number of laws, regulations, management plans, and historic water rights. The state agency responsible for water planning is the California Department of Water Resources.
Safety concerns[]
Water purity has been an emerging issue in California, especially in communities with low-income residents. Aging infrastructure, coupled with a lack of research on the topic, has exacerbated this issue, with water health violations occurring in 7–8% of water systems a year.[58] The San Joaquin Valley, a largely rural and agricultural area with 65% residents being people of color, is registered with the most water quality violations. Tulare, a city within San Joaquin Valley, has 99% of its residents relying on compromised groundwater, contrasted with Los Angeles County, with 11% of residents relying only on a contaminated water supply.[59] These water violations often lead to purchased water sources and private ownership of water distribution, as private utilities appear to have larger bandwidth to serve a large population. Trade-offs often include greater inequity in water access, as private utilities face higher repercussions for delivering unsafe water and often decide to opt-out from serving under-resourced populations.[60] In many cases, bottled water is tested less frequently than public water for pollutants, and in 1999, approximately 33% of bottled water tested by the FDA exceeded allowable limits.[citation needed]
The U.S. Geological Survey analyzed the results of a 2002 study of 10 streams in California and discovered that the Sacramento River had the highest traces of acetaminophen, cholesterol and birth control hormones of any water source in the nation.[citation needed] Pharmaceutical discharge polluted by drug companies are relatively common in California water, with Southern California water tables especially susceptible to contamination.[61]
California water plans[]
There have been several documents known as the "California Water Plan", with the most recent being published in 2013.[62] Before the state of California started drafting comprehensive plans for the management of water in the state, the earliest plan for water distribution in California was an 1873 report. This was followed by a 1919 report called "Irrigation of Twelve Million Acres in the Valley of California". The 1919 report is the first comprehensive plan, and is often called the "Marshall Plan", after its author Col. (not to be confused with the unrelated European program from 1948 of the same name). There have been many subsequent water plans and water plan updates, which were often issued as California Department of Water Resources bulletins.[63] California Water Code provides guidance or the plan updates.[64] Beginning in 1957, early Water Plan Updates were largely technical and focused on water supply development. Plans gradually became more comprehensive to address the state's growing conflicts over limited resources. Updates now present the status and trends of California's water-dependent natural resources; water supplies; and agricultural, urban, and environmental water demands for a range of plausible future scenarios. They also evaluate different combinations of regional and statewide resource management strategies to reduce water demand, increase water supply, reduce flood risk, improve water quality, and enhance environmental and resource stewardship. The evaluations and assessments performed for the updates help identify effective actions and policies for meeting California's resource management objectives in the near term and for several decades to come.
Since 2000, another major goal for each update has been to receive broad input and support from Californians. Preparation of these new millennial Water Plan updates has been widely viewed as exceptionally transparent and collaborative as the consensus seeking process is routinely cited by other agencies and states as a model for policy planning efforts.[65] The approach involves: interest based dialog and exchange among teams, committees and the public to develop work products; multiple opportunities for review by different audiences; and integration and reconciliation of feedback from a variety of perspectives.
Update 2013 is based on the plan laid out by the administration of Governor Edmund G. Brown Jr. (Jerry Brown).[66] That five-year plan, released in January 2014, outlines a succinct set of actions that together bring reliability, restoration, and resilience to California water resources, even as the state's population is expected to grow from 38 million to 50 million by 2049.
Three related themes distinguish Update 2013 from Update 2009. The five year time span reinforced the value of integrated water management, and Update 2013 closely examines the practices and policies that allow water managers to combine flood management, environmental stewardship, and surface water and groundwater supply actions to deliver multiple benefits across a region. Fundamental to that integrated approach is better alignment in the management of data, planning, policy-making, and regulation across local, State, tribal, and federal governments.
Water rights[]
On more than one occasion, the California Supreme Court has noted that "the scope and technical complexity of issues concerning water resource management are unequalled by virtually any other type of activity presented to the courts."[67][68] An example of this complexity is demonstrated in the case of National Audubon Society v. Superior Court.
Water rights are divided in multiple ways. Water rights to surface water and underground sources are separate. Also, California recognizes four distinct types of water rights to surface water in its statutory and common law: pueblo, riparian, prior appropriation, and water reserved by the US. A fifth statutory right also provides area of origin watershed rights.[citation needed]
Pueblo water rights[]
California recognizes water rights granted to pueblos (settlements) under the Spanish and Mexican governments, prior to the Treaty of Guadalupe Hidalgo.[69][70] Under the doctrine, pueblos organized under the laws of Mexico or Spain have a water right to the yield of all streams and rivers flowing through the city and the groundwater aquifers lying below.[71] Pueblo water rights are superior to all riparian and appropriative rights and cannot be lost by a failure to assert an interest or use the water.[72] In addition, the pueblo's claim expands with the needs of the city and may be used to supply the needs of areas that are later annexed to the city.[72] Los Angeles and San Diego are the only original pueblos to exercise their pueblo water rights in the courts.
Pueblo water rights are controversial. Some modern scholars and courts argue that the pueblo water rights doctrine lacks a historical basis in Spanish or Mexican water law.[73]
Riparian water rights[]
A landowner who has their property border a river has a right to use that land. Under the riparian doctrine, "the owner of land has the right to divert the water flowing by his land for use upon his land, without regard to the extent of such use or priority in time".[74] "Riparians on a stream system are vested with a common ownership such that in times of water shortage all riparians must reduce their usage proportionately."[75]
Riparian water rights were inherited from the common law of England.[76] Under the doctrine, property owners have correlative rights to the reasonable use of the water passing through their land adjacent to the watercourse. The right is part and parcel with the land itself and, in California, only accompanies those tracts that have always directly touched the water.[77]
Riparian rights received legal recognition after California gained statehood. It then became law that owners that have property touching a water source have a right to that water and it cannot be appropriated by another party.[1]
The English focus on landownership differs sharply from the "first in time, first in right" approach 49ers, who were generally trespassing on federal land, developed to wash hills into rivers.[78] In Lux v. Haggin (1886) the California Supreme Court resolved the conflict by finding that riparian water rights are superior even to older prior appropriations. When in 1926 the Court went so far as to find that riparian owners did not need to put their water to beneficial use, the People amended the California Constitution to reverse the decision, establishing that no water in the state may be wasted.[79]
While riparian rights are superior to appropriative rights and may survive dormant and unused, in 1979 the California Supreme Court found that the California State Water Resources Control Board has the power to assign unused riparian rights lower priority than existing prior appropriations.[80]
Water rights by prior appropriation[]
"The appropriation doctrine confers upon one who actually diverts and uses water the right to do so provided that the water is used for reasonable and beneficial uses," regardless of whether that person owns land contiguous to the watercourse.[75] In addition, all appropriative rights are subordinate to riparians or earlier appropriators.[75] In times of shortage riparians are entitled to fulfill their needs before appropriators are entitled to any use of the water.[81] "And, as between appropriators, the rule of priority is 'first in time, first in right.'"[82] Beginning in 1914, a statutory scheme has provided the exclusive method of acquiring appropriation rights through the California State Water Resources Control Board.[83] The modern system of prior appropriation water rights followed by California is characterized by five principles:
- Exclusive right is given to the original appropriator, and all following rights are conditional upon precedent rights.
- All rights are conditional upon beneficial use.
- Water may be used on riparian lands or non-riparian lands (i.e. water may be used on the land next to the water source, or on land removed from the water source)
- Diversion is permitted, regardless of the shrinkage of the river or stream.
- The right may be lost through non-use.[84]
Beneficial use is defined as agricultural, industrial, or urban use. Environmental uses, such as maintaining body of water and the wildlife that use it, were not initially regarded as beneficial uses in some states but have been accepted in some areas.[85] Every water right is parameterized by an annual yield and an appropriation date. When a water right is sold, it maintains its original appropriation date.
Water reserved by the United States[]
Lands reserved by the United States government are accompanied by a corresponding reservation of water rights for as much water is needed to fulfill the purpose for which the reservation was made. Such reservations were made on behalf of Native American tribes, national parks, monuments and forests.[86][87][88] Water rights reserved by the United States are defined by and controlled by federal law. And because reserved water rights are not riparian nor appropriative, they may conflict with state law.[86]
Area of origin watershed rights[]
California provides communities and other water users within watersheds senior status over appropriative water rights in limited circumstances.[89] California area of origin laws include The County of Origin Law (1931), The Water Protection Statute (1933), and The Delta Protection Act (1959).[90]
Area of origin water rights parallel pueblo water rights. In both cases, water is reserved for future growth of the local community. In other words, appropriations may be subject to a water rights claim from people/government in the area of origin. That later claim would be senior despite its temporal disconnect. As a result of its pueblo rights, Los Angeles has rights to all or almost all water from the Los Angeles River.[which?] In the same way, communities along major water sources such as the Sacramento River theoretically have senior water rights to support growth despite a downstream user holding otherwise senior appropriative water rights.[citation needed]
Area of origin laws were passed in reaction to the controversies related to Los Angeles diverting water from the Owens Valley.[citation needed] Despite being on the books for generations, the area of origin statutes were not used until 2000. In addition, there currently are no court opinions regarding area of origin watershed rights.[citation needed][when?]
Adjudication[]
Since under the law, landowners can extract as much groundwater from their property as they can put to beneficial use, adjudication was used to determine who had the right to pump how much and to audit such usage.[91] The courts appoint water masters to audit usage and otherwise enforce water rights, who are often management boards, the United States Department of the Interior, the California Department of Water Resources, or an individual.[91][92][93]
Disputes and controversies[]

The California water wars, a struggle between Los Angeles and certain parties within the Owens Valley, for water rights is but one example of the alleged wrongdoings of municipalities and people in securing adequate water supplies. The city of Los Angeles bought 300,000 acres (1,200 km2) of land from residents of the Owens Valley and the water rights attached with them, for a fair price. The diverting of this water from the valley, transformed it from an agricultural valley into a dust bowl.[51]
The electricity produced by the hydroelectric plants drawing their water from the Hetch Hetchy reservoir became the subject of controversy when it was reported by the San Francisco Bay Guardian that the city of San Francisco sold roughly 500 megawatts of power to PG&E,[94] supposedly in violation of the Raker Act, which specifies that because the source of water and power was on public land, no private profit could be gained from such sales. Whether or not the Raker Act is indeed being violated is still a matter of controversy.[citation needed]
The creation of so many dams in California in order to enact a water diversion program for conventional agriculture has been met with criticism from most environmentalists,[which?] who have decried the negative effects of dams on ecosystems, particularly on migratory fish populations.[95]
Predicted need for increased water supplies[]
This section's factual accuracy may be compromised due to out-of-date information. (May 2013) |
It is projected that California's population will grow to almost 50 million by 2050.[96] If the prediction comes true and there is no action to increase the water supply, the difference between water demand and supply would be between 2.0–6.0 million acre-feet (2.5–7.4 km3) in the year 2020.[97] Over the past five years California voters have approved $3 billion in bonds for water development and management.[when?] Many of these projects are incorporated in the CALFED Bay-Delta program, a federal-state program designed to reduce water supply conflicts. In August 2000 the state and federal governments approved the CALFED plan for water quality, water conservation and recycling, watershed administration, ecosystem re-establishment, delta levees, surface and groundwater storage, water transportation, and science. The plan has a thirty-year implementation period and was designed to incorporate changes in conditions and knowledge about the effects of specific projects. Stage 1 was initiated in 2000 and was designed as a seven-year program. The cost is estimated to be $8.7 billion.[98] Stage 1 water yield within the next seven to ten years is estimated to be 2.9 million acre-feet (3.6 km3) per year.[97] As part of Stage 1, an Environmental Water Account was established through the purchase of 0.35 million acre-feet (0.43 km3) of water. The EWA is used to protect fish and other wildlife without reducing water allocations to farms and municipalities.
A $7.5 billion water bond was approved in November 2014 with a 2 to 1 ratio.[99] The bond-financing, which has been contentiously debated by the legislature and Governor Jerry Brown for the past few years, was said to improve the water quality, supply and infrastructure, if passed by voters.[100]
Natural disasters and California water[]


Major droughts in California history since 1900[]
- 1917–21[101]
- 1922–26[101]
- 1928–37[101]
- 1943–51[101]
- 1959–62[101]
- 1976–77[102]
- 1987–92[101]
- 2007–09[101]
- 2012–15[103][104]
Impact of Climate Change[]
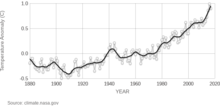
The burning of fossil fuels, which has been occurring at an unprecedented rate since the Industrial Revolution in the 1950s, has increased the concentration of greenhouse gases, particularly carbon dioxide and methane, in the atmosphere. In 2018, atmospheric carbon dioxide concentrations were 407 parts per million (ppm), and the Global Carbon Budget estimated that emissions would continue to grow by 0.6% each decade.[105] Increased concentrations of greenhouse gases in the atmosphere have caused Earth's global surface temperatures to increase as well, a phenomenon called climate change. In 2018, the Intergovernmental Panel on Climate Change (IPCC) estimated that global average temperatures were increasing by 0.2 °C each decade and that the climate that year was 1 °C above preindustrial levels.[106] The IPCC warns that anthropogenic emissions must decrease to limit climate change and its impacts; In California, the United States Environmental Protection Agency (EPA) predicts that sea level rise between 1–4 by 2100, more extreme weather conditions, and changes in precipitation due to climate change will have an impact on the state's water resources.[107] In addition, these impacts will also change the state's water management systems and policies. According to the Public Policy Institute of California, the number of people and the value of property is increasing in flood prone regions of the state, including Sacramento, which means that the economic risk and threat to public safety is increasing.[108] This reality is illustrated by the 2017 Oroville Dam failure where 180,000 were emergency evacuated and nearly $500 million in damages were accrued.
Sea Level Rise[]

Although the Earth's oceans have been rising since the last ice age around 18,000 years ago as a result of melting sea and land ice, climate change is expected to accelerate the rate of global sea level rise. According to California's Fourth Climate Change Assessment, published in 2018, climate change will stimulate 54 inches of sea level rise by 2100 if greenhouse gas emissions continued at their current rates.[109] This phenomenon is expected to cause coastal and estuarial flooding which will have both economic, environmental, and political ramifications in terms of water. In fact, scientists at the California Department of Water Resources believe that sea level rise will cause more salt water to intrude the Sacramento-San Joaquin Delta, the state's largest estuary, "the heart of the California water supply system and the source of water for 25 million Californians and millions of acres of farmland."[110] Rising sea levels will also present flood hazards from storms and saltwater intrusion to coastal aquifers, according to the department's report.
Extreme Weather Conditions[]
Climate change will also cause more extreme weather conditions to occur in the state. In general, California's climate will become dryer and warmer over time.[111] According to the United States Geological Survey, higher atmospheric surface temperatures and warmer ocean waters create fuel for more powerful storms, like hurricanes or monsoons, to develop and can lead to faster wind speeds during storms.[112] This effect will cause more frequent and extreme droughts as well as extreme precipitation events that could cause flooding according to the National Climate Assessment.[113] In fact, these effects are already evident in the state. For instance, the drought of 2012–2016 was the most extreme drought that the state has ever seen, and droughts were the most common disaster source in California in 2016 according to the State of California Hazard Mitigation Plan.[114] In addition, monitoring by the California Department of Water Resources suggests that droughts have become more severe since the Industrial Revolution. In fact, the drought of 2012 to 2016 was the most extreme drought that the state has ever seen.[114] At the same time, floods have also been worsening over time and will continue to become more extreme as atmospheric temperatures continue to increase.
Changes in Precipitation[]
Although California has always had extreme daily, monthly, and annual variations in rainfall, the state's precipitation patterns have become increasingly variable over time, trending towards a drier climate as a result of global warming.[111] Among all of the effects of climate change, changes in precipitation will be the hardest to predict. However, studies conducted by the California Natural Resources Agency suggest that there will be more dry days and years in the future with occasional downpours.[111] More specifically, they estimate that the southern and inland regions of the state that are already dry to become more arid over time while the northern part of the state that currently receives a majority of the state's rainfall will continue to get wetter with the onset of climate change. In addition, the increase in atmospheric temperatures will also lessen the amount of precipitation that falls as snow.[109] A 2017 UCLA study found that "anthropogenic warming reduced average snowpack levels by 25%, with mid-to-low elevations experiencing reductions between 26-43%."[115] The implication of this precipitation pattern change is that immediate runoff will increase making the winter months a lot wetter, and that there will be a longer, warmer dry season in the spring and summer months. By the end of the century, the California Department of Water Resources predicts that the Sierra Nevada snowpack, the state's primary freshwater source,[116] will decrease by 48-65% from its April 1 average.[110]
Socio-Economic & Political Implications[]

Climate change impacts related to water, including sea level rise, more extreme weather conditions, and changes in precipitation, will have various effects in California. The state's water infrastructure, including dams, levees, and canals, are out of date, and they are particularly ill-suited in light of climate change.[109] For instance, decreased snowpack and increased immediate rain runoff will increase the risk of infrastructure failure and flooding in the state. In fact, the state's water management systems are already failing as a result of changing precipitation as was the case in the 2017 Oroville Dam crisis.[110] At the same time that climate change will increase flooding, it will also cause more frequent and extreme droughts as the state's climate continues to become drier over time. By utilizing the Palmer Drought Severity Index, the National Oceanic and Atmospheric Administration (NOAA) found that droughts in the state will become more severe in the next 40 years with the onset of climate change.[117] This means that there will be less water for the state to distribute. California's Fourth Climate Change Assessment found that water storage in the state's two largest reservoirs, Shasta and Oroville, will decrease by one third under current management systems.[109] This decreased water storage combined with less spring and summer runoff conflicts with the state's water demand. To date, most of California's precipitation falls as snow in the winter months, and it flows into rivers and streams in the spring and summer months as the snow melts. This is an important aspect of California's water management systems because most of the state's water demand occurs in the late summer months during the agricultural growing season. As temperatures continue to increase this effect will diminish, and the state will have to find a way to store water from the winter months to the summer months when it is most needed.
Archives relating to California water[]
The California Water Documents collection in the Claremont Colleges Digital Library is a valuable online resource of archived materials related to California's water history. Additionally, the collection has digitized materials relating to the creation and operation of both the Central Valley Project and the California State Water Project as well as their component units.[118] The items represented in the Claremont Colleges Digital Library are part of a larger collection entitled the Water Resources Collection in Special Collections at Claremont Colleges' Honnold/Mudd Library. The Water Resources Collection was started in the 1930s by Librarian Willis Holmes Kerr and Librarian and Claremont Colleges' Trustee John Treanor.[119] These librarians' interest in California's water problem led them to start collecting a variety of documents related to water history and usage from around the state. It includes reports of engineers, annual reports and minute books of boards of directors of water companies, documents of federal and state governments, promotional pamphlets, and newspaper clippings.[119] Most of the documents focus on the water history from the first half of the 20th century, but there are additional, more recent publications included, which have been donated by Claremont Graduate University Professor Merrill Goodall.[119] The California Water Documents collection is currently a work in progress at the Claremont Colleges Digital Library.
The Water Resources Collections and Archives is located at the University of California, Riverside and features a comprehensive collection of water-resource related documents.
See also[]
- California Water Fix and Eco Restore plan
- Groundwater-related subsidence
- List of lakes in California
- List of largest reservoirs of California
- Newlands Reclamation Act, a 1902 federal law that funded irrigation projects for 20 western states
- Sustainable Groundwater Management Act
- Water-energy nexus
- Northern Cyprus Water Supply Project
References[]
- ^ Jump up to: a b "Riparian Rights". Water Education Foundation. Retrieved 2018-05-10.
- ^ Hundley, N. (2001). The great thirst: Californians and water. Berkeley, California: University of California Press.
- ^ Jenkins, Marion W.; Lund, Jay R.; Howitt, Richard E.; Draper, Andrew J.; Msangi, Siwa M.; Tanaka, Stacy K.; Ritzema, Randall S.; Marques, Guilherme F. (2004). "Optimization of California's Water Supply System: Results and Insights". Journal of Water Resources Planning and Management. 130 (4): 271–280. doi:10.1061/(ASCE)0733-9496(2004)130:4(271). S2CID 154598961.
- ^ Jump up to: a b c d Carle (2004), p. 60.
- ^ City of Pasadena v. City of Alhambra, 33 Cal.2d 908 (Cal. 1949).
- ^ Alley, William M.; Healy, Richard W.; LaBaugh, James W.; Reilly, Thomas E. (2002). "Flow and Storage in Groundwater Systems". Science. 296 (5575): 1985–90. Bibcode:2002Sci...296.1985A. doi:10.1126/science.1067123. PMID 12065826. S2CID 39943677.
- ^ Moores, Eldridge M. (1999). Classic Cordilleran Concepts: A View from California. Geological Society of America.
- ^ "NASA's GRACE Sees a Drying California". Photojournal.jpl.nasa.gov. NASA. June 2014. Retrieved October 4, 2014.
- ^ Kenneth W. Umbach (August 1997). "A Statistical Tour of California's Great Central Valley". Archived from the original on 2017-04-04.
- ^ Jump up to: a b "California State Water Project–Sacramento San Joaquin Delta". Water.ca.gov. Retrieved 14 October 2017.
- ^ "California's Three Traditionally Wettest Months End With Statewide Snowpack Water Content Less than Average" (PDF). Water.ca.gov. Retrieved 17 October 2017.
- ^ "Instream Flow Program". California Department of Fish and Wildlife. State of California. Retrieved 31 December 2019.
- ^ "California". Crwua.org. Retrieved 14 October 2017.
- ^ Jump up to: a b c Carle (2004).
- ^ "Monthly Data by Water Year". California Data Exchange Center. California Department of Water Resources. Retrieved 9 November 2014.
- ^ Cooley, Heather; Gleick, Peter; Hartman Wolff, Gary (2006). Desalination, with a grain of salt a California perspective. Oakland, Ca: Pacific Institute for Studies in Development, Environment, and Security. pp. 39–68. ISBN 1-893790-13-4.
- ^ "Carlsbad Desal Plant". Poseidon Water. Retrieved 2017-07-30.
- ^ "Seawater Desalination". Sdcwa.org. Retrieved 2017-07-30.
- ^ "Desalination Expands, but Energy Challenges Remain". www.powermag.com. March 2016. Retrieved 2019-05-01.
- ^ "Existing and Proposed Seawater Desalination Plants in California – Pacific Institute". Pacific Institute. Retrieved 2017-07-30.
- ^ "Suggestions for sustainable sanitation". issuu. Retrieved 2017-04-08.
- ^ Jeffrey Mount; Emma Freeman; Jay Lund. "Water Use in California". PPIC. Retrieved 21 October 2014.
- ^ Jump up to: a b "Water – Who uses how much?". Californiawaterblog.com. 5 May 2011. Retrieved 17 October 2017.
- ^ "Sacramento-San Joaquin Delta and Salinity". Water Education Foundation. Retrieved 6 December 2015.
- ^ Heather Hacking (December 2015). "Releases from Lake Oroville increased to keep salt water out of the delta". Chico Enterprise-Record. Retrieved 6 December 2015.
- ^ Association of California Water Agencies. General Facts About California's Water
- ^ "U.S. Geological Survey" (PDF). Pubs.usgs.gov. Retrieved 16 October 2017.
- ^ Jump up to: a b c "Volume 5 – Technical". California Water Plan. State of California. 2013. Archived from the original on 2015-04-18. Retrieved 14 October 2017.
- ^ Jump up to: a b David Pierson (8 June 2014). "U.S. farmers making hay with alfalfa exports to China". Los Angeles Times.
- ^ Weiser, Matt (8 March 2016). "Saudi Arabia moves farming venture to drought-stricken California". Newspaper. The Guardian. Retrieved 9 March 2016.
- ^ "California Rice at a Glance" (PDF). Calrice.org. Retrieved 14 October 2017.
- ^ Rice Production in the United States
- ^ Mekonnen, M. M.; Hoekstra, A. Y. (2011). "The green, blue and grey water footprint of crops and derived crop products". Hydrology and Earth System Sciences. 15 (5): 1577–1600. Bibcode:2011HESS...15.1577M. doi:10.5194/hess-15-1577-2011.
- ^ Buchanan, Larry; Keller, Josh; Park, Haeyoun (21 May 2015). "Your Contribution to the California Drought". New York Times. Retrieved 16 September 2015.
- ^ Mike Madison (24 August 2011). "Horses among us". Los Angeles Times.
- ^ "USGS: Livestock Water Use in the United States". water.usgs.gov. Retrieved 2018-03-04.
- ^ "California Single Family Water Use Efficiency Study" (PDF). Irwd.com. Retrieved 16 October 2017.
- ^ "How Much Water Do Californians Use and What Does A 20 Percent Cut Look Like?". KQED News. 28 January 2014. Retrieved 9 February 2015.
- ^ "Outdoor Water Conservation". Green Cities California. Archived from the original on 2015-04-05.
- ^ Jump up to: a b Rogers, Paul s & Nicholas St. Fleur (7 February 2014). "California Drought: Database Shows Big Difference between Water Guzzlers and Sippers". San Jose Mercury News.
- ^ Buck, Steven; Nemati, Mehdi; Sunding, David (2016). "The Welfare Consequences of the 2015 California Drought Mandate: Evidence from New Results on Monthly Water Demand" (PDF). Retrieved 1 July 2016. Cite journal requires
|journal=(help) - ^ "California State Water Project Overview". Department of Water Resources. Retrieved November 2, 2014.
- ^ Carle (2004), p. 92.
- ^ Oroville Dam. Archived 2010-06-20 at the Wayback Machine Department of Civil & Environmental Engineering, University of California, Davis, CA
- ^ Dickinson, Ann (June 5, 2008). "Where Water Runs Uphill". Quest Community Science Blog. KQED.
- ^ About Our Valley. California, Central Valley, and San Joaquin Valley Agriculture.
- ^ Bureau of Reclamation. Central Valley Project: General Overview.
- ^ "Leaky Water Law". Los Angeles Times. 1987-04-15. ISSN 0458-3035. Retrieved 2017-10-17.
- ^ Stene, Eric A. "The Central Valley Project". Bureau of Reclamation: Reclamation Project Histories.
- ^ Metropolitan Water District of Southern California. California's Colorado River Allocation. Archived 2015-03-05 at the Wayback Machine
- ^ Jump up to: a b Reisner, Marc (1993). Cadillac Desert: The American West and its Disappearing Water. Penguin. ISBN 0140178244.
- ^ Carle (2004), pp. 113–114.
- ^ "The L.A. Aqueduct at 100". graphics.latimes.com. Retrieved 2017-10-17.
- ^ "State Decision Offers Good News for Mono Lake". Monolake.org. Retrieved 14 October 2017.
- ^ "Ultra-Low Flush Toilet Distribution Program". Monolake.org. Retrieved 14 October 2017.
- ^ "Hetch Hetchy Water and Power : Financial Statements 2013/14". Stwater.org. Retrieved 17 October 2017.
- ^ Null, Sarah E. (2003). Re-Assembling Hetch Hetchy: Water Supply Implications for Removing O'Shaughnessy Dam (M.A. thesis). Davis: University of California.
- ^ "Flint's Water Is a Tiny Part of America's Huge Drinking Problem, Says Study". Inverse. Retrieved 2018-03-13.
- ^ "Systemic Failure: Why 1 Million Californians Lack Safe Drinking Water". Water. Retrieved 2018-03-06.
- ^ "'Hot spots' of water quality violations: Problems more frequent in low-income, rural areas of the nation". ScienceDaily. Retrieved 2018-03-13.
- ^ Fram, Miranda S.; Belitz, Kenneth (August 2011). "Occurrence and concentrations of pharmaceutical compounds in groundwater used for public drinking-water supply in California". Science of the Total Environment. 409 (18): 3409–3417. Bibcode:2011ScTEn.409.3409F. doi:10.1016/j.scitotenv.2011.05.053. ISSN 0048-9697. PMID 21684580.
- ^ "California Water Plan Update 2013". California Department of Water Resources. Retrieved Oct 30, 2014.
- ^ "California Water Plan". UC Davis Library. Retrieved Oct 25, 2013.
- ^ "List of Legislative Requirements". Waterplan.water.ca.gov. Retrieved 19 September 2014.
- ^ "List of US State Water Plans". Circleofblue.org. Retrieved 13 February 2014.
- ^ "Water Action Plan". Waterplan.water.ca.gov. Retrieved 22 January 2014.
- ^ Environmental Defense Fund v. East Bay Municipal Utility Dist. 26 Cal.3d 183, 605 P.2d 1
- ^ National Audubon Society v. Superior Court 33 Cal.3d 419, 189 Cal.Rptr. 346; 658 P.2d 709 (1983)
- ^ City of Los Angeles v. Pomeroy, 124 Cal. 597, 640–41 (1899)
- ^ Hooker v. City of Los Angeles, 188 U.S. 314, 319–20 (1903)
- ^ City of Los Angeles v. City of San Fernando, 14 Cal.3d 199 (1978)
- ^ Jump up to: a b San Diego v. Cuyamaca Water Co, 209 Cal. 105 (1930).
- ^ Text of State of New Mexico, ex rel. Eluid L. Martinez, State Engineer, Plaintiff–Respondent, v. City of Las Vegas, Defendant–Petitioner. No. 22,283 is available from: Findlaw
- ^ United States v. State Water Res. Control Bd., 182 Cal.App.3d 82 (1986) (citing Miller & Lux v. Enterprise Canal & Land Co., 169 Cal. 415 (1915)).
- ^ Jump up to: a b c United States v. State Water Res. Control Bd., 182 Cal.App.3d 82 (1986)
- ^ Chief Justice Lucien Shaw, Development of the Law of Waters in the West, 10 Cal. L. Rev. 443 (1922).
- ^ "Brian Gray, A primer on California Water Transfer Law, 31 Ariz. L. Rev. 745 (1989)" (PDF).
- ^ Clay, Karen, and Gavin Wright. Order without law? Property rights during the California gold rush. Explorations in Economic History 42 (2005): 155–183. See also Jennison v. Kirk, 98 U.S. 453 (1878).
- ^ "Brian Gray, In Search of Bigfoot: The Common Law Origins of Article X, Section 2 of the California Constitution, 17 Hastings Const. L.Q. 225 (1989)" (PDF).
- ^ Eric Freyfogle, Context and Accommodation in Modern Property Law, 41 Stan. L. Rev. 1529 (1989), discussing In re Waters of Long Valley Creek Stream System, 25 Cal.3d 339, (1979) | California Supreme Court Resources In re Waters of Long Valley Creek Stream System, 25 Ca.3d 339 (1979)].
- ^ United States v. State Water Res. Control Bd., 182 Cal.App.3d 82 (1986) (citing Meridian, Ltd. v. San Francisco 13 Cal.2d 424, 445–447 (1939)).
- ^ United States v. State Water Res. Control Bd., 182 Cal.App.3d 82 (1986) (citing Irwin v. Phillips, 5 Cal. 140, 147 (1855)).
- ^ United States v. State Water Res. Control Bd., 182 Cal.App.3d 82 (1986) (citing People v. Shirokow, 26 Cal.3d 301, 308 (1980))
- ^ Gopalakrishnan, Chennat (1973). "The Doctrine of Prior Appropriation and Its Impact on Water Development: A Critical Survey". American Journal of Economics and Sociology. 32 (1). pp. 61–72.
- ^ "Archived copy". Archived from the original on 2007-07-15. Retrieved 2008-12-16.CS1 maint: archived copy as title (link)
- ^ Jump up to: a b Cappaert v. United States, 426 U.S. 128 (1976)
- ^ Winters v. United States, 207 U.S. 564 (1908)
- ^ Arizona v. California, 373 U.S. 546 (1963)
- ^ California Water Code 10505 (provides a general area of origin right); California Water Code 10505.5 (inserts general area of origin right into all appropriative water rights); California Water Code 11460-63 (provides area of origin protection from the Central Valley Project and State Water Project)
- ^ Wilson, Craig. "California's Area of Origin Laws" (PDF). Retrieved 24 February 2016.
- ^ Jump up to: a b Green 2007, pp. 23–24.
- ^ Green 2007, pp. 83–84.
- ^ Green 2007, p. 56.
- ^ Byrne, Peter. "Delusions of Power". SF Weekly. Retrieved 16 October 2017.
- ^ "California Salmon Could Be Harmed By More Dams". Science Daily. September 27, 2007. Retrieved November 2, 2014.
- ^ "California's Housing Future: Challenges and Opportunities. Public Draft – Statewide Housing Assessment 2025" (PDF). January 2017. Retrieved 16 October 2017.
- ^ Jump up to: a b Chung, Francis; Kelly, Katherine; Guivetchi, Kamyar (2002). "Averting a California Water Crisis". Journal of Water Resources Planning and Management. 128 (4): 237–239. doi:10.1061/(ASCE)0733-9496(2002)128:4(237).
- ^ "Archived copy" (PDF). Archived from the original (PDF) on 2008-11-13. Retrieved 2008-12-16.CS1 maint: archived copy as title (link)
- ^ "California Proposition 1, Water Bond (2014)". Ballotpedia.org. Retrieved 14 October 2017.
- ^ Respaut, Robin (10 September 2014). "Californian voters support water bond two-to-one, poll finds". Reuters. Retrieved 14 September 2014.
- ^ Jump up to: a b c d e f g Walker, Richard; Lodha, Suresh (2013). "Chapter 5: Water & Energy". The Atlas of California. University of California Press. pp. 68–70. ISBN 978-0-520-27202-6.
- ^ Proceedings Governor's Drought Conference. 1977.
- ^ "Drought background". California Department of Water Resources. Retrieved October 26, 2014.
- ^ "Major Floods and Droughts in California". USGS.
- ^ Friedlingstein, Pierre; Jones, Matthew; O'Sullivan, Michael; Andrew, Robbie (October 28, 2019). "Global Carbon Budget 2019". Earth System Science Data. 11 (4): 1783–1838. Bibcode:2019ESSD...11.1783F. doi:10.5194/essd-11-1783-2019.
- ^ Summary for Policy Makers. In: Global Warming of 1.5°C. An IPCC Special Report on the impacts of global warming of 1.5°C above preindustrial levels and related global greenhouse gas emissions pathways, in the context of strengthening the global response to the threat of climate change, sustainable development, and efforts to eradicate poverty. IPCC. 2018. pp. 1–24.
- ^ "What Climate Change Means for California" (PDF). United States Environmental Protection Agency. August 2016. Retrieved April 13, 2020.
- ^ "Floods in California". Public Policy Institute of California. Retrieved May 2, 2020.
- ^ Jump up to: a b c d California's Fourth Climate Change Assessment: California's Changing Climate 2018 (PDF). State of California, California Energy Commission, California Natural Resources Agency. 2018. pp. 1–19.
- ^ Jump up to: a b c "Climate Change and Water". California Department of Water Resources. Retrieved April 17, 2020.
- ^ Jump up to: a b c Climate Change – The Challenge (PDF). California Natural Resources Agency. 2017. pp. 12–24.
- ^ "Climate and Land Use Changes". United States Geological Survey. Retrieved April 28, 2020.
- ^ Garfin, Gregg (2013). Assessment of Climate Change in the Southwest United States. Island Press. pp. 1–462. ISBN 9781610914468.
- ^ Jump up to: a b State of California Hazard Mitigation Plan (PDF). California Governor's Office of Emergency Services. 2018. pp. 1–1088.
- ^ Berg, Neil (2017). Anthropogenic Warming Impacts on California Snowpack During Drought (PDF). University of California, Los Angeles. pp. 1–23.
- ^ Indicators of Climate Change in California: Report Summary (PDF). Office of Environmental Health Hazard Assessment. 2018. pp. 1–15.
- ^ "Climate at a Glance: Statewide Time Series". NOAA National Centers for Environmental Information. April 2020. Retrieved April 18, 2020.
- ^ "Archived copy". Archived from the original on 2011-07-16. Retrieved 2019-05-05.CS1 maint: archived copy as title (link)
- ^ Jump up to: a b c Colleges, Special Collections at the Libraries of The Claremont. "Water Resources Collection – Special Collections at the Libraries of The Claremont Colleges". Libraries.claremont.edu. Retrieved 17 October 2017.
Bibliography[]
- Carle, David (2004). Introduction to Water in California. Berkeley: University of California Press.
- Green, Dorothy (2007). Managing Water: Avoiding Crisis in California. University of California Press. ISBN 978-0-520-25326-1. OCLC 85692856.
- Reisner, David (1993). Cadillac Desert. Penguin. ISBN 0-14-017824-4.
- Warner, Richard E.; Hendrix, Kathleen M. (1984). California Riparian Systems: Ecology, Conservation, and Productive Management. University of California Press. p. 1035. ISBN 9780520050358.
External links[]
- California State Department of Water Resources
- /California State Department of Water Resources|
- United States Geological Survey, California Water Science Center
- California's Water Infrastructure Systems
- [1]
- California Water Documents in Claremont Colleges Digital Library
- Water Resources Collection in Special Collections at Claremont Colleges' Honnold/Mudd Library
- Water Resources Collections and Archives in the University of California, Riverside Libraries
- List of water research centers (archived 2016) at the UCs and CSUs
- California State University, San Bernardino, Water Resources Institute
- University of California, California Institute for Water Resources
- Clifton Ewing Hickok Papers. Yale Collection of Western Americana, Beinecke Rare Book and Manuscript Library.
- Water in California