Water quality in Taranaki
Water quality in Taranaki is a notable environmental issue for many stakeholders with concerns about the potential impact from dairy farming in New Zealand and petrochemical industries.[1]
Water resources in Taranaki are under the jurisdiction of the Taranaki Regional Council (TRC) under the Resource Management Act (RMA), and discharges to water require a resource consent. The TRC monitors waterway quality and publishes update reports.[2]
Nationally, deterioration in freshwater quality has been associated with increases in dairy cattle numbers and in use of nitrogen fertiliser.[3] TRC advise that dairying had not increased in Taranaki since 2000 and water quality is good and getting better.[4] In 2015, the dairy cow population was 493,361, a 2.5% increase on 1998/99, with density of 2.85 cows per hectare (2.8 in 1998/99).[5]
A review by Fish & Game and Forest & Bird found that many measures intended to control pollutants from dairying had not been implemented.[6] In Taranaki, there are 1400 dairy sheds where the dairy effluent drains into streams instead of being sprayed to land, according to data from Taranaki Regional Council's 2012 State of the Environment report.[7] In 2012, the president of the New Zealand Freshwater Sciences Society expressed surprise at the number of consented dairy discharges to streams, given most other regional councils prosecute dairy farmers who allow dairy effluent to enter waterways.[8]
In 2019, Taranaki Regional Council reported that freshwater quality had deteriorated further, with only two of the fifteen sites tested meeting the standards for swimmability.[9]
Instances of high levels of E.coli have been reported during summer periods.[10][11] [12]
Water quality measurements[]
The following table shows average of measurements over the period 2005 to 2014.[13]
| Parameter | Taranaki | New Zealand | Comment |
|---|---|---|---|
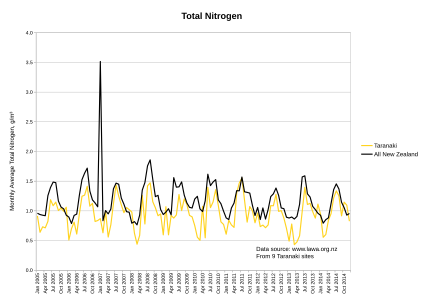
| Total nitrogen, g/m³ | 0.95 | 1.17 | All organic and inorganic forms of nitrogen. Nitrogen can cause algal blooms. |
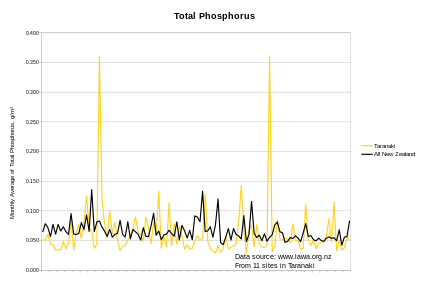
| Phosphorus, g/m³ | 0.062 | 0.065 | All forms of phosphorus, dissolved and particulate, organic and inorganic. Can come from waste water or agricultural run-off and can cause eutrophication. |
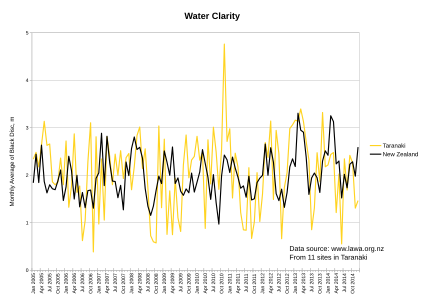
| Sediment, m | 2.06 | 2.02 | Black disc parameter measures water clarity. A larger number means the water has greater clarity. |
| E.coli, CFU/100ml | 897 | 1,125 | Escherichia coli is a common type of bacteria. High concentrations (>550) indicate faecal contamination which can be harmful to humans. |
| Sites | 11 | 838 | Count of the number of water monitoring sites. |
| Monitoring density, km²/site | 659 | 320 | Taranaki has relatively few monitoring sites on a per km² basis. |
Graphs, 2005–2014[]

Graph of Taranaki water clarity, 2005–2014

Graph of Taranaki E.coli measurements, 2005–2014

Graph of Taranaki water nitrogen measurements, 2005–2014

Graph of Taranaki water phosphorus measurements, 2005–2014
See also[]
References[]
- ^ Hutching, Gerard (11 February 2016). "Environment ministry CEO Vicky Robertson tests the waters". Taranaki Daily News.
- ^ "Healthy report for region's rivers". Taranaki Regional Council. September 2014.
- ^ Environment Aotearoa 2015. Ministry for the Environment, Statistics New Zealand. October 2015. ISBN 978-0-478-41298-7.
- ^ Keith, Keighton (27 October 2015). "Taranaki bucking the national trend in worsening water quality: Regional Council". Taranaki Daily News.
- ^ State of the Environment Report 2015. Taranaki Regional Council. June 2015. ISBN 978-0-473-32921-1.
- ^ Deans, Neil; Hackwell, Kevin (October 2008). "Dairying and Declining Water Quality" (PDF). Forest and Bird.
- ^ Stewart, Rachel (10 December 2012). "Woe betide those who question our water quality". Taranaki Daily News. Retrieved 11 December 2012.
Taranaki has 1400 cow sheds discharging effluent into streams.
- ^ Harvey, Helen (11 December 2012). "Taranaki Farmers' Effluent Policy Surprises Scientist". Taranaki Daily News. Retrieved 11 December 2012.
The New Zealand Freshwater Sciences Society president Waikato University Professor David Hamilton said many other regional councils prosecute anyone who discharges into waterways.
- ^ Martin, Robin (11 June 2019). "Taranaki freshwater flunks latest report card". RNZ.
- ^ Freshwater contact recreational water quality at Taranaki sites (PDF). State of the Environment Monitoring Report 2014-2015 Technical Report 2015-01. Taranaki Regional Council. June 2015.
- ^ Shaskey, Tara (2 January 2016). "High levels of E coli found at Waiwhakaiho River and Te Henui Stream". Taranaki Daily News.
- ^ Harvey, Helen (13 February 2016). "Swimmers are advised to avoid the Timaru Stream near Oakura". Taranaki Daily News.
- ^ a b "Raw data". Land and Water Forum. Retrieved 2 March 2016.
- Water pollution in New Zealand
- Taranaki
- Dairy farming in New Zealand


