1928 United States presidential election in Michigan
| ||||||||||||||||||||||||||
All 15 Michigan votes to the Electoral College | ||||||||||||||||||||||||||
|---|---|---|---|---|---|---|---|---|---|---|---|---|---|---|---|---|---|---|---|---|---|---|---|---|---|---|
| ||||||||||||||||||||||||||
 County Results
Hoover 40-50% 50-60% 60-70% 70-80% 80-90%
| ||||||||||||||||||||||||||
| ||||||||||||||||||||||||||

| Elections in Michigan |
|---|
 |
|
|
|
|
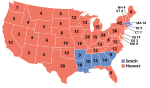
The 1928 United States presidential election in Michigan took place on November 6, 1928, as part of the 1928 United States presidential election. Voters chose 15[1] representatives, or electors, to the Electoral College, who voted for president and vice president.
Michigan voted for Republican nominees Herbert Hoover of California and his running mate Charles Curtis in a landslide. The ticket received slightly over 70% of the popular vote compared to Democrats Al Smith of New York and Joseph T. Robinson's 28.92%.[2][3]
With 70.36% of the popular vote, Michigan would prove to be Hoover's second strongest victory in the nation after Kansas.[4]
As of the 2020 presidential election, this remains the last time a Republican presidential candidate carried Wayne County, home of Michigan's most populated city, Detroit.[5][6]
Results[]
| Party | Candidate | Votes | % | |
|---|---|---|---|---|
| Republican | Herbert Hoover | 965,396 | 70.36% | |
| Democratic | Al Smith | 396,762 | 28.92% | |
| Socialist | Norman Thomas | 3,516 | 0.26% | |
| Workers | William Z. Foster | 2,881 | 0.21% | |
| Prohibition | William F. Varney | 2,728 | 0.20% | |
| Socialist Labor | Verne L. Reynolds | 799 | 0.06% | |
| Total votes | 1,372,082 | 100% | ||
Results by county[]
| County | Herbert Hoover Republican |
Alfred E. Smith Democratic |
Norman Thomas Socialist |
William Foster Workers |
William Varney Prohibition |
Verne Reynolds Socialist Labor |
Margin | Total votes cast[7] | |||||||
|---|---|---|---|---|---|---|---|---|---|---|---|---|---|---|---|
| # | % | # | % | # | % | # | % | # | % | # | % | # | % | ||
| Alcona | 1,149 | 78.81% | 302 | 20.71% | 2 | 0.14% | 4 | 0.27% | 1 | 0.07% | 0 | 0.00% | 847 | 58.09% | 1,458 |
| Alger | 1,716 | 59.05% | 1,053 | 36.24% | 24 | 0.83% | 105 | 3.61% | 4 | 0.14% | 4 | 0.14% | 663 | 22.81% | 2,906 |
| Allegan | 10,792 | 81.65% | 2,358 | 17.84% | 19 | 0.14% | 4 | 0.03% | 40 | 0.30% | 4 | 0.03% | 8,434 | 63.81% | 13,217 |
| Alpena | 3,467 | 63.43% | 1,984 | 36.30% | 7 | 0.13% | 1 | 0.02% | 6 | 0.11% | 1 | 0.02% | 1,483 | 27.13% | 5,466 |
| Antrim | 2,756 | 84.46% | 484 | 14.83% | 10 | 0.31% | 2 | 0.06% | 11 | 0.34% | 0 | 0.00% | 2,272 | 69.63% | 3,263 |
| Arenac | 1,612 | 67.87% | 749 | 31.54% | 8 | 0.34% | 2 | 0.08% | 3 | 0.13% | 1 | 0.04% | 863 | 36.34% | 2,375 |
| Baraga | 2,203 | 65.27% | 1,046 | 30.99% | 3 | 0.09% | 119 | 3.53% | 4 | 0.12% | 0 | 0.00% | 1,157 | 34.28% | 3,375 |
| Barry | 6,044 | 79.94% | 1,459 | 19.30% | 14 | 0.19% | 2 | 0.03% | 42 | 0.56% | 0 | 0.00% | 4,585 | 60.64% | 7,561 |
| Bay | 12,467 | 56.88% | 9,395 | 42.87% | 19 | 0.09% | 5 | 0.02% | 26 | 0.12% | 5 | 0.02% | 3,072 | 14.02% | 21,917 |
| Benzie | 1,849 | 84.28% | 321 | 14.63% | 16 | 0.73% | 3 | 0.14% | 5 | 0.23% | 0 | 0.00% | 1,528 | 69.64% | 2,194 |
| Berrien | 19,064 | 68.60% | 8,555 | 30.78% | 68 | 0.24% | 20 | 0.07% | 77 | 0.28% | 7 | 0.03% | 10,509 | 37.81% | 27,791 |
| Branch | 6,818 | 74.51% | 2,266 | 24.77% | 19 | 0.21% | 1 | 0.01% | 44 | 0.48% | 2 | 0.02% | 4,552 | 49.75% | 9,150 |
| Calhoun | 24,379 | 80.40% | 5,769 | 19.03% | 69 | 0.23% | 14 | 0.05% | 72 | 0.24% | 18 | 0.06% | 18,610 | 61.38% | 30,321 |
| Cass | 5,720 | 70.24% | 2,346 | 28.81% | 34 | 0.42% | 4 | 0.05% | 33 | 0.41% | 6 | 0.07% | 3,374 | 41.43% | 8,143 |
| Charlevoix | 3,489 | 79.97% | 842 | 19.30% | 25 | 0.57% | 1 | 0.02% | 5 | 0.11% | 1 | 0.02% | 2,647 | 60.67% | 4,363 |
| Cheboygan | 2,743 | 60.34% | 1,784 | 39.24% | 5 | 0.11% | 2 | 0.04% | 11 | 0.24% | 1 | 0.02% | 959 | 21.10% | 4,546 |
| Chippewa | 5,326 | 68.68% | 2,355 | 30.37% | 8 | 0.10% | 54 | 0.70% | 9 | 0.12% | 3 | 0.04% | 2,971 | 38.31% | 7,755 |
| Clare | 1,920 | 82.62% | 381 | 16.39% | 9 | 0.39% | 3 | 0.13% | 7 | 0.30% | 4 | 0.17% | 1,539 | 66.22% | 2,324 |
| Clinton | 6,161 | 75.04% | 2,013 | 24.52% | 8 | 0.10% | 26 | 0.32% | 2 | 0.02% | 0 | 0.00% | 4,148 | 50.52% | 8,210 |
| Crawford | 776 | 76.30% | 237 | 23.30% | 2 | 0.20% | 2 | 0.20% | 0 | 0.00% | 0 | 0.00% | 539 | 53.00% | 1,017 |
| Delta | 5,420 | 49.59% | 5,419 | 49.58% | 44 | 0.40% | 16 | 0.15% | 22 | 0.20% | 9 | 0.08% | 1 | 0.01% | 10,930 |
| Dickinson | 5,840 | 55.57% | 4,626 | 44.02% | 26 | 0.25% | 6 | 0.06% | 6 | 0.06% | 5 | 0.05% | 1,214 | 11.55% | 10,509 |
| Eaton | 8,493 | 78.38% | 2,285 | 21.09% | 20 | 0.18% | 1 | 0.01% | 36 | 0.33% | 1 | 0.01% | 6,208 | 57.29% | 10,836 |
| Emmet | 3,679 | 75.36% | 1,166 | 23.88% | 21 | 0.43% | 1 | 0.02% | 12 | 0.25% | 3 | 0.06% | 2,513 | 51.47% | 4,882 |
| Genesee | 42,743 | 79.37% | 10,910 | 20.26% | 83 | 0.15% | 22 | 0.04% | 71 | 0.13% | 24 | 0.04% | 31,833 | 59.11% | 53,853 |
| Gladwin | 1,795 | 83.76% | 341 | 15.91% | 3 | 0.14% | 4 | 0.19% | 0 | 0.00% | 0 | 0.00% | 1,454 | 67.85% | 2,143 |
| Gogebic | 6,061 | 64.74% | 3,134 | 33.48% | 24 | 0.26% | 118 | 1.26% | 18 | 0.19% | 7 | 0.07% | 2,927 | 31.26% | 9,362 |
| Grand Traverse | 4,429 | 74.56% | 1,489 | 25.07% | 5 | 0.08% | 1 | 0.02% | 16 | 0.27% | 0 | 0.00% | 2,940 | 49.49% | 5,940 |
| Gratiot | 8,823 | 82.14% | 1,854 | 17.26% | 18 | 0.17% | 46 | 0.43% | 0 | 0.00% | 0 | 0.00% | 6,969 | 64.88% | 10,741 |
| Hillsdale | 8,282 | 80.99% | 1,893 | 18.51% | 5 | 0.05% | 2 | 0.02% | 43 | 0.42% | 1 | 0.01% | 6,389 | 62.48% | 10,226 |
| Houghton | 11,240 | 62.30% | 6,573 | 36.43% | 20 | 0.11% | 171 | 0.95% | 25 | 0.14% | 13 | 0.07% | 4,667 | 25.87% | 18,042 |
| Huron | 7,046 | 64.79% | 3,797 | 34.91% | 4 | 0.04% | 1 | 0.01% | 26 | 0.24% | 1 | 0.01% | 3,249 | 29.88% | 10,875 |
| Ingham | 29,383 | 78.90% | 7,654 | 20.55% | 85 | 0.23% | 16 | 0.04% | 93 | 0.25% | 12 | 0.03% | 21,729 | 58.34% | 37,243 |
| Ionia | 9,471 | 74.91% | 3,089 | 24.43% | 22 | 0.17% | 2 | 0.02% | 57 | 0.45% | 2 | 0.02% | 6,382 | 50.48% | 12,643 |
| Iosco | 1,873 | 76.79% | 552 | 22.63% | 4 | 0.16% | 3 | 0.12% | 7 | 0.29% | 0 | 0.00% | 1,321 | 54.16% | 2,439 |
| Iron | 4,103 | 63.96% | 2,262 | 35.26% | 4 | 0.06% | 32 | 0.50% | 8 | 0.12% | 6 | 0.09% | 1,841 | 28.70% | 6,415 |
| Isabella | 4,926 | 73.13% | 1,762 | 26.16% | 13 | 0.19% | 1 | 0.01% | 34 | 0.50% | 0 | 0.00% | 3,164 | 46.97% | 6,736 |
| Jackson | 25,080 | 76.71% | 7,462 | 22.82% | 38 | 0.12% | 10 | 0.03% | 95 | 0.29% | 8 | 0.02% | 17,618 | 53.89% | 32,693 |
| Kalamazoo | 23,626 | 79.20% | 5,946 | 19.93% | 158 | 0.53% | 6 | 0.02% | 81 | 0.27% | 13 | 0.04% | 17,680 | 59.27% | 29,830 |
| Kalkaska | 988 | 84.59% | 160 | 13.70% | 13 | 1.11% | 5 | 0.43% | 2 | 0.17% | 0 | 0.00% | 828 | 70.89% | 1,168 |
| Kent | 56,573 | 75.12% | 18,229 | 24.21% | 154 | 0.20% | 119 | 0.16% | 211 | 0.28% | 24 | 0.03% | 38,344 | 50.91% | 75,310 |
| Keweenaw | 1,305 | 76.58% | 360 | 21.13% | 28 | 1.64% | 11 | 0.65% | 0 | 0.00% | 0 | 0.00% | 945 | 55.46% | 1,704 |
| Lake | 1,147 | 73.06% | 409 | 26.05% | 9 | 0.57% | 1 | 0.06% | 4 | 0.25% | 0 | 0.00% | 738 | 47.01% | 1,570 |
| Lapeer | 6,514 | 82.80% | 1,312 | 16.68% | 9 | 0.11% | 2 | 0.03% | 29 | 0.37% | 1 | 0.01% | 5,202 | 66.12% | 7,867 |
| Leelanau | 1,521 | 62.41% | 903 | 37.05% | 3 | 0.12% | 10 | 0.41% | 0 | 0.00% | 0 | 0.00% | 618 | 25.36% | 2,437 |
| Lenawee | 14,794 | 76.94% | 4,321 | 22.47% | 16 | 0.08% | 2 | 0.01% | 88 | 0.46% | 6 | 0.03% | 10,473 | 54.47% | 19,227 |
| Livingston | 5,642 | 72.88% | 2,075 | 26.81% | 4 | 0.05% | 20 | 0.26% | 0 | 0.00% | 0 | 0.00% | 3,567 | 46.08% | 7,741 |
| Luce | 1,466 | 80.24% | 350 | 19.16% | 1 | 0.05% | 6 | 0.33% | 4 | 0.22% | 0 | 0.00% | 1,116 | 61.08% | 1,827 |
| Mackinac | 1,879 | 57.94% | 1,355 | 41.78% | 2 | 0.06% | 1 | 0.03% | 5 | 0.15% | 1 | 0.03% | 524 | 16.16% | 3,243 |
| Macomb | 12,845 | 63.28% | 7,363 | 36.27% | 28 | 0.14% | 18 | 0.09% | 39 | 0.19% | 6 | 0.03% | 5,482 | 27.01% | 20,299 |
| Manistee | 4,129 | 60.73% | 2,624 | 38.59% | 8 | 0.12% | 23 | 0.34% | 13 | 0.19% | 2 | 0.03% | 1,505 | 22.14% | 6,799 |
| Marquette | 10,879 | 68.81% | 4,716 | 29.83% | 36 | 0.23% | 143 | 0.90% | 27 | 0.17% | 10 | 0.06% | 6,163 | 38.98% | 15,811 |
| Mason | 4,318 | 72.74% | 1,567 | 26.40% | 23 | 0.39% | 7 | 0.12% | 10 | 0.17% | 11 | 0.19% | 2,751 | 46.34% | 5,936 |
| Mecosta | 4,422 | 80.94% | 1,004 | 18.38% | 15 | 0.27% | 3 | 0.05% | 17 | 0.31% | 2 | 0.04% | 3,418 | 62.57% | 5,463 |
| Menominee | 4,255 | 50.02% | 4,198 | 49.35% | 32 | 0.38% | 8 | 0.09% | 11 | 0.13% | 3 | 0.04% | 57 | 0.67% | 8,507 |
| Midland | 4,555 | 82.25% | 964 | 17.41% | 4 | 0.07% | 12 | 0.22% | 3 | 0.05% | 0 | 0.00% | 3,591 | 64.84% | 5,538 |
| Missaukee | 1,756 | 87.19% | 247 | 12.26% | 3 | 0.15% | 8 | 0.40% | 0 | 0.00% | 0 | 0.00% | 1,509 | 74.93% | 2,014 |
| Monroe | 10,202 | 58.27% | 7,242 | 41.37% | 15 | 0.09% | 9 | 0.05% | 37 | 0.21% | 2 | 0.01% | 2,960 | 16.91% | 17,507 |
| Montcalm | 7,691 | 82.54% | 1,572 | 16.87% | 14 | 0.15% | 40 | 0.43% | 1 | 0.01% | 0 | 0.00% | 6,119 | 65.67% | 9,318 |
| Montmorency | 787 | 73.97% | 270 | 25.38% | 5 | 0.47% | 2 | 0.19% | 0 | 0.00% | 0 | 0.00% | 517 | 48.59% | 1,064 |
| Muskegon | 16,997 | 76.28% | 5,158 | 23.15% | 55 | 0.25% | 29 | 0.13% | 37 | 0.17% | 5 | 0.02% | 11,839 | 53.13% | 22,281 |
| Newaygo | 4,552 | 83.29% | 888 | 16.25% | 2 | 0.04% | 2 | 0.04% | 19 | 0.35% | 2 | 0.04% | 3,664 | 67.04% | 5,465 |
| Oakland | 45,343 | 81.53% | 10,011 | 18.00% | 140 | 0.25% | 58 | 0.10% | 43 | 0.08% | 23 | 0.04% | 35,332 | 63.53% | 55,618 |
| Oceana | 3,555 | 79.55% | 871 | 19.49% | 18 | 0.40% | 1 | 0.02% | 21 | 0.47% | 3 | 0.07% | 2,684 | 60.06% | 4,469 |
| Ogemaw | 1,630 | 73.39% | 579 | 26.07% | 4 | 0.18% | 2 | 0.09% | 6 | 0.27% | 0 | 0.00% | 1,051 | 47.32% | 2,221 |
| Ontonagon | 2,394 | 59.66% | 1,353 | 33.72% | 10 | 0.25% | 240 | 5.98% | 6 | 0.15% | 10 | 0.25% | 1,041 | 25.94% | 4,013 |
| Osceola | 3,923 | 86.66% | 582 | 12.86% | 3 | 0.07% | 17 | 0.38% | 2 | 0.04% | 0 | 0.00% | 3,341 | 73.80% | 4,527 |
| Oscoda | 476 | 86.39% | 73 | 13.25% | 2 | 0.36% | 0 | 0.00% | 0 | 0.00% | 0 | 0.00% | 403 | 73.14% | 551 |
| Otsego | 1,049 | 68.52% | 476 | 31.09% | 3 | 0.20% | 3 | 0.20% | 0 | 0.00% | 0 | 0.00% | 573 | 37.43% | 1,531 |
| Ottawa | 15,417 | 85.48% | 2,524 | 14.00% | 28 | 0.16% | 6 | 0.03% | 56 | 0.31% | 4 | 0.02% | 12,893 | 71.49% | 18,035 |
| Presque Isle | 1,992 | 65.50% | 1,029 | 33.84% | 6 | 0.20% | 3 | 0.10% | 8 | 0.26% | 3 | 0.10% | 963 | 31.67% | 3,041 |
| Roscommon | 780 | 76.25% | 236 | 23.07% | 4 | 0.39% | 3 | 0.29% | 0 | 0.00% | 0 | 0.00% | 544 | 53.18% | 1,023 |
| Saginaw | 22,467 | 65.61% | 11,555 | 33.75% | 61 | 0.18% | 21 | 0.06% | 120 | 0.35% | 18 | 0.05% | 10,912 | 31.87% | 34,242 |
| Sanilac | 7,888 | 81.59% | 1,736 | 17.96% | 10 | 0.10% | 14 | 0.14% | 16 | 0.17% | 4 | 0.04% | 6,152 | 63.63% | 9,668 |
| Schoolcraft | 1,826 | 66.81% | 877 | 32.09% | 20 | 0.73% | 1 | 0.04% | 8 | 0.29% | 1 | 0.04% | 949 | 34.72% | 2,733 |
| Shiawassee | 9,851 | 79.40% | 2,496 | 20.12% | 13 | 0.10% | 3 | 0.02% | 41 | 0.33% | 3 | 0.02% | 7,355 | 59.28% | 12,407 |
| St. Clair | 18,177 | 71.57% | 7,151 | 28.15% | 15 | 0.06% | 5 | 0.02% | 41 | 0.16% | 10 | 0.04% | 11,026 | 43.41% | 25,399 |
| St. Joseph | 8,781 | 76.05% | 2,698 | 23.37% | 26 | 0.23% | 3 | 0.03% | 34 | 0.29% | 4 | 0.03% | 6,083 | 52.68% | 11,546 |
| Tuscola | 8,188 | 84.39% | 1,464 | 15.09% | 10 | 0.10% | 41 | 0.42% | 0 | 0.00% | 0 | 0.00% | 6,724 | 69.30% | 9,703 |
| Van Buren | 9,325 | 77.39% | 2,643 | 21.93% | 34 | 0.28% | 3 | 0.02% | 40 | 0.33% | 5 | 0.04% | 6,682 | 55.45% | 12,050 |
| Washtenaw | 19,676 | 78.41% | 5,308 | 21.15% | 51 | 0.20% | 9 | 0.04% | 47 | 0.19% | 2 | 0.01% | 14,368 | 57.26% | 25,093 |
| Wayne | 265,852 | 62.30% | 157,047 | 36.80% | 1,629 | 0.38% | 1,369 | 0.32% | 369 | 0.09% | 452 | 0.11% | 108,805 | 25.50% | 426,718 |
| Wexford | 4,825 | 84.53% | 853 | 14.94% | 12 | 0.21% | 18 | 0.32% | 0 | 0.00% | 0 | 0.00% | 3,972 | 69.59% | 5,708 |
| Totals | 965,396 | 70.36% | 396,762 | 28.92% | 3,516 | 0.26% | 2,881 | 0.21% | 2,728 | 0.20% | 799 | 0.06% | 568,634 | 41.44% | 1,372,082 |
See also[]
References[]
- ^ "1928 Election for the Thirty-Sixth Term (1929-1933)". Retrieved 2018-04-03.
- ^ "1928 Presidential General Election Results - Michigan". Retrieved 2018-04-03.
- ^ "The American Presidency Project - Election of 1928". Retrieved 2018-04-03.
- ^ "1928 Presidential Election Statistics". Dave Leip’s Atlas of U.S. Presidential Elections. Retrieved 2018-03-05.
- ^ Menendez, Albert J.; The Geography of Presidential Elections in the United States, 1868-2004, pp. 225-227 ISBN 0786422173
- ^ Sullivan, Robert David; ‘How the Red and Blue Map Evolved Over the Past Century’; America Magazine in The National Catholic Review; June 29, 2016
- ^ Our Campaigns; MI US President 1928
State and district results of the 1928 United States presidential election | ||
|---|---|---|
|  | |
| |
|
- 1928 United States presidential election by state
- United States presidential elections in Michigan
- 1928 Michigan elections