Election in Washington
For the 1976 presidential election in Washington, D.C., see 1976 United States presidential election in the District of Columbia .
Main article: 1976 United States presidential election
1976 United States presidential election in Washington (state)
Nominee
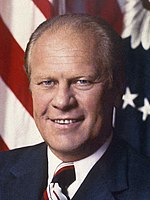
Gerald Ford Jimmy Carter
Party
Republican
Democratic
Home state
Michigan
Georgia
Running mate
Bob Dole Walter Mondale
Electoral vote
8 [a] 0
Popular vote
777,732
717,323
Percentage
50.0%
46.1%
County Results
Ford
40-50%
50-60%
60-70%
Carter
40-50%
50-60%
President before election Gerald Ford Republican
Elected President Jimmy Carter Democratic
The 1976 United States presidential election in Washington was held on November 2, 1976 as part of the 1976 United States presidential election . Incumbent President Gerald Ford won the state of Washington with 50% of the vote, which made the state 6% more Republican than the nation-at-large, [1] California Governor Ronald Reagan lost the Republican nomination to Gerald Ford in 1976 and was not on the ballot in any state. However, he was given one electoral vote by Washington faithless elector Mike Padden .
This is the most recent presidential election where Washington would vote Republican in a close nationwide contest, while backing the Republican who did not win the overall election as well. This is also the last time Washington voted more Republican than the nation-at-large. In addition, this was also the last time until Donald Trump lost two Texas electoral votes in 2016 , when a Republican presidential candidate would lose an electoral vote to a faithless elector. This is also the last time when Clallam County would back the losing candidate, which is now the county with the nation's longest streak of picking the winner of the electoral college in a presidential election.
Results [ ]
1976 United States presidential election in Washington[1]
Party
Candidate
Votes
Percentage
Electoral votes
Republican Gerald Ford (incumbent)
777,732
50.00%
8
Democratic
Jimmy Carter
717,323
46.11%
0
Independent
Eugene McCarthy
36,986
2.38%
0
Right Government
Lester Maddox
8,585
0.55%
0
American Constitution
Thomas J. Anderson
5,046
0.32%
0
Libertarian
Roger MacBride
5,042
0.32%
0
Bicentennial Reality
Margaret Wright
1,124
0.07%
0
Socialist Workers
Peter Camejo
905
0.06%
0
U.S. Labor
Lyndon LaRouche
903
0.06%
0
Communist
Gus Hall
817
0.05%
0
Socialist Labor
Julius Levin
713
0.05%
0
Socialist
Frank Zeidler
358
0.02%
0
Republican Ronald Reagan
0
0.00%
1
Totals
1,555,534
100.00%
9
Voter turnout (Voting age/Registered voters)
60% /75%
Results by county [ ]
County
Gerald Rudolph Ford
James Earl Carter
Eugene Joseph McCarthy[2]
Various candidates
Margin
Total votes cast
#
%
#
%
#
%
#
%
#
%
Adams
2,795
58.56%
1,790
37.50%
68
1.43%
115
2.41%
1,005
21.08%
4,773
Asotin
2,752
47.22%
2,898
49.73%
80
1.38%
87
1.50%
-146
-2.51%
5,828
Benton
22,135
63.95%
11,306
32.67%
677
1.96%
441
1.28%
10,829
31.33%
34,611
Chelan
10,492
56.13%
7,623
40.78%
322
1.73%
219
1.17%
2,869
15.38%
18,692
Clallam
9,132
49.67%
8,268
44.97%
475
2.60%
418
2.29%
864
4.72%
18,386
Clark
27,938
45.65%
31,080
50.78%
1,469
2.40%
597
0.98%
-3,142
-5.14%
61,201
Columbia
1,153
56.69%
829
40.76%
29
1.43%
23
1.13%
324
15.93%
2,034
Cowlitz
12,531
44.11%
14,958
52.66%
562
1.98%
293
1.03%
-2,427
-8.56%
28,406
Douglas
4,547
53.09%
3,809
44.48%
111
1.30%
83
0.97%
738
8.63%
8,564
Ferry
776
45.86%
814
48.11%
45
2.66%
55
3.25%
-38
-2.25%
1,692
Franklin
5,671
54.51%
4,369
42.00%
192
1.85%
151
1.45%
1,302
12.54%
10,403
Garfield
892
57.18%
616
39.49%
26
1.67%
23
1.48%
276
17.73%
1,560
Grant
9,192
51.87%
7,777
43.89%
400
2.26%
305
1.73%
1,415
8.01%
17,721
Grays Harbor
9,464
39.61%
13,478
56.41%
534
2.24%
331
1.39%
-4,014
-16.86%
23,893
Island
7,804
55.33%
5,859
41.54%
280
1.99%
134
0.95%
1,945
13.82%
14,104
Jefferson
2,794
45.86%
2,913
47.82%
199
3.29%
136
2.25%
-119
-1.97%
6,092
King
279,382
50.79%
248,743
45.22%
14,234
2.60%
5,483
1.00%
30,609
5.59%
550,119
Kitsap
23,124
45.56%
25,701
50.64%
1,179
2.33%
642
1.27%
-2,577
-5.09%
50,750
Kittitas
4,765
47.57%
4,858
48.50%
267
2.67%
99
0.99%
-93
-0.93%
10,017
Klickitat
2,573
44.99%
2,890
50.53%
126
2.21%
119
2.08%
-317
-5.55%
5,719
Lewis
10,933
51.65%
9,026
42.64%
557
2.64%
601
2.85%
1,907
9.03%
21,167
Lincoln
2,925
57.57%
1,978
38.93%
98
1.93%
71
1.40%
947
18.67%
5,081
Mason
4,758
42.14%
6,060
53.67%
268
2.38%
178
1.58%
-1,302
-11.56%
11,291
Okanogan
5,455
47.05%
5,543
47.81%
338
2.92%
233
2.01%
-88
-0.76%
11,595
Pacific
2,781
37.84%
4,278
58.20%
192
2.62%
77
1.05%
-1,497
-20.43%
7,350
Pend Oreille
1,516
47.82%
1,533
48.36%
62
1.96%
51
1.61%
-17
-0.54%
3,170
Pierce
74,668
46.92%
78,238
49.16%
4,316
2.72%
1,502
0.95%
-3,570
-2.25%
159,148
San Juan
1,998
53.68%
1,467
39.41%
152
4.12%
76
2.06%
531
14.38%
3,722
Skagit
13,060
48.66%
12,718
47.39%
575
2.15%
412
1.54%
342
1.28%
26,837
Skamania
1,102
41.55%
1,436
54.15%
82
3.09%
30
1.13%
-334
-12.60%
2,652
Snohomish
55,375
47.95%
55,623
48.16%
2,470
2.14%
1,731
1.50%
-248
-0.22%
115,488
Spokane
68,290
53.37%
55,660
43.50%
2,033
1.59%
1,683
1.32%
12,630
9.89%
127,954
Stevens
4,719
51.81%
3,824
41.98%
181
1.99%
357
3.93%
895
9.86%
9,109
Thurston
21,000
47.67%
21,247
48.23%
1,120
2.55%
494
1.13%
-247
-0.56%
44,056
Wahkiakum
704
41.17%
942
55.09%
32
1.87%
30
1.76%
-238
-13.93%
1,710
Walla Walla
10,883
59.15%
7,012
38.11%
328
1.78%
153
0.83%
3,871
21.07%
18,400
Whatcom
20,007
48.00%
19,739
47.36%
1,393
3.36%
373
0.90%
268
0.65%
41,679
Whitman
8,168
54.21%
6,197
41.13%
428
2.85%
215
1.43%
1,971
13.13%
15,068
Yakima
29,478
53.12%
24,223
43.65%
1,086
1.96%
624
1.13%
5,255
9.48%
55,492
Totals
777,732
50.00%
717,323
46.11%
36,986
2.38%
23,493
1.51%
60,409
3.88%
1,555,534
Notes [ ]
^ One elector voted for Ronald Reagan for president and Bob Dole for vice president
References [ ]
State and district results of the 1976 United States presidential election
Alabama Alaska Arizona Arkansas California Colorado Connecticut Delaware District of Columbia Florida Georgia Hawaii Idaho Illinois Indiana Iowa Kansas Kentucky Louisiana Maine Maryland Massachusetts Michigan Minnesota Mississippi Missouri Montana Nebraska Nevada New Hampshire New Jersey New Mexico New York North Carolina North Dakota Ohio Oklahoma Oregon Pennsylvania Rhode Island South Carolina South Dakota Tennessee Texas Utah Vermont Virginia Washington West Virginia Wisconsin Wyoming
Elections in the United States
See also
Presidential elections Senate elections House elections Gubernatorial elections