Election in Pennsylvania
Main article: 1980 United States presidential election
1980 United States presidential election in Pennsylvania
Nominee
Ronald Reagan Jimmy Carter
John B. Anderson
Party
Republican
Democratic
National Unity
Home state
California
Georgia
Illinois
Running mate
George H. W. Bush Walter Mondale
Patrick Lucey
Electoral vote
27
0
0
Popular vote
2,261,872
1,937,540
292,921
Percentage
49.59%
42.48%
6.42%
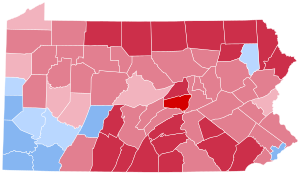
County Results
Reagan
40-50%
50-60%
60-70%
70-80%
Carter
40-50%
50-60%
President before election Jimmy Carter Democratic
Elected President Ronald Reagan Republican
The 1980 United States presidential election in Pennsylvania took place on November 4, 1980, and was part of the 1980 United States presidential election . Voters chose 27 representatives, or electors to the Electoral College , who voted for president and vice president .
Pennsylvania voted for the Republican nominee, Governor Ronald Reagan , over the Democratic nominee, President Jimmy Carter . Reagan won Pennsylvania by a margin of 7.11%. This result nonetheless made Pennsylvania about 2.6% more Democratic than the nation-at-large.
Primaries [ ] Republican Primary [ ]
Candidate
Votes
Delegates
Percent
George H. W. Bush
626,759
46
51.72%
Ronald Reagan
527,916
39
43.56%
Howard Baker Jr.
30,848
0
2.55%
Others
26,311
0
2.17%
Totals
1,211,834
85
Turnout: 55.32%
Democratic Primary [ ]
Candidate
Votes
Delegates
Percent
Ted Kennedy
736,954
99
46.04%
Jimmy Carter
732,332
99
45.75%
Others
131,534
0
8.22%
Totals
1,600,820
198
Turnout: 52.10%
Results [ ]
1980 United States presidential election in Pennsylvania[1]
Party
Candidate
Votes
Percentage
Electoral votes
Republican Ronald Reagan 2,261,872
49.59%
27
Democratic
Jimmy Carter
1,937,540
42.48%
0
Independent
John Anderson
292,921
6.42%
0
Libertarian
Edward Clark
33,263
0.73%
0
Socialist Workers
Clifton DeBerry
20,291
0.44%
0
Consumer
Barry Commoner
10,430
0.23%
0
Communist
Gus Hall
5,184
0.11%
0
Totals
4,561,501
100.00%
25
Results by county [ ]
County
Ronald Wilson Reagan
James Earl Carter
John Bayard Anderson
Various candidates
Margin
Total votes cast
#
%
#
%
#
%
#
%
#
%
Adams
13,760
61.42%
7,266
32.43%
1,139
5.08%
239
1.07%
6,494
28.99%
22,404
Allegheny
271,850
43.75%
297,464
47.87%
38,710
6.23%
13,394
2.16%
-25,614
-4.12%
621,418
Armstrong
12,955
47.80%
12,718
46.92%
1,153
4.25%
278
1.03%
237
0.87%
27,104
Beaver
30,496
38.23%
43,955
55.11%
4,549
5.70%
765
0.96%
-13,459
-16.87%
79,765
Bedford
10,930
66.57%
4,950
30.15%
416
2.53%
123
0.75%
5,980
36.42%
16,419
Berks
60,576
56.41%
36,449
33.94%
8,863
8.25%
1,497
1.39%
24,127
22.47%
107,385
Blair
28,931
62.41%
15,014
32.39%
2,011
4.34%
403
0.87%
13,917
30.02%
46,359
Bradford
13,139
62.97%
6,439
30.86%
1,068
5.12%
219
1.05%
6,700
32.11%
20,865
Bucks
100,536
55.49%
59,120
32.63%
18,107
9.99%
3,401
1.88%
41,416
22.86%
181,164
Butler
28,821
54.70%
19,711
37.41%
3,453
6.55%
704
1.34%
9,110
17.29%
52,689
Cambria
33,072
45.85%
36,121
50.08%
2,398
3.32%
540
0.75%
-3,049
-4.23%
72,131
Cameron
1,795
59.24%
1,112
36.70%
92
3.04%
31
1.02%
683
22.54%
3,030
Carbon
10,042
51.95%
8,009
41.44%
956
4.95%
322
1.67%
2,033
10.52%
19,329
Centre
20,605
48.33%
15,987
37.50%
5,247
12.31%
792
1.86%
4,618
10.83%
42,631
Chester
73,046
60.92%
34,307
28.61%
10,911
9.10%
1,632
1.36%
38,739
32.31%
119,896
Clarion
8,812
58.35%
5,472
36.24%
678
4.49%
139
0.92%
3,340
22.12%
15,101
Clearfield
15,299
54.27%
11,647
41.31%
944
3.35%
302
1.07%
3,652
12.95%
28,192
Clinton
6,288
52.36%
4,842
40.32%
733
6.10%
147
1.22%
1,446
12.04%
12,010
Columbia
12,426
53.30%
9,449
40.53%
1,197
5.13%
241
1.03%
2,977
12.77%
23,313
Crawford
16,552
53.55%
11,778
38.11%
2,095
6.78%
484
1.57%
4,774
15.45%
30,909
Cumberland
41,152
61.18%
19,789
29.42%
5,437
8.08%
882
1.31%
21,363
31.76%
67,260
Dauphin
44,039
56.18%
27,252
34.77%
6,034
7.70%
1,062
1.35%
16,787
21.42%
78,387
Delaware
143,282
55.78%
88,314
34.38%
20,907
8.14%
4,356
1.70%
54,968
21.40%
256,859
Elk
7,175
52.49%
5,898
43.15%
472
3.45%
124
0.91%
1,277
9.34%
13,669
Erie
48,918
47.42%
45,946
44.54%
6,349
6.15%
1,949
1.89%
2,972
2.88%
103,162
Fayette
19,252
38.99%
27,963
56.62%
1,348
2.73%
820
1.66%
-8,711
-17.64%
49,383
Forest
1,206
56.12%
819
38.11%
93
4.33%
31
1.44%
387
18.01%
2,149
Franklin
22,716
61.83%
12,061
32.83%
1,724
4.69%
240
0.65%
10,655
29.00%
36,741
Fulton
2,740
64.90%
1,342
31.79%
107
2.53%
33
0.78%
1,398
33.11%
4,222
Greene
5,336
37.79%
8,193
58.02%
450
3.19%
142
1.01%
-2,857
-20.23%
14,121
Huntingdon
8,140
58.44%
5,094
36.57%
567
4.07%
127
0.91%
3,046
21.87%
13,928
Indiana
15,607
49.62%
13,828
43.97%
1,708
5.43%
308
0.98%
1,779
5.66%
31,451
Jefferson
9,628
57.38%
6,296
37.53%
687
4.09%
167
1.00%
3,332
19.86%
16,778
Juniata
4,139
57.80%
2,696
37.65%
280
3.91%
46
0.64%
1,443
20.15%
7,161
Lackawanna
44,242
46.35%
45,257
47.42%
4,209
4.41%
1,739
1.82%
-1,015
-1.06%
95,447
Lancaster
79,963
67.25%
30,026
25.25%
7,442
6.26%
1,466
1.23%
49,937
42.00%
118,897
Lawrence
18,404
45.77%
19,506
48.51%
1,908
4.74%
395
0.98%
-1,102
-2.74%
40,213
Lebanon
24,495
68.99%
8,281
23.32%
2,314
6.52%
417
1.17%
16,214
45.66%
35,507
Lehigh
50,782
52.91%
34,827
36.28%
8,977
9.35%
1,399
1.46%
15,955
16.62%
95,985
Luzerne
67,822
50.21%
59,976
44.40%
4,947
3.66%
2,335
1.73%
7,846
5.81%
135,080
Lycoming
23,415
57.74%
14,609
36.02%
2,034
5.02%
495
1.22%
8,806
21.71%
40,553
McKean
9,229
60.85%
5,064
33.39%
661
4.36%
212
1.40%
4,165
27.46%
15,166
Mercer
22,372
48.54%
19,716
42.78%
3,247
7.04%
755
1.64%
2,656
5.76%
46,090
Mifflin
7,541
55.78%
5,226
38.65%
578
4.28%
175
1.29%
2,315
17.12%
13,520
Monroe
12,357
55.44%
7,551
33.88%
1,967
8.82%
414
1.86%
4,806
21.56%
22,289
Montgomery
156,996
57.81%
84,289
31.04%
26,133
9.62%
4,135
1.52%
72,707
26.77%
271,553
Montour
3,399
55.76%
2,272
37.27%
375
6.15%
50
0.82%
1,127
18.49%
6,096
Northampton
35,787
47.07%
31,920
41.98%
6,823
8.97%
1,507
1.98%
3,867
5.09%
76,037
Northumberland
20,608
56.79%
13,750
37.89%
1,515
4.17%
417
1.15%
6,858
18.90%
36,290
Perry
8,026
63.70%
3,681
29.22%
717
5.69%
175
1.39%
4,345
34.49%
12,599
Philadelphia
244,108
33.99%
421,253
58.66%
42,967
5.98%
9,772
1.36%
-177,145
-24.67%
718,100
Pike
5,249
65.83%
2,132
26.74%
452
5.67%
140
1.76%
3,117
39.09%
7,973
Potter
4,073
61.07%
2,299
34.47%
225
3.37%
72
1.08%
1,774
26.60%
6,669
Schuylkill
36,273
55.83%
24,968
38.43%
3,079
4.74%
649
1.00%
11,305
17.40%
64,969
Snyder
7,634
72.08%
2,418
22.83%
451
4.26%
88
0.83%
5,216
49.25%
10,591
Somerset
17,729
58.21%
11,695
38.40%
815
2.68%
216
0.71%
6,034
19.81%
30,455
Sullivan
1,676
57.75%
1,074
37.01%
130
4.48%
22
0.76%
602
20.74%
2,902
Susquehanna
8,994
61.23%
4,660
31.72%
786
5.35%
249
1.70%
4,334
29.51%
14,689
Tioga
8,770
63.33%
4,273
30.85%
664
4.79%
142
1.03%
4,497
32.47%
13,849
Union
6,798
66.28%
2,687
26.20%
628
6.12%
143
1.39%
4,111
40.08%
10,256
Venango
11,547
56.04%
7,800
37.86%
1,015
4.93%
242
1.17%
3,747
18.19%
20,604
Warren
9,165
57.37%
5,560
34.81%
922
5.77%
327
2.05%
3,605
22.57%
15,974
Washington
32,532
39.66%
45,295
55.23%
3,413
4.16%
778
0.95%
-12,763
-15.56%
82,018
Wayne
8,468
67.48%
3,375
26.90%
496
3.95%
209
1.67%
5,093
40.59%
12,548
Westmoreland
63,140
45.06%
68,627
48.97%
5,985
4.27%
2,387
1.70%
-5,487
-3.92%
140,139
Wyoming
5,919
64.57%
2,766
30.17%
384
4.19%
98
1.07%
3,153
34.40%
9,167
York
61,098
59.96%
33,406
32.79%
5,779
5.67%
1,608
1.58%
27,692
27.18%
101,891
Totals
2,261,872
49.59%
1,937,540
42.48%
292,921
6.42%
69,168
1.52%
324,332
7.11%
4,561,501
See also [ ] List of United States presidential elections in Pennsylvania References [ ]
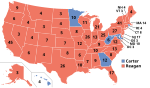
State and district results of the 1980 United States presidential election
Alabama Alaska Arizona Arkansas California Colorado Connecticut Delaware District of Columbia Florida Georgia Hawaii Idaho Illinois Indiana Iowa Kansas Kentucky Louisiana Maine Maryland Massachusetts Michigan Minnesota Mississippi Missouri Montana Nebraska Nevada New Hampshire New Jersey New Mexico New York North Carolina North Dakota Ohio Oklahoma Oregon Pennsylvania Rhode Island South Carolina South Dakota Tennessee Texas Utah Vermont Virginia Washington West Virginia Wisconsin Wyoming
(1979 ← ) 1980 United States elections (→ 1981 )
President
1980 United States presidential election Democratic primaries Republican primaries Democratic convention Republican convention U.S. U.S.
Alabama Alaska Arkansas Arizona California Colorado Connecticut Delaware Florida Georgia Hawaii Idaho Illinois Indiana Iowa Kansas Kentucky Louisiana Maine Maryland Massachusetts Michigan Minnesota Mississippi Missouri Montana Nebraska Nevada New Hampshire New Jersey New Mexico New York North Carolina North Dakota Ohio Oklahoma Oregon Pennsylvania Rhode Island South Carolina South Dakota Tennessee Texas Utah Vermont Virginia Washington West Virginia Wisconsin Wyoming Governors State Mayors